

Abstract
Immunotherapy using antibodies blocking the programmed cell death 1 (PD-1)/programmed cell death-ligand 1 (PD-L1) pathway has achieved great success in preclinical models and the clinical treatment of esophageal squamous cell carcinoma (ESCC). The c-Myc proto-oncogene helps prevent immune cells from attacking tumor cells by inducing PD-L1 expression. However, the underlying mechanisms of c-Myc and PD-L1 in ESCC remain unclear, and a thorough understanding of this regulation would allow the development of new approaches to enhance antitumor immunity. In the present study, the positive relationship between c-Myc and PD-L1 was explored in the Cancer Genome Atlas dataset using the bioinformatics tool GEPIA, and was confirmed in 105 ESCC tissues by immunostaining (r=0.516, P<0.001). The patients positive for both proteins had a poorer overall survival (P=0.032). Furthermore, in ESCC cell lines, c-Myc overexpression, depletion, and inhibition was able to regulate the expression of PD-L1. Also, the ChIP assays showed that the increase in PD-L1 expression was likely due to the binding of c-Myc to the PD-L1 promoter. Taken together, c-Myc and PD-L1 levels were significantly correlated, and c-Myc expression regulated the expression of PD-L1 in ESCC cells. In addition, a small molecule inhibitor of c-Myc effectively regulated PD-L1 expression. This indicates that synergistic therapy combining a c-Myc inhibitor with PD-L1 immunotherapy might be a promising new treatment strategy for ESCC.
Keywords: c-Myc, 10058-F4, programmed cell death-ligand 1, esophageal squamous cell carcinoma, immunotherapy
Introduction
Esophageal cancer is the seventh leading cause of cancer-related death worldwide and the fourth leading cause of cancer-related death [1]. Esophageal squamous cell carcinoma (ESCC) is the dominant esophageal cancer subtype in China, with a 5-year overall survival (OS) of 15-25% [2]. There are many challenges in treating ESCC, and several factors are associated with poor OS, including a lack of early detection, a high risk of relapse after curative surgery, and poor responses to chemotherapy, radiation, molecular targeted therapies, and immunotherapies [3-6].
The programmed cell death 1 (PD-1)/programmed cell death-ligand 1 (PD-L1) pathway is an important checkpoint responsible for tumor immune escape that has emerged as a major focus of immunotherapy [7]. The use of antibodies to block the pathway has been remarkably successful in preclinical models and in the clinical treatment of multiple cancers [8], including ESCC [9], and its success highlights the critical role of PD-L1 in tumor immune evasion [10]. However, the mechanisms underlying PD-L1 expression in ESCC cells remain unclear, and a thorough understanding of this regulation would allow the development of new approaches to enhance antitumor immunity [11].
The proto-oncogene c-Myc is overexpressed in many human cancers [12-14]. Previous studies have shown that upon overexpression, c-Myc binds to the promoter of PD-L1, increasing its expression in T cell acute lymphoblastic leukemia [15]. Similar results have been observed in neuroblastoma [16], non-small cell lung cancer [17], and pancreatic cancer [18]. These studies not only provided novel insights into the mechanisms through which c-Myc maintains malignancy, but also suggested that therapies suppressing c-Myc expression and activity could restore the immune response against cancer. In the case of ESCC, c-Myc overexpression is caused by genomic amplification of 8q24.1, which occurs in up to 43.2% of ESCC cases [19]. Moreover, c-Myc overexpression was associated with poor ESCC prognosis [20]. Nevertheless, it is unclear whether c-Myc regulates PD-L1 expression in ESCC cells. Therefore, in this study, we have examined the relationship between c-Myc and PD-L1 levels in ESCC tissues and cell lines.
Materials and methods
Analysis of c-Myc and PD-L1 expression in patients with esophageal cancer
The correlation between c-Myc expression and PD-L1 expression in esophageal cancer data from The Cancer Genome Atlas (TCGA) was explored using the open access website GEPIA (http://gepia.cancer-pku.cn/) [21].
Patient and tissue samples
Human ESCC samples were collected from patients undergoing esophagectomy at Fujian Medical University Union Hospital, Fuzhou, China, from March 2012 to April 2014. All patients received surgery and had histologically confirmed ESCC. Patients on neoadjuvant treatment, with a previous history of malignant disease, or non-squamous cell cancer were excluded. A total of 105 patients diagnosed with ESCC were enrolled in the study. Data collected and evaluated included the age, sex, tumor size, tumor location, tumor differentiation, neural invasion, vascular invasion, T stage, N stage, and tumor, node, metastasis (TNM) stage. The stage of each patient was assessed based on the 8th American Joint Committee on Cancer/Union for International Cancer Control TNM staging system. The study was approved by the Committee for the Ethical Review of Research, Fujian Medical University Union Hospital. Formalin-fixed paraffin-embedded samples were obtained for immunohistochemistry analysis.
Immunohistochemistry (IHC)
Immunohistochemical analysis was performed as previously described [22]. Anti-PD-L1 (ab213524) and anti-c-Myc (ab320720) antibodies were obtained from Abcam (Cambridge, UK). PD-L1 was detected on the cell membrane while c-Myc localized to the nucleus. Staining intensity scores were classified as 1 (weak), 2 (moderate), or 3 (strong). The percentage of positive cells was scored as 0 (≤5%), 1 (6%-25%), 2 (26%-50%), 3 (51%-75%), or 4 (76%-100%). The staining intensity and percentage of positive cells were then multiplied to generate the immunoreactivity score for each case, ranging from 0 to 12. The cutoff value was 4 for both PD-L1 [23] and c-Myc [20]. All specimens were evaluated by two pathologists who were blinded to the patients’ clinical data.
Cell lines and culture
The human ESCC cell lines KYSE140, KYSE510, Eca109, and Ec9706 were obtained from the Cell Bank, Chinese Academy of Sciences (Shanghai, China). All cell lines were genotyped for identification by the Cell Bank and tested for mycoplasma contamination. Cells were cultured in Roswell Park Memorial Institute (RPMI)-1640 medium (HyClone, Logan, UT, USA) containing 10% fetal bovine serum (Gibco-BRL, Gaithersburg, MD, USA) and 1% penicillin and streptomycin (100 μg/mL; Invitrogen Life Technologies, Beijing, China) and incubated at 37°C in a humidified incubator with 5% CO2.
Transfection
A full-length c-Myc cDNA was cloned into pcDNA3.0 to generate pcDNA-c-Myc. A short interfering (si) RNA targeting c-Myc (si-c-Myc) and a negative control siRNA (si-NC) were designed and synthesized by GenePharma (Shanghai, China). Cells were transfected using Lipofectamine 3000 (Invitrogen, Carlsbad, CA, USA), following the manufacturer’s instructions.
Quantitative reverse transcription polymerase chain reaction (qRT-PCR)
Total RNA was extracted from human ESCC cells using TRIzol reagent (Invitrogen, Carlsbad, CA, USA) according to the manufacturer’s protocol. Then, cDNA was amplified and quantified by SYBR-Green in a 7500 Real-Time PCR System (Applied Biosystems, Foster City, CA, USA). Relative quantification of gene expression levels was analyzed by the 2-ΔΔCT method and glyceraldehyde 3-phosphate dehydrogenase (GAPDH) was used for normalization. Each experiment was repeated at least three times and in triplicate. The primer sequences used for qRT-PCR were as follows: c-Myc: forward, 5’-GTCAAGAGGCGAACACACAAC-3’; reverse, 5’-TTGGACGGACAGGATGTATGC-3’; PD-L1: forward, 5’-TGGCATTTGCTGAACGCATTT-3’; reverse, 5’-TGCAGCCAGGTCTAATTGTTTT-3’, and GAPDH: forward, 5’-GGAGCGAGATCCCTCCAAAAT-3’; reverse, 5’-GGCTGTTGTCATACTTCTCATGG-3’.
Western blotting
Total proteins were isolated from cells, and protein concentrations were measured using the BCA protein assay kit (Beyotime, Shanghai, China) according to the manufacturer’s instructions. Total proteins (30 µg) were separated by 10% sodium dodecyl sulfate-polyacrylamide gel electrophoresis, then proteins were transferred to polyvinylidene difluoride membranes (Millipore, Bedford, MA, USA). The membranes were incubated with specific primary antibodies (c-Myc, 1:1000; PD-L1, 1:800; both from Abcam, Cambridge, UK) at 4°C overnight after blocking in 5% non-fat milk. Next, the membranes were incubated with horseradish peroxidase-conjugated anti-rabbit IgG antibodies (1:4000) at room temperature for 1 h. Immunoreactive proteins were visualized using an enhanced chemiluminescence detection system. A GAPDH antibody (Cell Signaling Technology, Danvers, MA, USA) was used as an internal reference. Western blots were quantified using ImageJ software.
Chromatin immunoprecipitation assays (ChIP)
ChIP assays were conducted using the Pierce Agarose ChIP Kit, according to the manufacturer’s instructions (Invitrogen). Chromatin from cells was immunoprecipitated with c-Myc antibody (Abcam, Cambridge, UK). Immunoprecipitated DNAs were recovered and analyzed by qRT-PCR for amplification of the PD-L1 promoter. Immunoglobulin G (IgG) was used as a negative control.
Statistical analysis
Chi-square tests and Fisher’s Exact Test were performed to compare c-Myc or PD-L1 expression with clinical features. Pearson correlation analysis was used to evaluate the association between c-Myc and PD-L1 levels. Univariate and multivariate analyses were used for survival analysis by the Kaplan-Meier method and Cox proportional hazards analysis, respectively. All significance tests were two-tailed and p-values <0.05 were considered significant. Statistical analysis was carried out using SPSS version 23.0 (IBM Corp., Armonk, NY, USA) and GraphPad Prism version 7.0 (San Diego, CA, USA).
Results
Relationship between c-Myc and PD-L1 levels in TCGA esophageal cancer data
We first examined the potential relationship between c-Myc and PD-L1 mRNA expression in esophageal cancer using data from TCGA database. As shown in Figure 1, c-Myc expression was positively correlated with PD-L1 expression (Pearson’s r=0.29, P<0.001).
Figure 1.
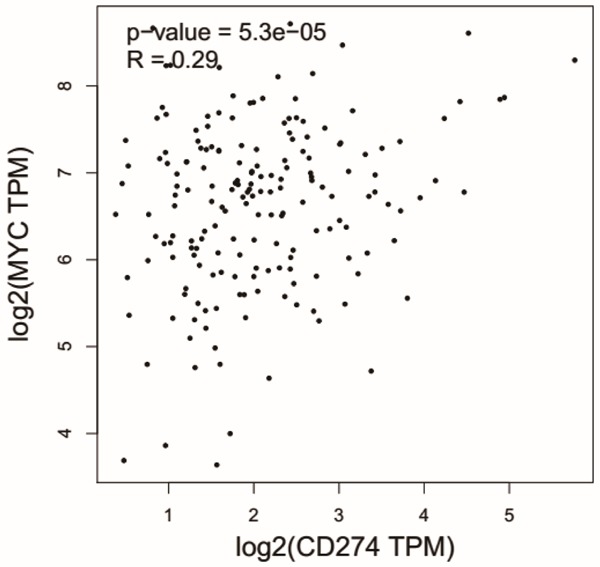
Relationship between c-Myc and PD-L1 levels in esophageal cancer cases from the TCGA dataset. Scatter plot of data points from TCGA esophageal cancer database, showing c-Myc and PD-L1 expression was positively correlated with PD-L1 expression (Pearson’s r=0.29, P<0.001).
Relationship between c-Myc and PD-L1 levels in human ESCC tissues
To confirm the influence of c-Myc on PD-L1 expression in human ESCC tissues, 105 ESCC tissues were immunostained for c-Myc and PD-L1 (Figure 2). The clinicopathological characteristics of the patients are listed in Table 1. Of the 105 samples, 47 (44.8%) were positive for PD-L1, and this was significantly correlated with the N stage (P=0.015) and TNM stage (P=0.047). c-Myc was expressed in 62 patients (59.0%); however, its expression did not significantly correlate with any clinical and pathological characteristics in this cohort. We next examined the relationship between the two proteins, and found that there was a significant positive correlation between c-Myc and PD-L1 levels (P<0.001, Pearson’s r=0.516; Table 2).
Figure 2.
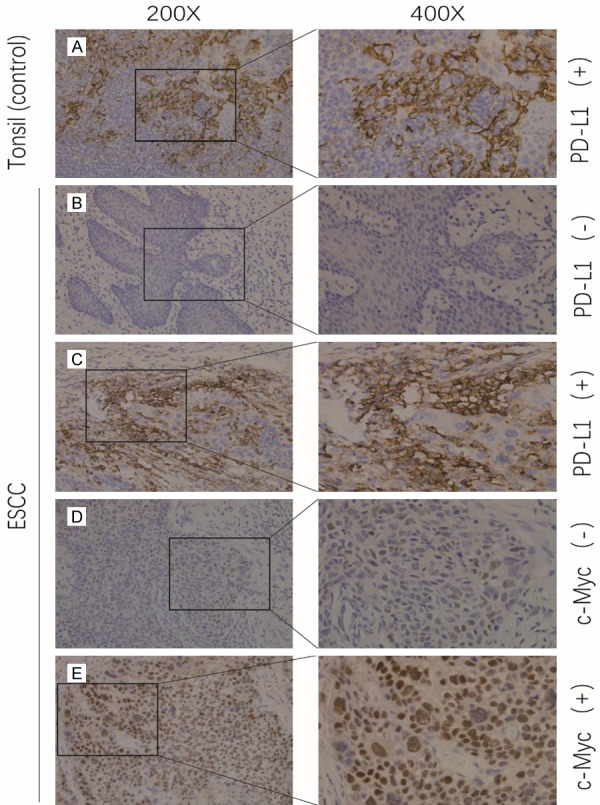
Immunostaining of PD-L1 and c-Myc in ESCC tissues. Low magnification (200×) and high magnification (400×) images were obtained for each tissue. Brown staining indicates antibody-antigen binding. The PD-L1 staining was on the cell membrane while the c-Myc staining was on the cell nucleus. (A) Human tonsil tissue was stained with an anti-PD-L1 antibody as a positive control. (B) Negative and (C) positive staining with an anti-PD-L1 antibody in human ESCC tissue. (D) Negative and (E) positive staining with an anti-c-Myc antibody in a human ESCC tissue sample.
Table 1.
Correlation between PDL1 and clinicopathological features in 105 ESCC patients
| Variables | PD-L1 expression | |||
|---|---|---|---|---|
|
| ||||
| Negative (n=58) | Positive (n=47) | P value | ||
| Age (year) | <60 | 31 | 28 | 0.558 |
| ≥60 | 27 | 19 | ||
| Gender | Female | 19 | 10 | 0.272 |
| Male | 39 | 37 | ||
| Tumor Location | Upper | 2 | 4 | 0.602* |
| Middle | 38 | 29 | ||
| Low | 18 | 14 | ||
| Tumor Size (cm) | <4 | 42 | 32 | 0.671 |
| ≥4 | 16 | 15 | ||
| Tumor Grading | G1 | 23 | 12 | 0.080* |
| G2 | 32 | 27 | ||
| G3 | 3 | 8 | ||
| Vascular Invasion | No | 50 | 39 | 0.786 |
| Yes | 8 | 8 | ||
| T Stage | T1a | 12 | 8 | 0.944 |
| T1b | 8 | 7 | ||
| T2 | 31 | 25 | ||
| T3 | 7 | 7 | ||
| N Stage | N0 | 41 | 20 | 0.015* |
| N1 | 13 | 16 | ||
| N2 | 3 | 8 | ||
| N3 | 1 | 3 | ||
| TNM Stage | I | 10 | 7 | 0.047* |
| II | 27 | 13 | ||
| III | 20 | 21 | ||
| IV | 1 | 6 | ||
used Fisher’s Exact Test.
Table 2.
Positive correlation between PD-L1 expression and MYC expression in ESCC
| c-Myc expression | PD-L1 expression | Pearson correlation | |||
|---|---|---|---|---|---|
|
|
|
||||
| Negative | Positive | Total | R | P-value | |
| Negative | 37 | 6 | 43 | 0.516 | <0.001 |
| Positive | 21 | 41 | 62 | ||
| Total | 58 | 47 | 105 | ||
To evaluate the potential effects of the clinical and pathological characteristics of ESCC on the 5-year OS, a univariate Cox proportional hazards analysis was performed. Vascular invasion (P=0.039), T stage (P=0.001), TNM stage (P=0.002), c-Myc expression (P=0.029), and PD-L1 expression (P=0.027) were significantly associated with the OS. After multivariate Cox proportional hazards analysis, T stage (P=0.001) and PD-L1 expression (P=0.019) were the main independent factors affecting OS (Table 3). In addition, patients with ESCC who were positive for both PD-L1 and c-Myc had poorer OS than the other subgroups (P=0.036; Figure 3).
Table 3.
Univariate and multivariate Cox regression analysis of factors associated with overall survival
| Variables | n | univariate analysis | multivariate analysis | ||||
|---|---|---|---|---|---|---|---|
|
|
|
||||||
| HR | 95% CI | P value | HR | 95% CI | P value | ||
| Age (year) | |||||||
| <60 | 59 | 1 | - | - | - | ||
| ≥60 | 46 | 1.553 | 0.876-2.754 | 0.132 | - | - | - |
| Gender | |||||||
| Female | 29 | 1 | - | - | - | ||
| Male | 76 | 0.777 | 0.42-1.436 | 0.421 | - | - | - |
| Tumor Location | |||||||
| Upper + Middle | 73 | 1 | - | - | - | ||
| Low | 32 | 0.588 | 0.299-1.157 | 0.124 | - | - | - |
| Tumor Size (cm) | |||||||
| <4 | 74 | 1 | - | - | - | ||
| ≥4 | 31 | 1.397 | 0.763-2.558 | 0.278 | - | - | - |
| Tumor Grading | |||||||
| G1 | 35 | 1 | - | - | - | ||
| G2 + G3 | 70 | 1.271 | 0.679-2.377 | 0.453 | - | - | - |
| Vascular Invasion | |||||||
| No | 89 | 1 | 1 | ||||
| Yes | 16 | 2.043 | 1.038-4.02 | 0.039 | 1.836 | 0.928-3.630 | 0.081 |
| T Stage | |||||||
| T1 | 35 | 1 | 1 | ||||
| T2 + T3 | 70 | 4.514 | 1.914-10.642 | 0.001 | 4.376 | 1.85-10.351 | 0.001 |
| N Stage | |||||||
| N0 | 61 | 1 | - | - | - | ||
| N1 + N2 + N3 | 44 | 1.733 | 0.977-3.073 | 0.060 | - | - | - |
| TNM Stage | |||||||
| I + II | 57 | 1 | 1 | ||||
| III + IV | 48 | 2.613 | 1.44-4.742 | 0.002 | 1.357 | 0.691-2.665 | 0.375 |
| c-Myc expression | |||||||
| Negative | 43 | 1 | 1 | ||||
| Positive | 62 | 2.042 | 1.077-3.872 | 0.029 | 1.600 | 0.758-3.376 | 0.217 |
| PD-L1 expression | |||||||
| Negative | 58 | 1 | 1 | ||||
| Positive | 47 | 1.923 | 1.077-3.434 | 0.027 | 2.009 | 1.121-3.602 | 0.019 |
Figure 3.
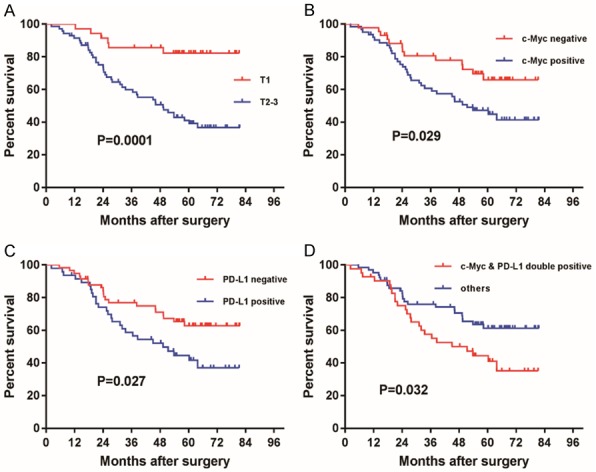
OS analysis of 105 patients with ESCC by tumor stage and c-Myc and PD-L1 expression. Kaplan-Meier survival curves of patients with ESCC comparing OS of (A) stages T1 to T2-3 (P=0.0001), (B) positive to negative c-Myc expression (P=0.029), (C) positive to negative PD-L1 expression (P=0.027), and (D) c-Myc and PD-L1 double positive expression to others (P=0.032). P-values were calculated by log-rank analysis.
Relationship between c-Myc and PD-L1 in ESCC cells
We next investigated the relationship between the expression of c-Myc and PD-L1 in unstimulated ESCC cell lines using qRT-PCR and western blotting. Of the four cell lines tested, two (KYSE140 and Ec109) showed distinct c-Myc and PD-L1 expression and two (KYSE510 and Eca9706) showed faint expression (Figure 4). The expression of PD-L1 was evaluated after transfection of a c-Myc overexpression plasmid into KYSE510 and Eca9706 cells (Figure 5) and a c-Myc siRNA into KYSE140 and Ec109 cells (Figure 6). At both the mRNA and protein levels, the expression levels of c-Myc and PD-L1 showed a clear correlation. These results demonstrate that changes in PD-L1 expression are at least partly mediated by c-Myc.
Figure 4.

c-Myc and PD-L1 expression in four ESCC cell lines. Protein and mRNA levels were evaluated by (A) western blotting and (B) qRT-PCR, respectively. Among the four cell lines tested, KYSE140 and Ec109 showed distinct c-Myc and PD-L1 expression while KYSE510 and Eca9706 showed faint expression. GAPDH was used as a loading control for western blot analysis and for normalization in qRT-PCR using the 2-ΔΔCT method (relative quantification).
Figure 5.
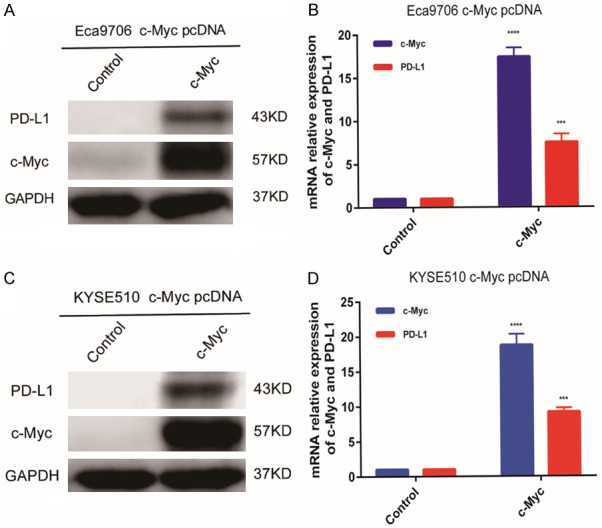
c-Myc overexpression in Eca9706 and KYSE510 ESCC cells. Eca9706 cells and KYSE510 cells were transfected with either pcDNA3 (control) or pcDNA3-c-Myc. Overexpression of c-Myc significantly induced PD-L1 expression in Eca9706 cells (A, B) and KYSE510 cells (C, D). GAPDH was used as a loading control for western blot analysis and for normalization in qRT-PCR using the 2-ΔΔCT method (relative quantification).
Figure 6.
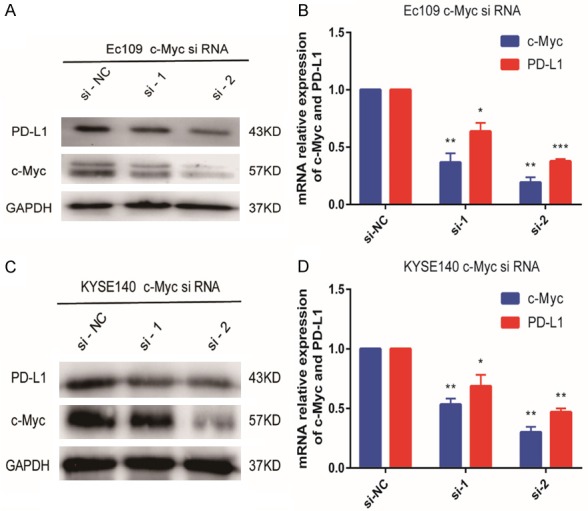
c-Myc depletion in Ec109 and KYSE140 ESCC cells. Eca9706 cells and KYSE510 cells were transfected with c-Myc siRNA. Knockdown of c-Myc significantly reduced PD-L1 expression in Ec109 cells (A, B) and KYSE140 cells (C, D).
The c-Myc inhibitor 10058-F4 inhibits PD-L1 expression in ESCC cells
We next investigated the effect of 10058-F4 on PD-L1 expression in ESCC cells. KYSE140 cells were treated with different concentrations of 10058-F4 (0, 50, and 100 μM) for 72 h. PD-L1 expression decreased in a dose-dependent manner with 10058-F4 treatment (Figure 7).
Figure 7.
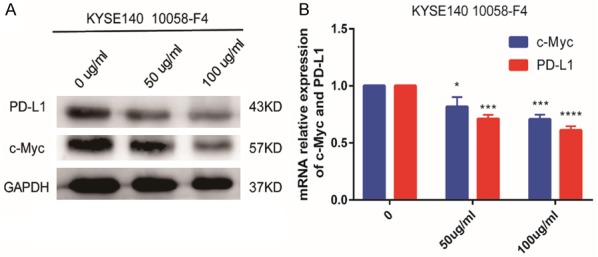
c-Myc inhibition in KYSE140 ESCC cells. KYSE140 cells were treated with different concentrations of 10058-F4 (0, 50, and 100 μM) for 72 h, and c-Myc and PD-L1 expression was evaluated by (A) western blotting and (B) qRT-PCR. PD-L1 expression decreased in a dose-dependent manner with 10058-F4 treatment.
PDL1 expression was regulated by c-Myc in ESCC cells
Given the positive correlation between c-Myc levels and PD-L1 levels in ESCC tissues, we further investigated the molecular mechanisms underpinning this link. ChIP assays were performed to investigate whether the regulation of PD-L1 by c-Myc was a direct effect. An isotype-matched IgG served as a negative control. The results showed that the increase in PD-L1 expression was likely due to the binding of c-Myc to the PD-L1 promoter, in both the Eca9706 NC and Eca9706 c-Myc cell lines (Figure 8).
Figure 8.
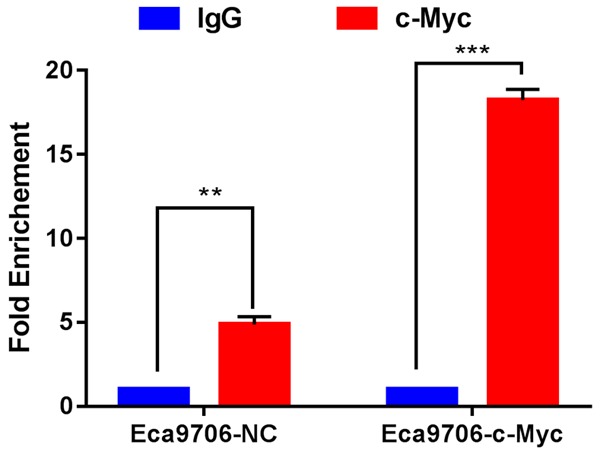
c-Myc bind to PD-L1 promoter in ESCC cells. ChIP assays were conducted on Eca9706-NC and Eca9706-c-Myc cells, using IgG negative control and c-Myc antibodies, and primers specific for the PD-L1 promoter. was showed that c-Myc increased the expression of PD-L1 when compared with IgG. The PD-L1 promoter binding was evaluated by qRT-PCR.
Discussion
The PD1/PD-L1 pathway is one of the most important signaling pathways mediating tumor immune escape [24]. Several clinical trials have reported the promising antitumor effects of PD-1/PD-L1 inhibition, however, only 12-30% of patients with esophageal cancer experience a favorable response and long term efficacy [9,25]. PD-L1 expression on the tumor cell surface is not only a target for immune checkpoint inhibitors but also an important biomarker indicating therapeutic response; hence, there is growing interest in the molecules that regulate its expression [26].
The c-Myc proto-oncogene is one of the most frequently activated oncogenes and is estimated to be involved in 20% of all human cancers, including ESCC [20], by regulating apoptosis, cell cycle progression, and other biological processes [27]. Targeting c-Myc for ESCC treatment has been an intense focus of the cancer research community [28,29]. It has been postulated that c-Myc overexpression could induce high expression of PD-L1, promoting the tumor cell’s escape from immune surveillance [15,18]. A recent study reported that c-Myc induces PD-L1 and CD47 expression by binding directly to their promoters [15]. However, in a study of hepatocellular carcinoma cells, c-Myc depletion by siRNA increased PD-L1 expression at both the mRNA and protein levels. Mechanistically, c-Myc inhibition resulted in elevated expression of signal transducer and activator of transcription 1 (STAT1), a critical component of the interferon (IFN)-γ signaling pathway, leading to increased PD-L1 expression in hepatocellular carcinoma cells exposed to IFN-γ [30].
The relationship between c-Myc and PD-L1 expression in ESCC has remained uncertain. In this study, we found that c-Myc expression was positively associated with PD-L1 expression in esophageal cancer both in the TCGA dataset and our patient data. c-Myc- and PD-L1-positivity were both associated with poor outcomes in patients with ESCC, and patients positive for both had poorer OS than the other patient subgroups. Overexpression and depletion experiments demonstrated that PD-L1 expression was regulated by c-Myc, consistent with previous studies. Moreover, the ChIP assays showed that c-Myc directly bound the PD-L1 promoter in ESCC cells.
The small molecule c-Myc inhibitor 10058-F4 exerts several tumor suppressive functions [31-33]. However, whether 10058-F4 participates in immune regulation was unknown. Our results confirmed that 10058-F4 regulated PD-L1 expression in ESCC, indicating a role in tumor immune escape. They also suggest that therapies suppressing c-Myc expression may decrease PD-L1 expression in ESCC cells. Therefore, a combination therapy composed of a c-Myc inhibitor and PD-1/PD-L1 pathway immunotherapy might have synergistic effects on ESCC.
This study has some limitations. First, we only recruited a small number of cases from a single institute. Second, it was a retrospective study using surgical samples of squamous cell cancer. Third, the response to immune checkpoint inhibitors combined with a c-Myc inhibitor could not be evaluated in vivo. It will be necessary to examine the possibility of synergistic inhibition of ESCC using anti-PD-L1 antibodies and c-Myc inhibitors, which are constantly being developed. Multi-institutional, prospective studies combined with the analysis of treatment responses to immune checkpoint inhibitors will be needed to evaluate the potential of this treatment strategy.
Conclusions
In summary, we have analyzed the relationship between c-Myc and PD-L1 levels in ESCC, and demonstrate that c-Myc regulates PD-L1 expression in ESCC cells. A small molecule inhibitor of c-Myc, 10058-F4, could also effectively regulate PD-L1 expression. This indicates that a combination therapy composed of a c-Myc inhibitor and a PD-L1 immunotherapy might be a promising new treatment strategy for ESCC.
Acknowledgements
This work was supported by the Startup Fund for Scientific Research, Fujian Medical University (grant number 2018QH2026). We would like to thank Editage (www.editage.cn) for English language editing.
Disclosure of conflict of interest
None.
References
- 1.Bray F, Ferlay J, Soerjomataram I, Siegel RL, Torre LA, Jemal A. Global cancer statistics 2018: GLOBOCAN estimates of incidence and mortality worldwide for 36 cancers in 185 countries. CA Cancer J Clin. 2018;68:394–424. doi: 10.3322/caac.21492. [DOI] [PubMed] [Google Scholar]
- 2.Wang C, Wang J, Chen Z, Gao Y, He J. Immunohistochemical prognostic markers of esophageal squamous cell carcinoma: a systematic review. Chin J Cancer. 2017;36:65. doi: 10.1186/s40880-017-0232-5. [DOI] [PMC free article] [PubMed] [Google Scholar]
- 3.Codipilly DC, Qin Y, Dawsey SM, Kisiel J, Topazian M, Ahlquist D, Iyer PG. Screening for esophageal squamous cell carcinoma: recent advances. Gastrointest Endosc. 2018;88:413–426. doi: 10.1016/j.gie.2018.04.2352. [DOI] [PMC free article] [PubMed] [Google Scholar]
- 4.Jeene PM, van Laarhoven HWM, Hulshof MCCM. The role of definitive chemoradiation in patients with non-metastatic oesophageal cancer. Best Pract Res Clin Gastroenterol. 2018;36-37:53–59. doi: 10.1016/j.bpg.2018.11.011. [DOI] [PubMed] [Google Scholar]
- 5.Kashyap MK, Abdel-Rahman O. Expression, regulation and targeting of receptor tyrosine kinases in esophageal squamous cell carcinoma. Mol Cancer. 2018;17:54. doi: 10.1186/s12943-018-0790-4. [DOI] [PMC free article] [PubMed] [Google Scholar]
- 6.Kojima T, Doi T. Immunotherapy for esophageal squamous cell carcinoma. Curr Oncol Rep. 2017;19:33. doi: 10.1007/s11912-017-0590-9. [DOI] [PMC free article] [PubMed] [Google Scholar]
- 7.Zou W, Wolchok JD, Chen L. PD-L1 (B7-H1) and PD-1 pathway blockade for cancer therapy: mechanisms, response biomarkers, and combinations. Sci Transl Med. 2016;8:328rv4. doi: 10.1126/scitranslmed.aad7118. [DOI] [PMC free article] [PubMed] [Google Scholar]
- 8.Chen L, Han X. Anti-PD-1/PD-L1 therapy of human cancer: past, present, and future. J Clin Invest. 2015;125:3384–3391. doi: 10.1172/JCI80011. [DOI] [PMC free article] [PubMed] [Google Scholar]
- 9.Doi T, Piha-Paul SA, Jalal SI, Saraf S, Lunceford J, Koshiji M, Bennouna J. Safety and antitumor activity of the anti-programmed death-1 antibody pembrolizumab in patients with advanced esophageal carcinoma. J. Clin. Oncol. 2018;36:61–67. doi: 10.1200/JCO.2017.74.9846. [DOI] [PubMed] [Google Scholar]
- 10.Alsaab HO, Sau S, Alzhrani R, Tatiparti K, Bhise K, Kashaw SK, Iyer AK. PD-1 and PD-L1 checkpoint signaling inhibition for cancer immunotherapy: mechanism, combinations, and clinical outcome. Front Pharmacol. 2017;8:561. doi: 10.3389/fphar.2017.00561. [DOI] [PMC free article] [PubMed] [Google Scholar]
- 11.Sun C, Mezzadra R, Schumacher TN. Regulation and function of the PD-L1 checkpoint. Immunity. 2018;48:434–452. doi: 10.1016/j.immuni.2018.03.014. [DOI] [PMC free article] [PubMed] [Google Scholar]
- 12.Wang X, Liu Y, Shao D, Qian Z, Dong Z, Sun Y, Xing X, Cheng X, Du H, Hu Y, Li Y, Li L, Dong B, Li Z, Wu A, Wu X, Bu Z, Zong X, Zhu G, Ji Q, Wen XZ, Zhang LH, Ji JF. Recurrent amplification of MYC and TNFRSF11B in 8q24 is associated with poor survival in patients with gastric cancer. Gastric Cancer. 2016;19:116–127. doi: 10.1007/s10120-015-0467-2. [DOI] [PubMed] [Google Scholar]
- 13.Lee KS, Kwak Y, Nam KH, Kim DW, Kang SB, Choe G, Kim WH, Lee HS. c-MYC copy-number gain is an independent prognostic factor in patients with colorectal cancer. PLoS One. 2015;10:e0139727. doi: 10.1371/journal.pone.0139727. [DOI] [PMC free article] [PubMed] [Google Scholar]
- 14.Jung M, Russell AJ, Liu B, George J, Liu PY, Liu T, DeFazio A, Bowtell DD, Oberthuer A, London WB, Fletcher JI, Haber M, Norris MD, Henderson MJ. A Myc activity signature predicts poor clinical outcomes in Myc-associated cancers. Cancer Res. 2017;77:971–981. doi: 10.1158/0008-5472.CAN-15-2906. [DOI] [PubMed] [Google Scholar]
- 15.Casey SC, Tong L, Li Y, Do R, Walz S, Fitzgerald KN, Gouw AM, Baylot V, Gutgemann I, Eilers M, Felsher DW. MYC regulates the antitumor immune response through CD47 and PD-L1. Science. 2016;352:227–231. doi: 10.1126/science.aac9935. [DOI] [PMC free article] [PubMed] [Google Scholar]
- 16.Melaiu O, Mina M, Chierici M, Boldrini R, Jurman G, Romania P, D’Alicandro V, Benedetti MC, Castellano A, Liu T, Furlanello C, Locatelli F, Fruci D. PD-L1 is a therapeutic target of the bromodomain inhibitor JQ1 and, combined with HLA class I, a promising prognostic biomarker in neuroblastoma. Clin Cancer Res. 2017;23:4462–4472. doi: 10.1158/1078-0432.CCR-16-2601. [DOI] [PubMed] [Google Scholar]
- 17.Kim EY, Kim A, Kim SK, Chang YS. MYC expression correlates with PD-L1 expression in non-small cell lung cancer. Lung Cancer. 2017;110:63–67. doi: 10.1016/j.lungcan.2017.06.006. [DOI] [PubMed] [Google Scholar]
- 18.Pan Y, Fei Q, Xiong P, Yang J, Zhang Z, Lin X, Pan M, Lu F, Huang H. Synergistic inhibition of pancreatic cancer with anti-PD-L1 and c-Myc inhibitor JQ1. Oncoimmunology. 2019;8:e1581529. doi: 10.1080/2162402X.2019.1581529. [DOI] [PMC free article] [PubMed] [Google Scholar]
- 19.Huang J, Jiang D, Zhu T, Wang Y, Wang H, Wang Q, Tan L, Zhu H, Yao J, Hou Y. Prognostic significance of c-MYC amplification in esophageal squamous cell carcinoma. Ann Thorac Surg. 2019;107:436–443. doi: 10.1016/j.athoracsur.2018.07.077. [DOI] [PubMed] [Google Scholar]
- 20.Lian Y, Niu X, Cai H, Yang X, Ma H, Ma S, Zhang Y, Chen Y. Clinicopathological significance of c-MYC in esophageal squamous cell carcinoma. Tumour Biol. 2017;39:1010428317715804. doi: 10.1177/1010428317715804. [DOI] [PubMed] [Google Scholar]
- 21.Tang Z, Li C, Kang B, Gao G, Li C, Zhang Z. GEPIA: a web server for cancer and normal gene expression profiling and interactive analyses. Nucleic Acids Res. 2017;45:W98–W102. doi: 10.1093/nar/gkx247. [DOI] [PMC free article] [PubMed] [Google Scholar]
- 22.Zhou S, Zhao L, Liang Z, Liu S, Li Y, Liu S, Yang H, Liu M, Xi M. Indoleamine 2,3-dioxygenase 1 and programmed cell death-ligand 1 co-expression predicts poor pathologic response and recurrence in esophageal squamous cell carcinoma after neoadjuvant chemoradiotherapy. Cancers (Basel) 2019;11 doi: 10.3390/cancers11020169. [DOI] [PMC free article] [PubMed] [Google Scholar]
- 23.Tanaka K, Miyata H, Sugimura K, Kanemura T, Hamada-Uematsu M, Mizote Y, Yamasaki M, Wada H, Nakajima K, Takiguchi S, Mori M, Doki Y, Tahara H. Negative influence of programmed death-1-ligands on the survival of esophageal cancer patients treated with chemotherapy. Cancer Sci. 2016;107:726–733. doi: 10.1111/cas.12938. [DOI] [PMC free article] [PubMed] [Google Scholar]
- 24.Tumeh PC, Harview CL, Yearley JH, Shintaku IP, Taylor EJ, Robert L, Chmielowski B, Spasic M, Henry G, Ciobanu V, West AN, Carmona M, Kivork C, Seja E, Cherry G, Gutierrez AJ, Grogan TR, Mateus C, Tomasic G, Glaspy JA, Emerson RO, Robins H, Pierce RH, Elashoff DA, Robert C, Ribas A. PD-1 blockade induces responses by inhibiting adaptive immune resistance. Nature. 2014;515:568–571. doi: 10.1038/nature13954. [DOI] [PMC free article] [PubMed] [Google Scholar]
- 25.Kudo T, Hamamoto Y, Kato K, Ura T, Kojima T, Tsushima T, Hironaka S, Hara H, Satoh T, Iwasa S, Muro K, Yasui H, Minashi K, Yamaguchi K, Ohtsu A, Doki Y, Kitagawa Y. Nivolumab treatment for oesophageal squamous-cell carcinoma: an open-label, multicentre, phase 2 trial. Lancet Oncol. 2017;18:631–639. doi: 10.1016/S1470-2045(17)30181-X. [DOI] [PubMed] [Google Scholar]
- 26.Shien K, Papadimitrakopoulou VA, Wistuba II. Predictive biomarkers of response to PD-1/PD-L1 immune checkpoint inhibitors in non-small cell lung cancer. Lung Cancer. 2016;99:79–87. doi: 10.1016/j.lungcan.2016.06.016. [DOI] [PMC free article] [PubMed] [Google Scholar]
- 27.Dang CV, O’Donnell KA, Zeller KI, Nguyen T, Osthus RC, Li F. The c-Myc target gene network. Semin Cancer Biol. 2006;16:253–264. doi: 10.1016/j.semcancer.2006.07.014. [DOI] [PubMed] [Google Scholar]
- 28.Zhou YX, Zhou KM, Liu Q, Wang H, Wang W, Shi Y, Ma YQ. The effect of Glut1 and c-myc on prognosis in esophageal squamous cell carcinoma of Kazakh and Han patients. Future Oncol. 2018;14:1801–1815. doi: 10.2217/fon-2017-0734. [DOI] [PubMed] [Google Scholar]
- 29.Wang J, Liu Z, Wang Z, Wang S, Chen Z, Li Z, Zhang M, Zou J, Dong B, Gao J, Shen L. Targeting c-Myc: JQ1 as a promising option for c-Myc-amplified esophageal squamous cell carcinoma. Cancer Lett. 2018;419:64–74. doi: 10.1016/j.canlet.2018.01.051. [DOI] [PubMed] [Google Scholar]
- 30.Zou J, Zhuang M, Yu X, Li N, Mao R, Wang Z, Wang J, Wang X, Zhou H, Zhang L, Shi Y. MYC inhibition increases PD-L1 expression induced by IFN-gamma in hepatocellular carcinoma cells. Mol Immunol. 2018;101:203–209. doi: 10.1016/j.molimm.2018.07.006. [DOI] [PubMed] [Google Scholar]
- 31.Zirath H, Frenzel A, Oliynyk G, Segerstrom L, Westermark UK, Larsson K, Munksgaard Persson M, Hultenby K, Lehtio J, Einvik C, Pahlman S, Kogner P, Jakobsson PJ, Henriksson MA. MYC inhibition induces metabolic changes leading to accumulation of lipid droplets in tumor cells. Proc Natl Acad Sci U S A. 2013;110:10258–10263. doi: 10.1073/pnas.1222404110. [DOI] [PMC free article] [PubMed] [Google Scholar]
- 32.Bashash D, Sayyadi M, Safaroghli-Azar A, Sheikh-Zeineddini N, Riyahi N, Momeny M. Small molecule inhibitor of c-Myc 10058-F4 inhibits proliferation and induces apoptosis in acute leukemia cells, irrespective of PTEN status. Int J Biochem Cell Biol. 2019;108:7–16. doi: 10.1016/j.biocel.2019.01.005. [DOI] [PubMed] [Google Scholar]
- 33.Huang MJ, Cheng YC, Liu CR, Lin S, Liu HE. A small-molecule c-Myc inhibitor, 10058-F4, induces cell-cycle arrest, apoptosis, and myeloid differentiation of human acute myeloid leukemia. Exp Hematol. 2006;34:1480–1489. doi: 10.1016/j.exphem.2006.06.019. [DOI] [PubMed] [Google Scholar]