Abstract
During the opening moves of a chess game, a player (typically White) may offer a number of gambits, which involve sacrificing a chess piece for an opponent for capture to achieve long-term positional advantages. One of the most popular gambits is called the Queen’s Gambit and involves White offering a pawn to Black, which will open a lane for White’s Queen if accepted by Black. In the present study, the generalized matching law (GML) was applied to chess openings involving the Queen’s Gambit using over 71,000 archived chess games. Overall, chess players’ opening moves involving the Queen’s Gambit exhibited orderly matching as predicted by the GML, and the GML accounted for more variance in players’ chess decision making as their relative playing experience increased. This study provides support for the generality of the GML and its application to complex operant behavior outside of laboratory contexts.
Keywords: chess, choice, decision-making, generalized matching law
Organisms allocate their behavior among concurrently available response alternatives as a function of the relative reinforcement the alternatives produce (e.g., Hernstein, 1970). The matching law is a mathematical description of this relation between relative responding and rates of reinforcement (Hernstein, 1961). A modified version of the matching law, referred to as the generalized matching law (GML; Baum, 1974), can describe systematic deviation from strict matching in terms of the sensitivity of behavior to relative reinforcement rate or as a function of variables other than rate of reinforcement (e.g., response effort, reinforcement quality). The GML predicts that relative response allocation varies linearly with relative reinforcement rate when log transformed, and is expressed by the following relation:
where B1 represents the rate of responding on one response alternative and B2 represents the rate of responding on the second response alternative; R1 and R2 represent the relative rates of reinforcement for those alternatives. The slope of the line (a) reflects sensitivity to reinforcement, and the intercept (b) reflects bias for one of the response alternatives when equality of reinforcement would predict indifference between the response choices (e.g., Baum, 1974). If behavior matches reinforcement perfectly, the slope of the function, a, equals one and the intercept, log b, is zero. Sensitivity to reinforcement more (a > 1) or less (a < 1) extreme than strict matching would predict is known as overmatching or undermatching, respectively (see McDowell, 2013).
The GML has described complex operant behavior in a variety of contexts, including severe problem behavior (Borrero & Vollmer, 2002), conversation allocation (Borrero et al., 2007), academic behavior (Mace, Neef, Shade, & Mauro, 1994), risky sexual behavior (Bulow & Meller, 1998), and both simulated (Schenk & Reed, 2019) and nonsimulated sport-related behavior (e.g., Alferink, Critchfield, Hitt, & Higgins, 2009; Falligant, Boomhower, & Pence, 2016; Reed, Critchfield, & Martens, 2006; Vollmer & Bourret, 2000). For example, in the context of sports, research has shown that both collegiate and professional basketball players attempt more three-point shots (relative to two-point shots) as the relative number of three-point shots scored increases (Vollmer & Bourret, 2000). Research has also shown that shot selection is sensitive to alterations in the distance of the three-point line (that arose from rule changes in 1994 and 1997) in that the relative number of three-point shot attempts increased as the relative number of three-point shots scored increased (Romanowich, Bourret, & Vollmer, 2007). Other variables, such as a high team success rate, more competitive NCAA divisions (i.e., Division I and Division II), and whether players are starters (as opposed to substitutes) are associated with increased sensitivity of shot selection to relative rates of shots made (Alferink et al., 2009). Thus, a wealth of research suggests parameters of the GML are sensitive to subtle variations in complex operant behavior across a variety of populations and contextual variables.
Importantly, the GML has advanced the analysis of choice occurring in both laboratory and naturalistic environments, serving as a powerful vehicle of translational behavioral research (see Mace & Critchfield, 2010; Vollmer, 2011). Continuing to evaluate the utility of the GML in describing complex choice behavior has the potential to advance the study of behavior analysis. For example, the extent to which this choice model accurately predicts behavior in other complex activities, such as chess, where the number of legal moves a player may make during a game is extremely large (10120; Shannon, 1950), is unknown. Chess can serve as a unique model for behavioral research (see Mechner, 2010), and there is a considerable body of quantitative research evaluating various aspects of the game of chess, such as the power-law distribution of chess openings (Blasius & Tönjes, 2009). Thus, a behavior-analytic assessment of chess openings using the GML may speak to the generality of the GML in describing complex choice behavior, highlighting the applicability of basic behavioral concepts to novel, naturally occurring operant phenomena.
During the opening moves of a chess game, a player (typically White) may offer a number of gambits, which involves presenting material to an opponent for capture in order to gain a positional advantage. In other words, gambits (if accepted by the opponent) typically result in a short-term loss of chess pieces, but long-term positional advantages. One of the most popular gambits offered during chess openings is the Queen’s Gambit (e.g., Kasparov & Keene, 1994; Ramiz, 2006). To offer the Queen’s Gambit, White opens by advancing the pawn in front of the King two spaces (1.d4) and Black counters by advancing the pawn in front of the King two spaces as well (1.d5). White then sets up the gambit by moving the pawn in front of the Queen two spaces (2.c4), as Black can then accept the gambit and capture the c4 pawn and gain a material advantage over White (see Figure 1). If accepted, White can more easily develop his/her powerful pieces and occupy centrally located squares in the board for a long-term strategic advantage. If declined, Black does not cede the positional advantage to White, but foregoes a material advantage and allows White to advance two pawns to the center of the board.
Figure 1.
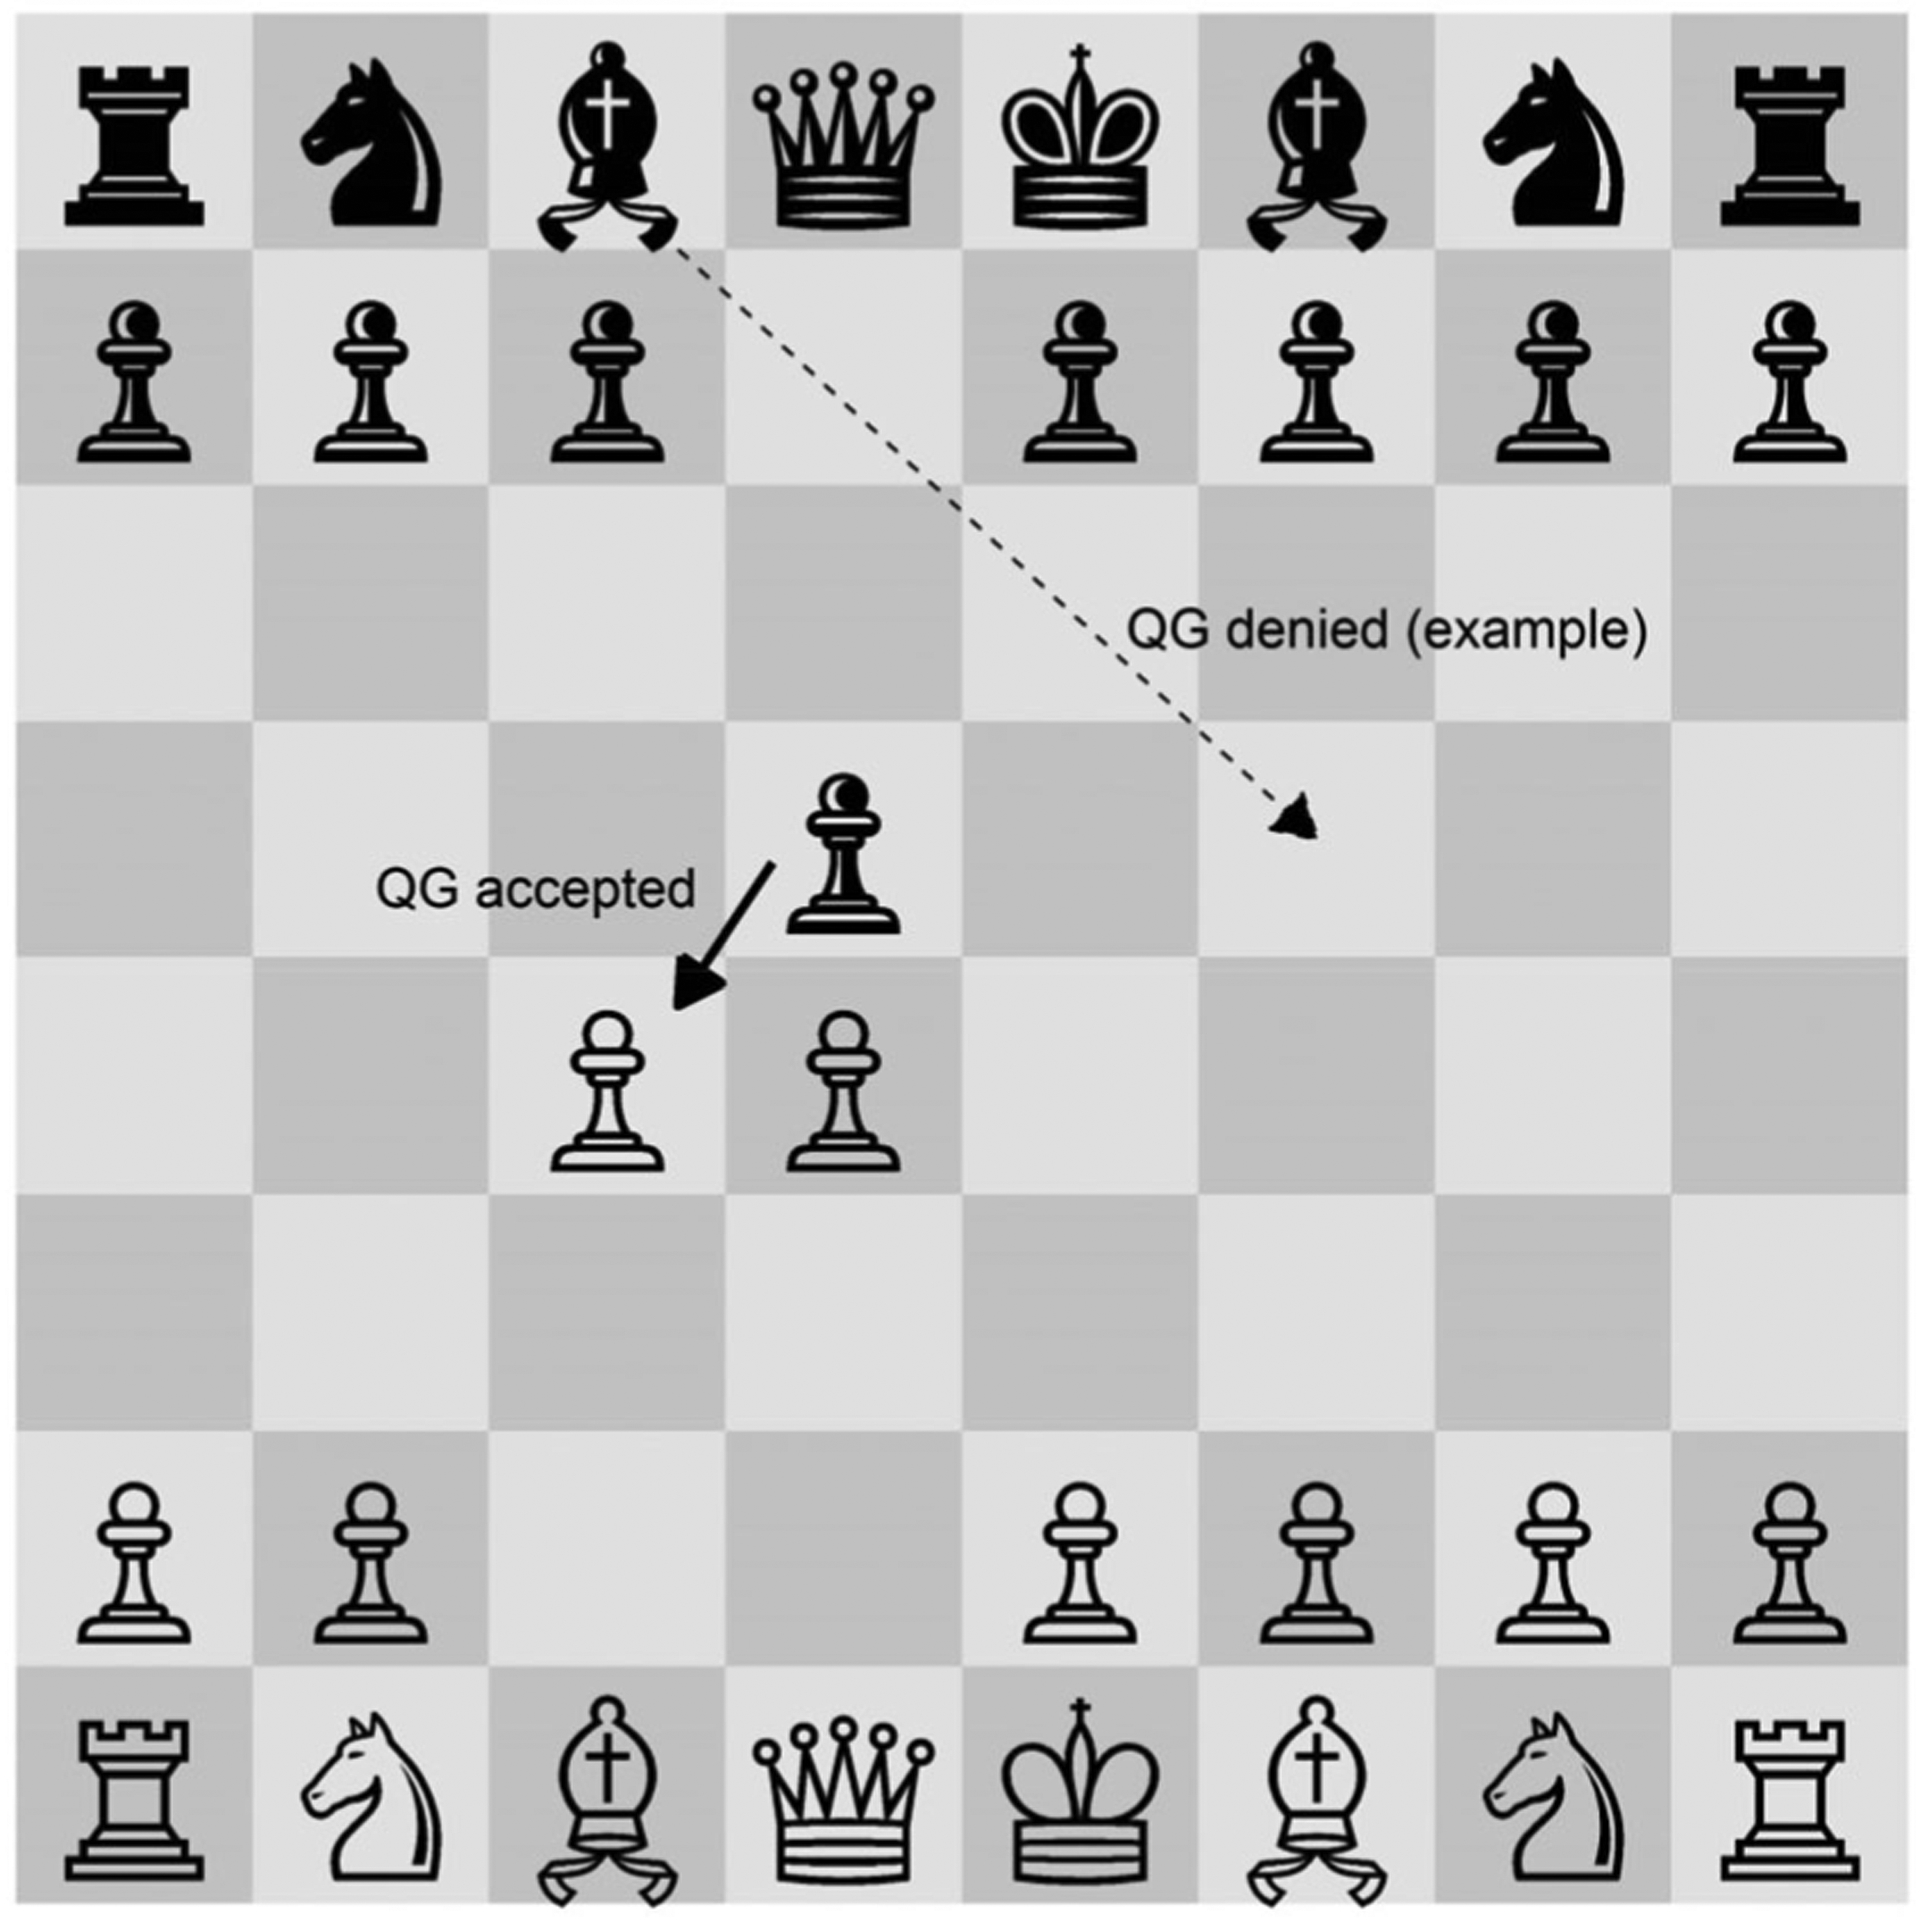
Illustration of the Queen’s Gambit. If black takes the pawn offered by white, the gambit is accepted. If black makes any other move, the gambit is denied. QG = Queen’s Gambit.
The goal of the present study was to analyze the ratio of chess games in which the Queen’s Gambit was not offered versus games in which it was offered relative to the ratio of victories accrued without the Queen’s Gambit to victories accrued with it using a sample of 71,716 archived chess games played by 348 tournament chess players. In other words, the purpose of the present study was to assess the degree to which White’s use of the Queen’s Gambit is accounted for by the GML. Additionally, given that previous research has suggested differences in skill or experience levels are associated with changes in parameters of the GML (i.e., sensitivity and bias) within sports contexts (e.g., Alferink et al., 2009), differences in sensitivity, bias, and variance accounted for by the GML across chess players’ experience levels were assessed.
METHOD
Data Source
All data were acquired through ScidBase (Scid version 4.6.4; SCID, 2017), a large online database of chess games that has been utilized for multiple studies of statistical phenomena in the game (Blasius & Tönjes, 2009; Maslov, 2009). Each record in this database represents a single game of chess archived in Portable Game Notation (PGN), a digital-friendly format for documenting chess play. A single PGN record typically includes a variety of information about a particular match, including the names of the players, the date and location of the match, the moves executed by each player in a standardized algebraic format, and other contextual information about the match (e.g., commentary, player rankings).
Data Acquisition and Processing
On November 4, 2017, the experimenters downloaded every available record in the standard database (n = 127,810). Of these initial games, 108,008 included sufficient information to identify the players and were retained for further analysis, during which a range of game-specific variables were extracted. These variables included the name of the White player, whether that player offered the Queen’s Gambit to Black, whether Black accepted the gambit, and whether the White player ultimately won the match. The experimenters then calculated aggregate statistics for each player (n = 1,336), including the total number of games played as White, the number of games in which they offered the Queen’s Gambit, in how many games their gambits were accepted, and the number of games won and lost with and without the Queen’s Gambit. The program R 3.5.3 (R Core Team, 2017) generated all statistical analyses and figures.
Minimum game requirement.
A preliminary analysis of the database revealed that players offered the Queen’s Gambit in approximately 11% of all games. This implies players with a small number of games in the database may not have had sufficient opportunities to offer and benefit from the Queen’s Gambit, preventing reliable assessment of their conformity to the GML. To address this limitation, a prospective power analysis was conducted to estimate the number of observed games a player would need to have played in order for the probability of offering 5 Queen’s Gambits to reach at least .80 (i.e., the typical power threshold; Cohen, 1992). This was achieved using the Negative Binomial distribution, which is commonly implemented for sampling questions of this kind (Casella & Berger, 2001). The results indicated that any given player would need to play 61 games before that player would have at least an 80% chance of producing 5 Queen’s Gambits, assuming players offered the Queen’s Gambit in 10% of games on average (rounded down from 11% to be conservative). Thus, the games of players that had at least 61 games in the database were included in the analysis, resulting in a final dataset of 71,716 games played by 348 players (mean games per player = 206.08, SD = 147.48, min. = 61, max. = 858).
Analytic Procedure
Research on the GML has shown that behavior allocation is often characterized both by a baseline bias favoring one alternative over its counterparts and by deviation in sensitivity (over or under) to relative reinforcement from the prediction of strict matching (McDowell, 2013). To estimate each of these parameters among chess players, we conducted a linear regression analysis. The outcome variable was the ratio of games in which a White player did not offer the Queen’s Gambit to Games in which White did offer the gambit (i.e., a behavior ratio).1 The predictor variable was the ratio of victories White accrued without the Queen’s gambit to victories accrued with it (i.e., a reinforcement ratio). Prior to analysis, each of these quantities were converted to log10 units to linearize their relationship. In the resulting regression model, the intercept represents the bias parameter of the GML and the slope represents the sensitivity (McDowell, 2013). Thus, a regression model with an intercept of 0 and a slope of 1 would represent “perfect” matching; values significantly different from these would represent deviations from the strict interpretation of the matching law that are greater than would be expected by chance. To analyze changing levels of conformity to the GML as the number of games played increased, players were later broken into brackets based on the number of games they had played. This analysis was reconducted on each bracket, separately, and regression results across brackets were compared. In the second regression analysis, the possibility that players’ behavior conforms more strongly to the matching law as they are exposed to additional games—and thus opportunities for reinforcement (i.e., winning)—was also considered. This was achieved by recon-ducting the previous GML regression analysis, but with players grouped by the number of games played. Note that, to ensure a balanced analysis, only a player’s last 100 games were included for this analysis.
Of concern, aggregate data may produce illusory matching effects and suggest functional response–reinforcer relations at a molar level even when there is no differential reinforcement to facilitate learning. For example, consider a hypothetical group of players who intermittently choose to rotate all their pieces by 90 degrees before some of their games. Although such behavior should have no impact on a victory (and thus putative reinforcement), it is still the case that players who perform the rotation in twice as many games will accrue twice as many wins with it (holding the base rate for chess wins constant across groups). This will produce a matching pattern similar to our observed results in Figure 2, as well as a significant and positive regression slope, even though there is no possibility of learning through differential reinforcement (i.e., no functional relation between piece rotation and victory). Note that this is true of individual-level time series as well. A player who exhibits variable preference for the piece turning strategy over time will still produce an illusory matching-like pattern similar to those of the players in Figure 3. Thus, it is possible the Queen’s Gambit reflects the same illusory phenomenon. In other words, our observed results may be a function of base rates for the probability of a victory, and do not necessarily imply a functional relation that players have learned through differential success with the Queen’s Gambit. To address this concern, consider three quantities: (1) the probability a player offers the Queen’s Gambit in the next game after winning with it in the previous game, (2) the probability a player offers the Queen’s Gambit in the next game after winning with a non-Queen’s Gambit opening in the previous game, and (3) the difference, D, between the two. If the Queen’s Gambit has no effect on victories, D = 0. However, if there is differential reinforcement for using the Queen’s Gambit, D > 0. We randomly sampled n = 100 players who had played at least 60 games (per our power analysis above) and had accrued at least one win with and without the Queen’s Gambit. We also took the event records (games) of the n = 100 players above and shuffled them randomly (within players) n = 1,000 times, recording the resulting Dsim for each iteration. This strategy mirrors a scenario where the probability a player uses the Queen’s Gambit in the next round has nothing to do with the previous round (i.e., a context where no learning can occur).
Figure 2.
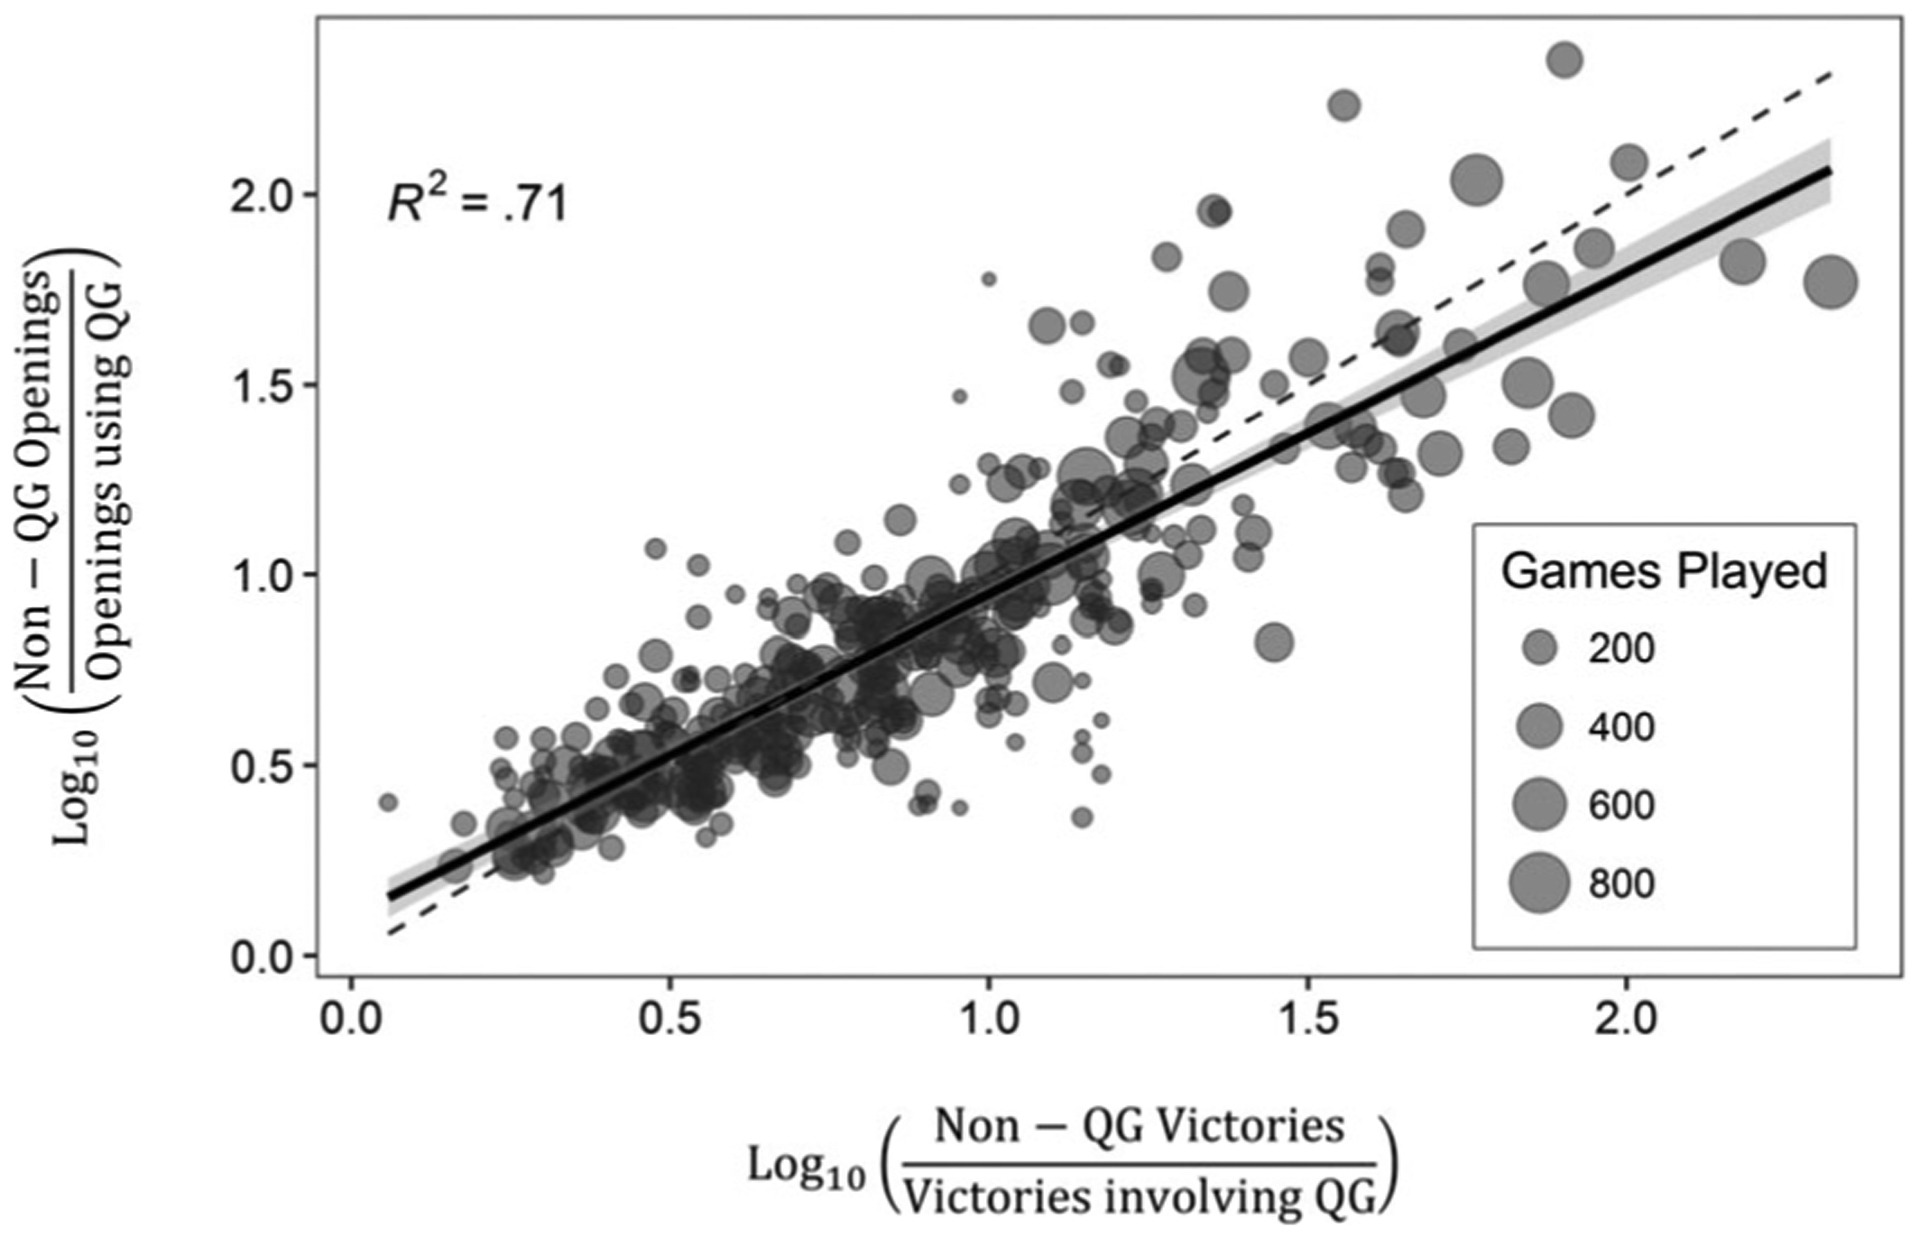
White’s opening chess moves conform to the generalized matching law (GML). Points represent White players. The size of each point grows in proportion to the number of games completed by the player in the database. Vertical axis represents the ratio of each player’s non-Queens Gambit (QG) openings to QG openings (log10 scale); horizontal axis represents the ratio of victories each player accrued through non-QG openings relative to QG openings (log10 scale). The dashed line represents theoretically perfect conformity to the GML; the solid line represents the line of best fit to the data (estimated using Ordinary Least Squares). The shaded ribbon around the line of best fit represents the 95% confidence interval for the slope of that line. R2 is the proportion variance explained by the line of best fit.
Figure 3.
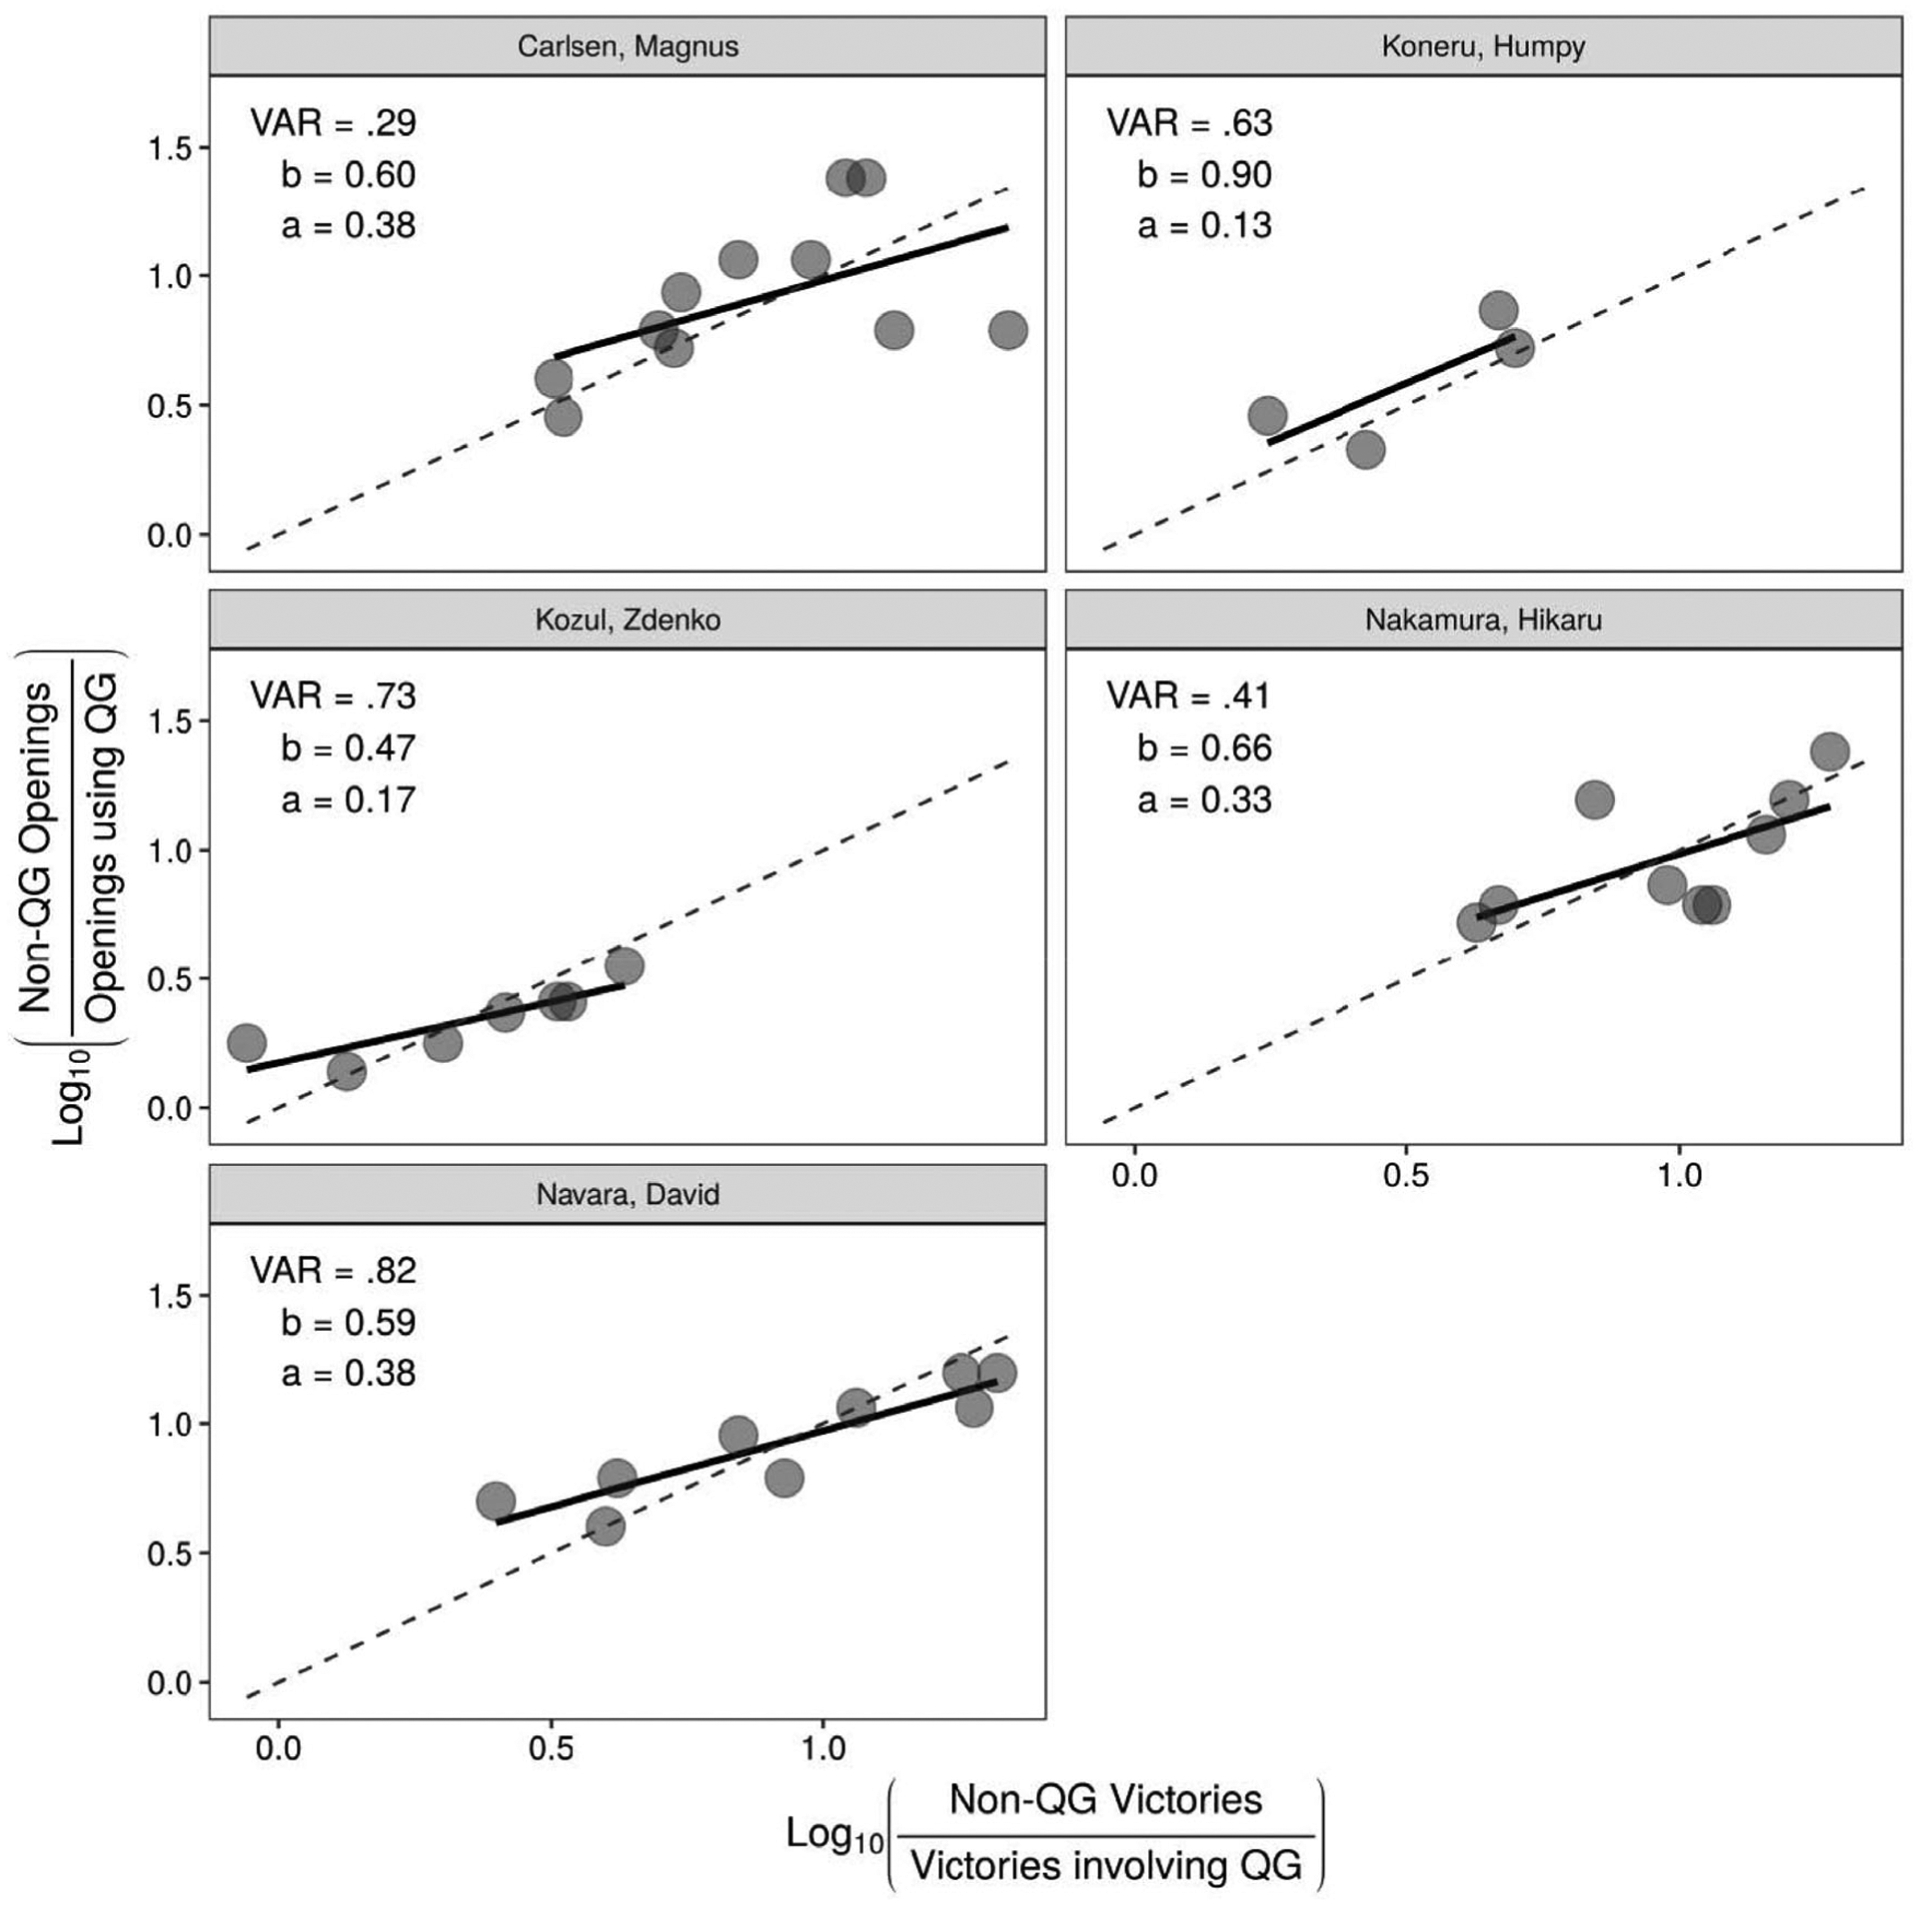
Selected players’ individual matching performance. Each point represents a 50-game block of a player’s recorded history in the dataset. The horizontal axis represents the log-10 ratio of Non-QG victories to QG victories for White in each block. The vertical axis represents the log-10 ratio of Non-QG openings to openings in which White offered the QG. The dashed lines represent theoretically “perfect” matching. Solid lines represent regression slopes for each individual player. Note that because these points are arrayed relative to QG offers and victories, they do not depict a temporal sequence (i.e., moving farther right does not indicate a later game block). VAR = variance explained, b = sensitivity (regression slope), a = bias (regression intercept).
RESULTS
Results from regression analysis revealed that the behavior of chess players conforms to the primary prediction of the GML. As shown in Figure 2, players with more previous wins from the Queen’s Gambit offered it in proportionally more games (df = 346, R2 = .71). There was a small, but statistically significant, bias (i.e., regression intercept) toward offering non-Queen’s Gambit openings (b = 0.10, SE = 0.03 p < .001) and a modest, but statistically significant, under-sensitivity to relative victories (a = 0.85, SE = 0.03, p < .001). Recall that the standard error (SE) is an estimate of the variation in slopes (b) and intercepts (a) that would be expected from repeated sampling. When the SE is small, as is the case here, it increases confidence in the accuracy of those slopes and intercepts.
To interpret these values in practical terms, first note that the intercept of a regression represents the model predicted value of an outcome (the Queen’s Gambit offer ratio), when the predictor variable (the log ratio of wins with and without the Queen’s Gambit) is held at 0. Because both the outcome and predictor variable in this model are in log10 units, a player’s data will occupy point 0 of the horizontal axis of Figure 2 if they have won exactly as many games with the Queen’s Gambit as without (i.e., ). Thus, a predicted log10 ratio of 0.10 implies that players who win as often as they lose with the Queen’s Gambit are expected to offer openings other than the Queen’s Gambit 100.10 = 1.26 times more often than perfect matching would predict. Similarly, the sensitivity parameter of the model is represented by its slope of .85, which is again in log10 units. This implies that a 10-fold increase in non-Queen’s Gambit victories (i.e., a log10-unit increase of 1.0) would yield only a 100.85 = 7.08-fold increase in non-Queen’s Gambit offerings.
Figure 3 depicts example performance from five individual tournament-level players. As shown in the figure, players generally exhibit correspondence between their relative rate of victory with Queen’s Gambit (dashed line) and the rate at which they offered it (solid line) in each block. This is true despite variable usage and success with the Queen’s Gambit across players (different average height on the vertical axis) and across time for each player.
As shown in Figure 4, the variance explained by the GML increases with the number of games played, starting as low as R2 = .30 (df = 79) for players with 100 to 200 games and increasing to R2 = .59 (df = 24) for players with more than 400 games. Changes in bias and sensitivity were also observed as players experienced more games. Specifically, bias was reduced from .34 in the least experienced players to .18 in the most experienced. Like-wise, sensitivity increased from .55 in the least experienced to .88 in the most. Together, these general patterns indicate players’ behavior increasingly conforms to the GML as they play more games.
Figure 4.
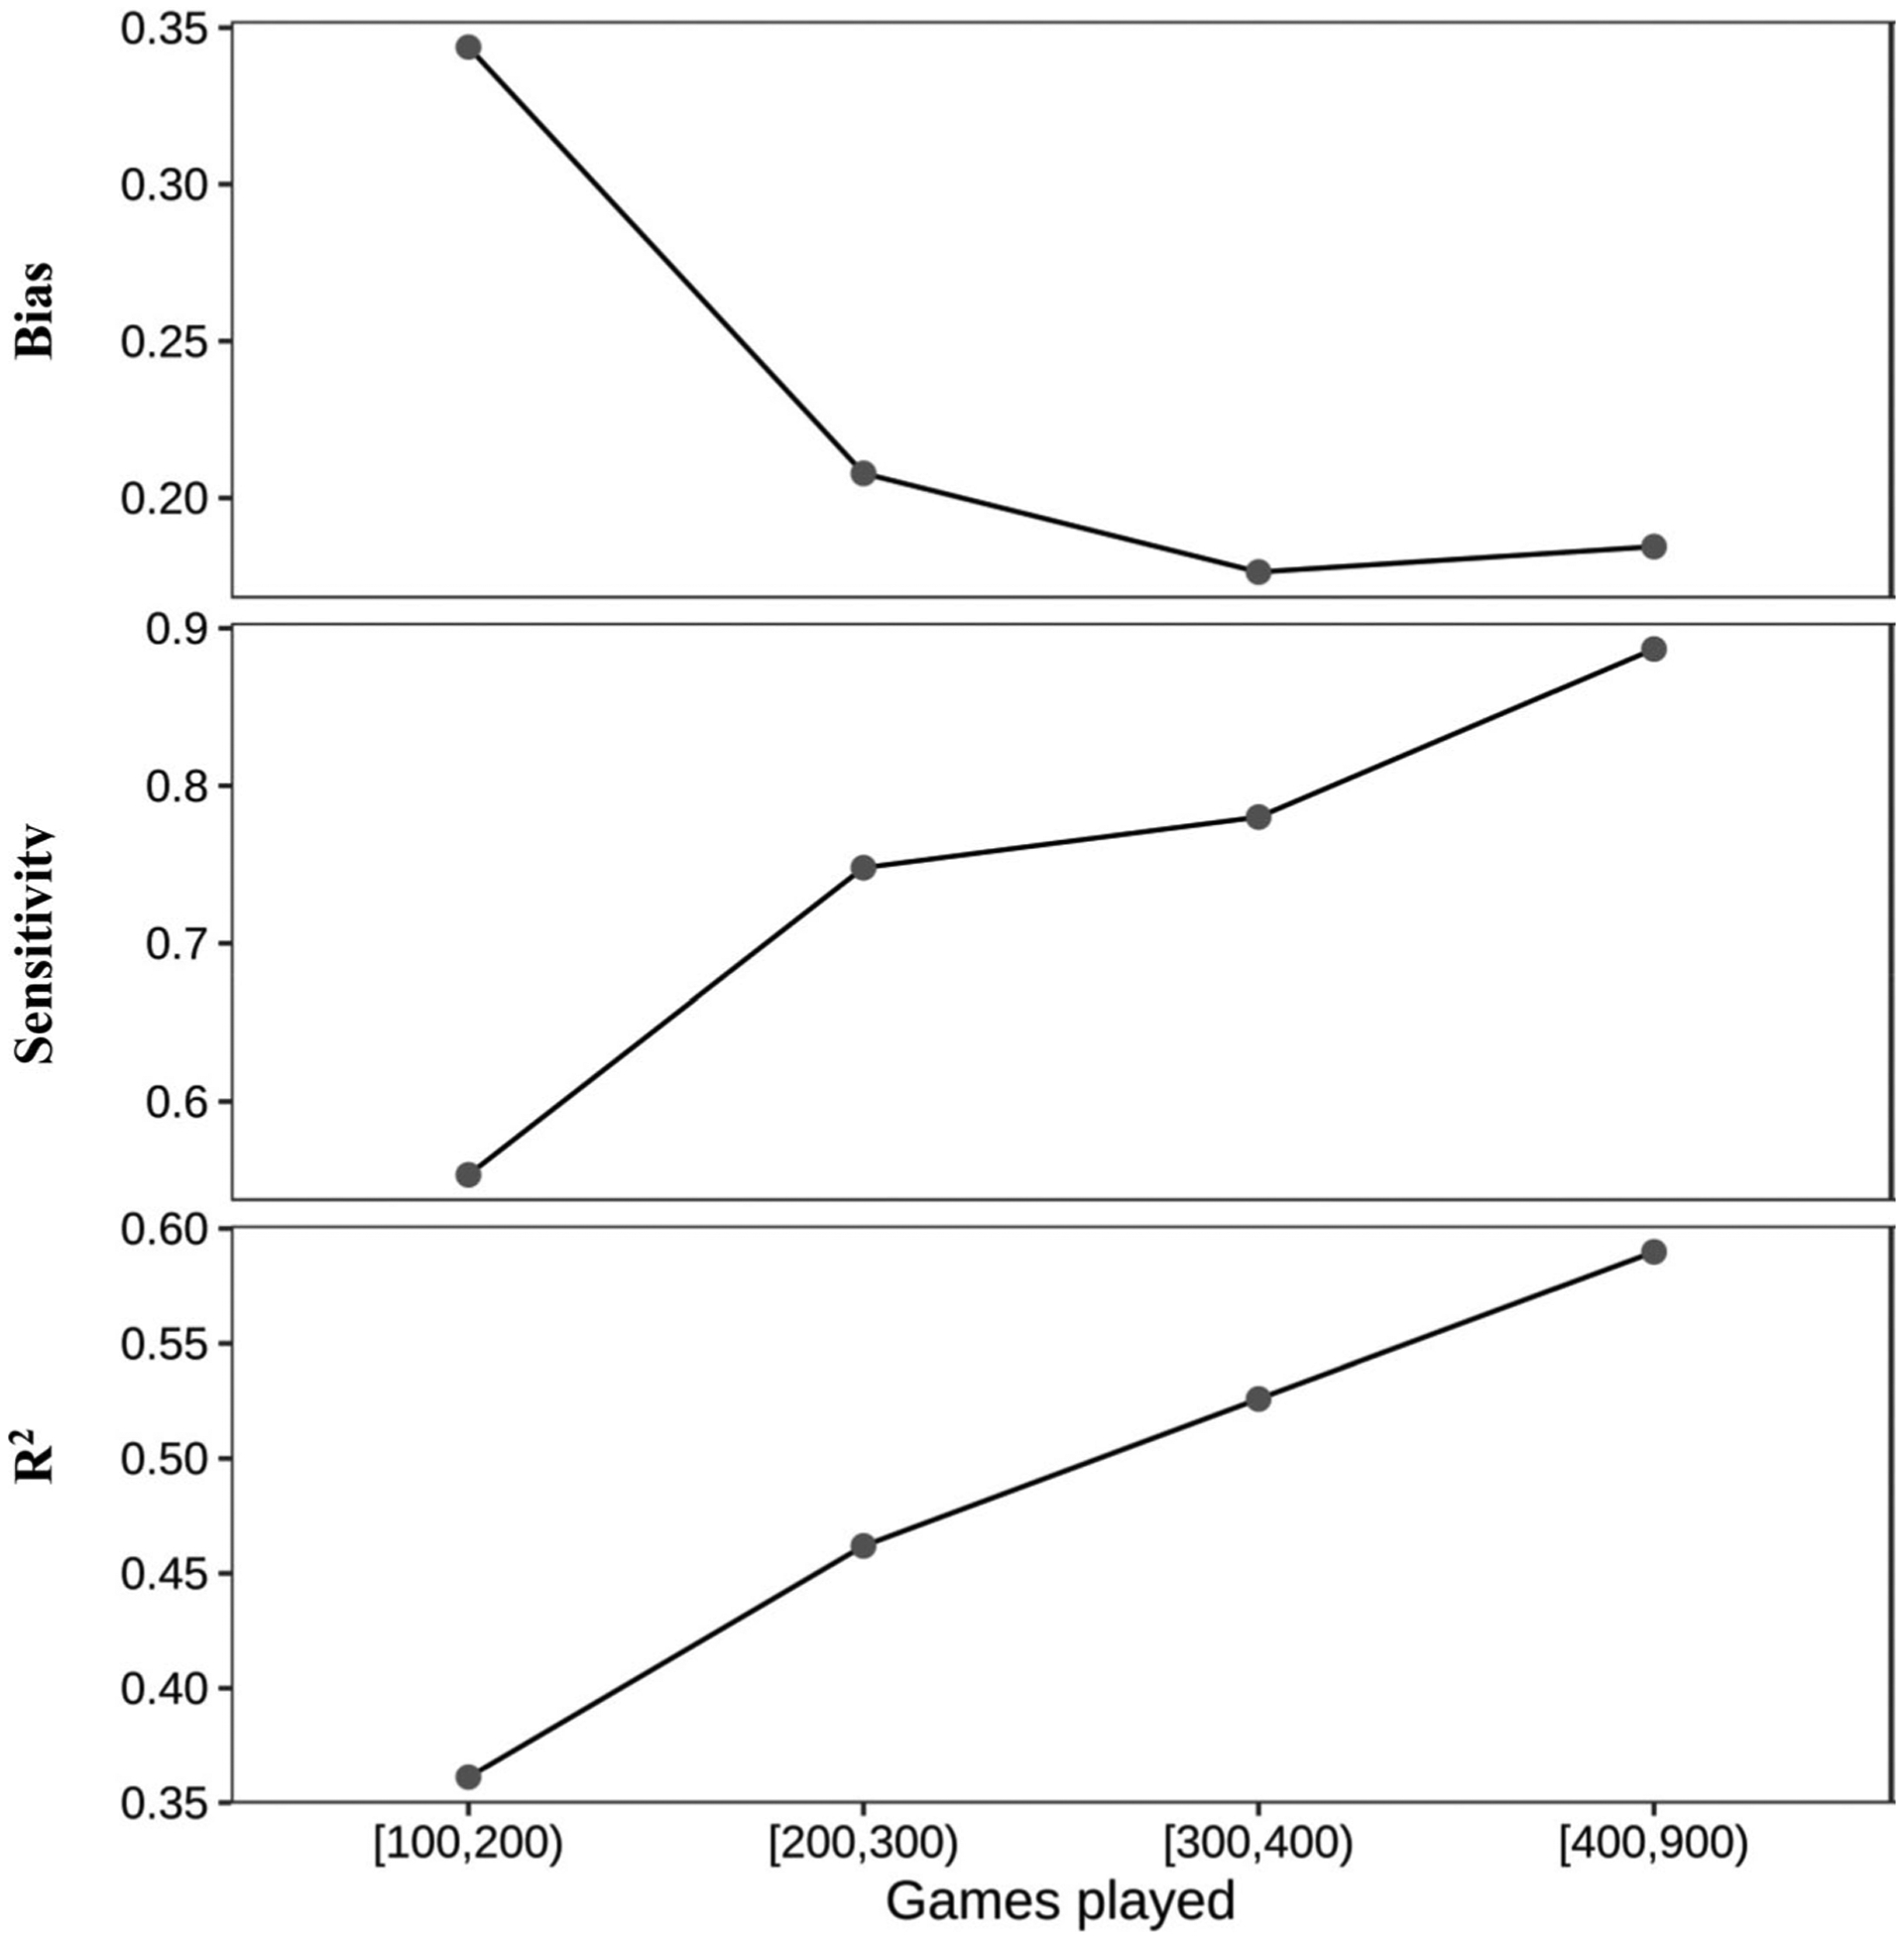
Bias, sensitivity and proportion of variance explained (R2) by the line of best fit as a function of total games White has played. Note the change in vertical scale across panels. Game ranges are given in traditional mathematical notation, where a square bracket is inclusive, and a curved bracket is exclusive (e.g., “[100, 200)” indicates players with at least 100 games, but strictly less than 200). Note, as the number of games played increases, the number of players in that bracket decreases (i.e., n [100, 200) = 81, n [200, 300) = 41, n [300, 400) = 23, n [400, 900) = 24).
Notably, it is possible that the reinforcement schedule alone could have produced the matching results above. That is, a “trivially true” matching pattern can occur in observed data when the number of possible responses is not meaningfully greater than the number of reinforcement occasions. To guard against this risk, Equations 2 and 3 from Herrnstein (1970) were used to calculate the minimum and maximum possible rates of Queen’s Gambit offerings for a given rate of reinforcement (i.e., relative success with the Queen’s Gambit). If these two bounds were very close together, there would be no possible deviation from matching. However, as shown in Figure 5, this was not the case. Instead, the observed rates of Queen’s Gambit offerings clearly diverge from both their maximum and minimum possible values, suggesting (a) the reinforcement schedule of wins and losses with the gambit indeed allowed for potentially poor matching, but (b) players seldom exhibited such poor matching.
Figure 5.
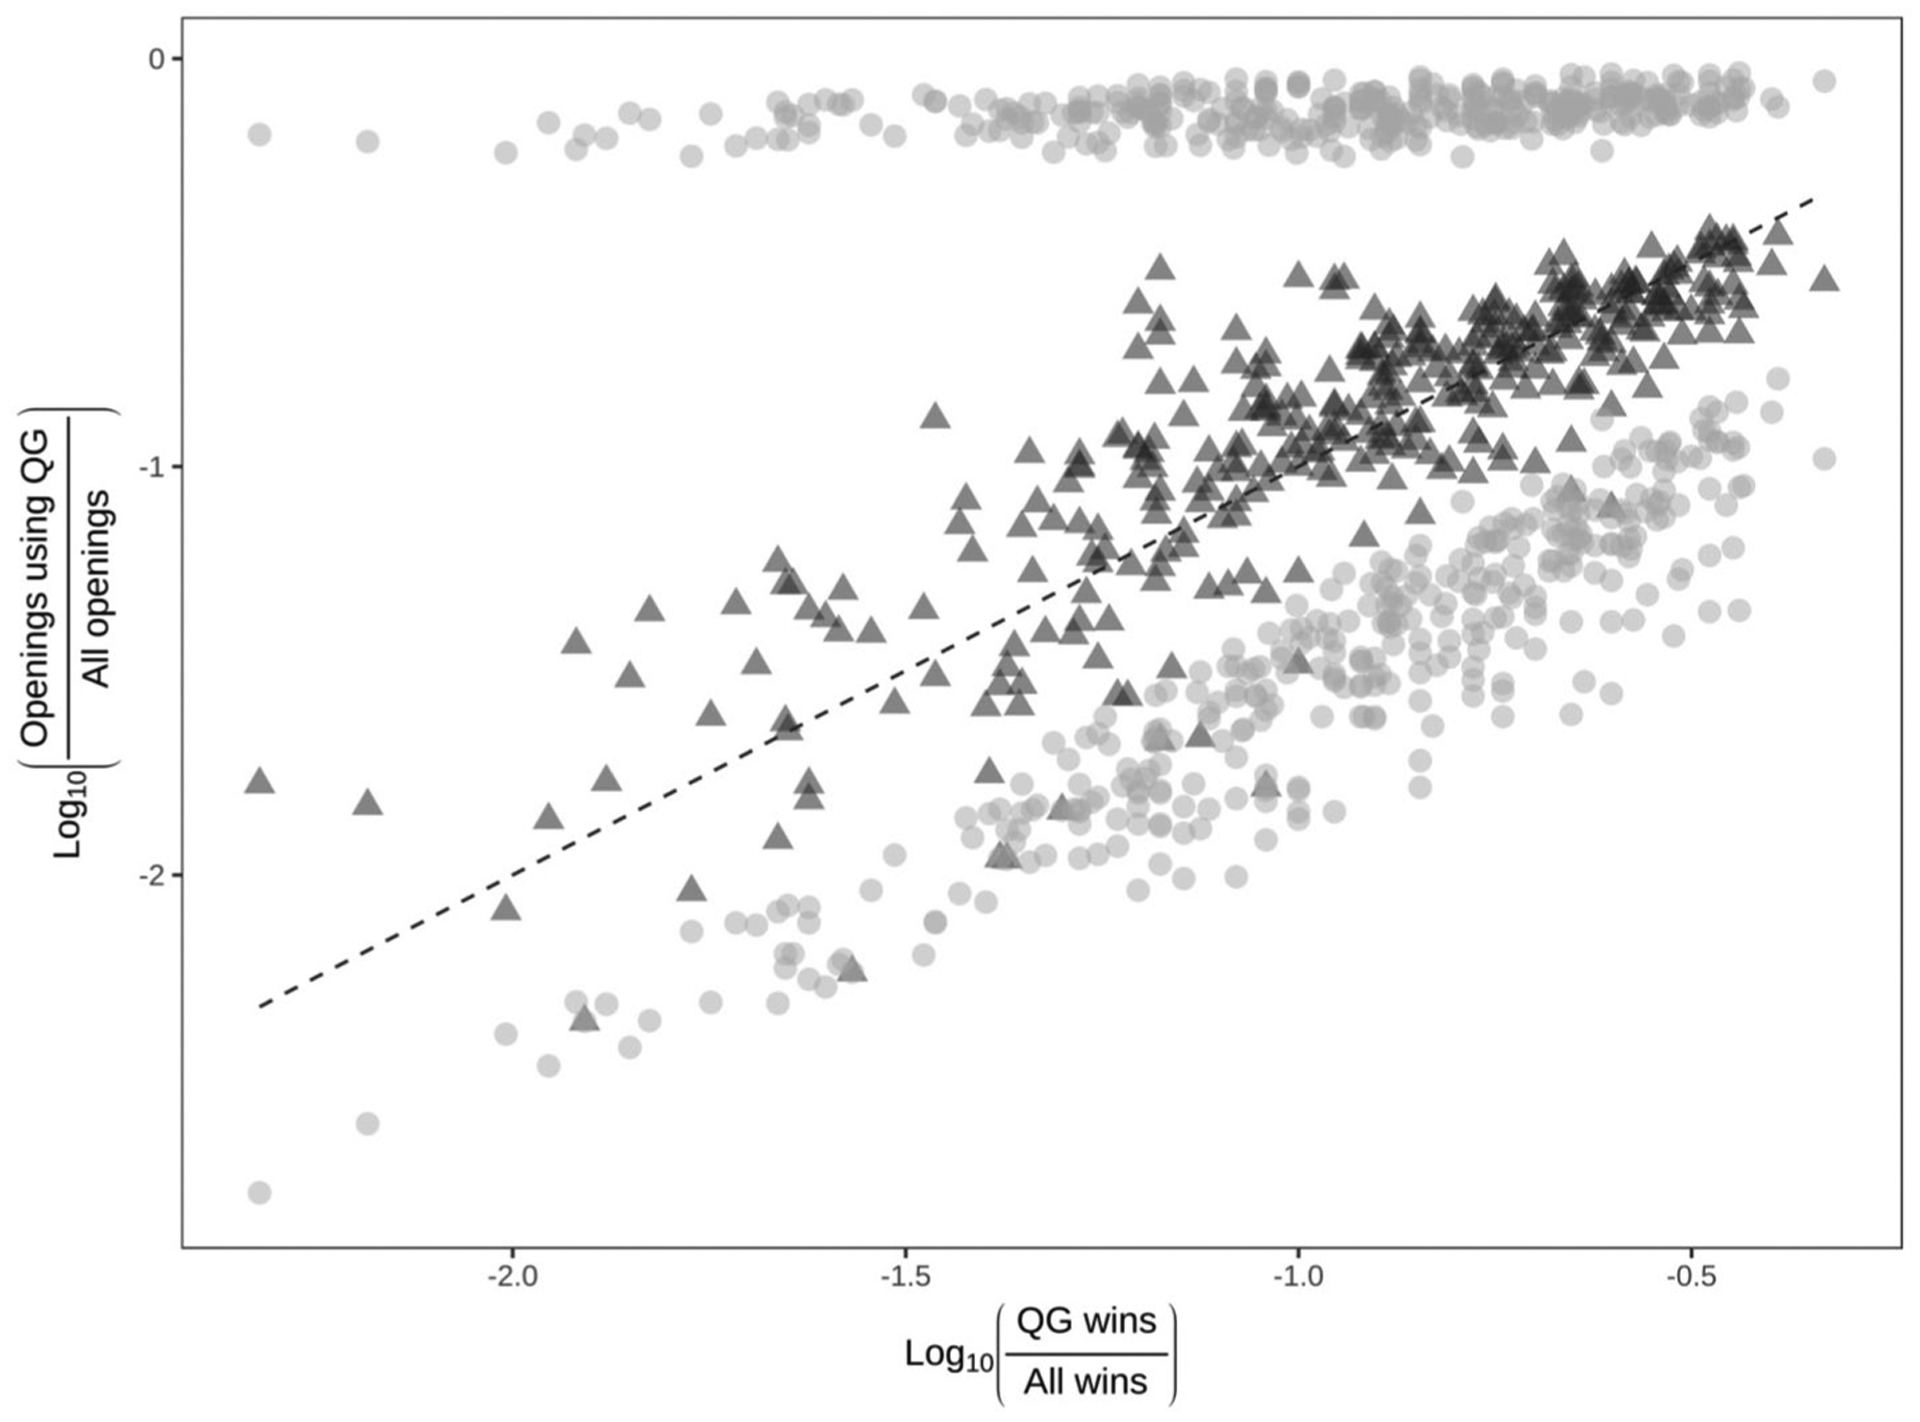
Observed matching (dark triangles) by maximum and minimum possible matching (light circles) for each player. Optimal matching is given by the dashed line. Maximum and minimum possible matching were calculated using Equations 2 and 3 from Herrnstein (1970).
In this group, the observed Dobs = .07 suggests there is a measurably higher observed probability a player will offer the Queen’s Gambit after winning with it than after winning with an alternative opening. However, it is plausible that the true population D = 0 and these players just coincidentally evidenced a different value. As described above, the event records of 100 players were shuffled randomly 1,000 times, and the resulting Dsim was recorded for each iteration. Across all simulations, the mean Dsim = .01 (SD = .02) and not a single simulation surpassed the Dobs = .07 (p < .001), suggesting that the probability of observed results occurring in the absence of a functional relation between the Queen’s Gambit and victory is incredibly low.
DISCUSSION
We evaluated the applicability of the GML to chess players’ use of the Queen’s Gambit during chess openings across a large sample of chess games played by experienced chess players. Across players, the GML accounted for a significant amount of the variance in players’ use of the Queen’s Gambit. As the relative number of games won in which White offered the Queen’s Gambit increased, the relative number of games in which White offered the Queen’s Gambit increased proportionally. Follow-up analyses implied this proportional increase was highly unlikely to be the result of forced matching due to a constrained reinforcement schedule or from the mere base-rate of players’ victories. Consistent with results from Alferink et al. (2009), the GML accounted for a greater proportion of variance in players’ use of the Queen’s Gambit as the relative experience levels of the players increased. Sensitivity estimates suggest players’ reinforcement sensitivity (i.e., sensitivity to games won) when offering the Queen’s Gambit approached optimal levels for nonlaboratory investigations of the GML (McDowell, 2013), though players demonstrated slight undermatching. Bias estimates were low, suggesting only a modest preference for non-Queen’s Gambit openings relative to Queen’s Gambit openings given the experienced rates of wins.
Overall, the GML successfully described chess players’ use of the Queen’s Gambit as a chess opening across a large sample of games, and the GML accounted for more variance in players’ decision-making behavior as their relative experience increased. However, the current findings do not explain why matching occurs in the context of chess openings involving the Queen’s Gambit, and the descriptive nature of the methodology used in the present study cannot identify causal relations between sensitivity, bias, and choice for Queen’s Gambit and non-Queen’s Gambit openings yielding wins and losses. Future research should evaluate how Black’s responses to White’s Queen Gambit (i.e., accepting vs. denying the gambit) conform to the GML, in addition to assessing how non-gambit chess openings (e.g., the “Ruy Lopez,” the “English”) also conform to the predictions of the GML. Broadly, our findings suggest that the matching law may be useful in the context of teaching chess, as well as evaluating chess strategies and tactical decisions. There may be a benefit to using bias and sensitivity parameters as dependent variables for improving chess play. That is, one could study their own chess games (or the previous games of their opponents) to assess undermatching/overmatching or systematic responding within molecular (i.e., gambits, move-by-move decisions) and molar (e.g., middle game, end game) move sequences.
Results from this project add to the considerable basic and applied literature highlighting the empirical utility and descriptive power of the matching law. Matching processes are ubiquitous in complex human behavior, allowing researchers to use the matching law to study operant behavior across varied laboratory and real-world contexts. An analytical factotum, the matching law may be used to study a wide range of topographically or functionally distinct behaviors within a single individual or across a large number of individuals (e.g., 71,716 chess games played by 348 chess players). The current study serves as a useful proof of concept for future researchers interested in using the matching law within “big data” contexts, highlighting the requisite steps and procedural logic necessary to evaluate the presence of functional relations (and not necessarily matching as a forced property of a schedule) when using aggregated data and unique schedules of reinforcement.
Acknowledgments
Ian Cero is now at the University of Rochester Medical School. John Michael Falligant is now at the Kennedy Krieger Institute and Johns Hopkins University School of Medicine. The authors would like to thank Jason Bourret for his helpful feedback on this manuscript.
Footnotes
The non-Queen’s gambit openings and non-Queen’s gambit victories were treated as the numerator in the outcome and predictor variables because they were more common than Queen’s gambit openings and victories (respectively). The logarithms of their ratios will thus be positive, greatly simplifying the visual analysis of subsequent figures. Note, the conclusions produced from the regression analysis described here will be the same, regard-less of the numerator/denominator choice.
REFERENCES
- Alferink LA, Critchfield TS, Hitt JL, & Higgins WJ (2009). Generality of the matching law as a descriptor of shot selection in basketball. Journal of Applied Behavior Analysis, 42, 595–608. 10.1901/jaba.2009.42-595. [DOI] [PMC free article] [PubMed] [Google Scholar]
- Baum WM (1974). On two types of deviation from the matching law: Bias and undermatching. Journal of the Experimental Analysis of Behavior, 22, 231–242. 10.1901/jeab.1974.22-231. [DOI] [PMC free article] [PubMed] [Google Scholar]
- Blasius B, & Tönjes R (2009). Zipf’s law in the popularity distribution of chess openings. Physical Review Letters, 103, 1–5. 10.1103/PhysRevLett.103.218701. [DOI] [PubMed] [Google Scholar]
- Borrero JC, Crisolo SS, Tu Q, Rieland WA, Ross NA, Francisco MT, & Yamamoto KY (2007). An application of the matching law to social dynamics. Journal of Applied Behavior Analysis, 40, 589–601. 10.1901/jaba.2007.589-601. [DOI] [PMC free article] [PubMed] [Google Scholar]
- Borrero JC, & Vollmer TR (2002). An application of the matching law to severe problem behavior. Journal of Applied Behavior Analysis, 35, 13–27. 10.1901/jaba.2002.35-13. [DOI] [PMC free article] [PubMed] [Google Scholar]
- Bulow PJ, & Meller PJ (1998). Predicting teenage girls’ sexual activity and contraception use: An application of matching law. Journal of Community Psychology, 26, 581–596. . [DOI] [Google Scholar]
- Casella G, & Berger RL (2001). Statistical inference (2nd ed). Pacific Grove, CA: Duxbury Press. [Google Scholar]
- Cohen J (1992). A power primer. Psychological Bulletin, 112, 155–159. 10.1037/0033-2909.112.1.155. [DOI] [PubMed] [Google Scholar]
- Falligant JM, Boomhower SR, & Pence ST (2016). Application of the generalized matching law to point-after-touchdown conversions and kicker selection in college football. Psychology of Sport and Exercise, 26, 149–153. 10.1016/j.psych-sport.2016.07.006. [DOI] [Google Scholar]
- Herrnstein RJ (1961). Relative and absolute strength of response as a function of frequency of reinforcement. Journal of the Experimental Analysis of Behavior, 4, 267 10.1901/je-ab.1961.4-267. [DOI] [PMC free article] [PubMed] [Google Scholar]
- Herrnstein RJ (1970). On the law of effect. Journal of the Experimental Analysis of Behavior, 13, 243–266. 10.1901/jeab.1970.13-243. [DOI] [PMC free article] [PubMed] [Google Scholar]
- Kasparov G, & Keene R (1994). Batsford chess openings 2. New York, NY: Henry Holt. [Google Scholar]
- Mace FC, & Critchfield TS (2010). Translational research in behavior analysis: Historical traditions and imperative for the future. Journal of the Experimental Analysis of Behavior, 93, 293–312. 10.1901/jeab.2010.93-293. [DOI] [PMC free article] [PubMed] [Google Scholar]
- Mace FC, Neef NA, Shade D, & Mauro BC (1994). Limited matching on concurrent-schedule reinforcement of academic behavior. Journal of Applied Behavior Analysis, 27, 585–596. 10.1901/jaba.1994.27-585. [DOI] [PMC free article] [PubMed] [Google Scholar]
- Maslov S (2009). Power laws in chess. Physics, 2, 97 10.1103/Physics.2.97. [DOI] [Google Scholar]
- McDowell JJ (2013). On the theoretical and empirical status of the matching law and matching theory. Psychological Bulletin, 139, 1000–1028. 10.1037/a0029924. [DOI] [PubMed] [Google Scholar]
- Mechner F (2010). Chess as a behavioral model for cognitive skill research: Review of blindfold chess by Eliot Hearst and John Knott. Journal of the Experimental Analysis of Behavior, 94, 373–386. 10.1901/jeab.2010.94-373. [DOI] [Google Scholar]
- Ramiz A (2006). An investigation into the openings used by top 100 chess players. International Journal of Performance Analysis in Sport, 6, 149–160. 10.1080/24748668.2006.11868363. [DOI] [Google Scholar]
- R Core Team. (2017). R: a language and environment for statistical computing. Vienna, Austria: R Foundation for Statistical Computing; Retrieved from. http://www.Rproject.org/. [Google Scholar]
- Reed DD, Critchfield TS, & Martens BK (2006). The generalized matching law in elite sport competition: Football play calling as operant choice. Journal of Applied Behavior Analysis, 39, 281–297. 10.1901/jaba.2006.146-05. [DOI] [PMC free article] [PubMed] [Google Scholar]
- Romanowich P, Bourret J, & Vollmer TR (2007). Further analysis of the matching law to describe two- and three-point shot allocation by professional basketball players. Journal of Applied Behavior Analysis, 40, 311–315. 10.1901/jaba.2007.119-05. [DOI] [PMC free article] [PubMed] [Google Scholar]
- Schenk MJ, & Reed DD (2019). Experimental evaluation of matching via a commercially available basketball video game Journal of Applied Behavior Analysis. Advance online publication; 10.1002/jaba.551 [DOI] [PubMed] [Google Scholar]
- SCID (2017). SCID - Chess Database Software (Version4.6.4) [Data file]. Retrieved November 4, 2017, from http://scid.sourceforge.net/
- Shannon CE (1950). Programming a computer for playing chess. The London, Edinburgh, and Dublin Philosophical Magazine and Journal of Science, 41, 256–275. 10.1080/14786445008521796. [DOI] [Google Scholar]
- Vollmer TR (2011). Three variations of translational research: Comments on Critchfield (2011). The Behavior Analyst, 34, 31–35. 10.1007/bf03392231. [DOI] [PMC free article] [PubMed] [Google Scholar]
- Vollmer TR, & Bourret J (2000). An application of the matching law to evaluate the allocation of two- and three-point shots by college basketball players. Journal of Applied Behavior Analysis, 33, 137–150. 10.1901/jaba.2000.33-137. [DOI] [PMC free article] [PubMed] [Google Scholar]


