

Abstract
It is well known that corticomotor excitability is altered during the post-exercise depression following fatigue within the primary motor cortex (M1). However, it is currently unknown whether corticomotor reorganization following muscle fatigue differs between magnitudes of force and whether corticomotor reorganization occurs measured with transcranial magnetic stimulation. Fifteen young healthy adults (age 23.8±1.4, 8 females) participated in a within-subjects, repeated measures design study, where they underwent three testing sessions separated by one-week each. Subjects performed separate sessions of each: low-force isometric contraction (30% maximal voluntary contraction [MVC]), high-force isometric contraction (95% MVC) of the first dorsal interosseous (FDI) muscle until self-perceived exhaustion, as well as one session of 30 minutes rest as a control. We examined changes in corticomotor map area, excitability and location of the FDI representation in and around M1 using transcranial magnetic stimulation. The main finding was that following low-force, but not high-force fatigue corticomotor map area and excitability reduced [by 3cm2 (t (14) =−2.94, p=0.01) and 56% respectively t(14) =−4.01, p < 0.001)]. Additionally, the region of corticomotor excitability shifted posteriorly (6.4±2.5mm) (t(14) = −6.33, p = .019). Corticomotor output became less excitable particularly in regions adjoining M1. Overall, post-exercise depression is present in low-force, but not for high-force fatigue. Further, low-force fatigue results in a posterior shift in corticomotor output. These changes may be indicative of increased sensory feedback from the somatosensory cortex during the recovery phase of fatigue.
Keywords: Post-Exercise Depression, Fatigue, Transcranial Magnetic Stimulation, Healthy, Primary Motor Cortex, Isometric Contraction
Introduction
Voluntary muscle fatigue is defined as an exercise-induced loss in the maximal force generated by a muscle or a group of muscles (Bigland-Ritchie and Woods, 1984). The effects of fatigue, however, can extend proximal to the muscle. For example, immediately following muscle fatigue, stimulation of the primary motor cortex with transcranial magnetic stimulation (TMS) demonstrates a long-lasting depression in corticomotor output to the recovering, resting muscle, commonly referred to as post-exercise depression (Brasil-Neto et al., 1993, McKay et al., 1995, Liepert et al., 1996, Gandevia et al., 1999). Post-exercise depression is thought to decrease the ability to generate motor commands (Brasil et al., 1993) and consequently limit the production of voluntary movement during the recovery period (Petersen et al., 2003).
Post-exercise depression has been shown to reduce the corticomotor representation devoted to the fatiguing muscle for a period of 35 minutes, where the size of the corticomotor representation is eventually restored over the course of recovery (Zanette et al., 1995). Zanette et al. 1995 speculate that such depression could be a result of altered proprioceptive feedback arising from muscular stretching. Altered feedback could modulate corticomotor representations because organization of the primary motor cortex (M1) is closely aligned with somatosensory input (Sanes et al., 1992, Jones, 1993). In line with post-exercise depression evidenced with TMS, studies using functional magnetic resonance imaging (fMRI) have similarly shown that while there is an increase in sensorimotor activation during a fatiguing task (Liu et al., 2003), activation decreases post-fatigue (Benwell et al., 2005). In this case, it is speculated that the reduction in somatosensory activation may reflect a more wide-spread post-exercise depression ultimately reflects disruption in normal motor control post-fatigue. What remains unknown however is whether spatial properties of corticomotor representations shift following fatigue i.e. whether the location of a muscle representation changes. Ultimately, understanding spatial shifts can direct us to evidence regarding regions that contribute to post-exercise depression and recovery. For example, realizing whether shift occurs in the direction somatosensory cortices validate speculations that altered sensory input dominates mechanisms of post-exercise depression (Zanette et al., 1995).
Therefore, in healthy individuals we have investigated whether the corticomotor representations shift following muscular fatigue measured with TMS. Similar to Zanette et al 1995, we utilized the corticomotor mapping technique which involves applying TMS to an array of sites in order to define the comprehensive corticomotor representation devoted to the target muscle. Unlike Zannette et al., however, we investigated spatial shifts in the corticomotor maps and also investigated force-dependent influences upon post-exercise depression of corticomotor representation. Post-exercise depression is dependent on the muscle being tested and the intensity of the exercise (Kotan et al., 2015). For example, when subjects perform isometric wrist extension contractions from 10–50% of their maximal voluntary contraction there is significant post-exercise depression (Samii et al., 1997); further, when subjects perform maximal isometric contraction of the tibialis anterior there is still significant post-exercise depression (McKay et al., 1995). Still, to date, no study has investigated differences in reorganization following submaximal and maximal isometric voluntary contraction using TMS. Therefore, we investigated post-exercise depression in corticomotor representation following a submaximal low-force vs. maximal high-force fatigue fatiguing isometric task in order to ascertain whether exercise-depression results in different reorganization in a force-dependent manner. Subjects performed low (30% maximal voluntary contraction [MVC]) and high (95% MVC) level sustained isometric contraction. We assessed the in change in size, output and location of corticomotor representations following the fatigue protocols. We hypothesized that both maximal and submaximal muscle fatigue would show a reduction in corticomotor maps, and that such depression would involve reorganization/shift of representation towards posteriorly-located sensory cortices, validating theoretical claims made in previous studies (Zanette et al., 1995).
Methods
Subjects
Fifteen right-handed (age 23.8±1.4, 8 females) healthy young adults participated in this study. Subjects had no known history of neurological or musculoskeletal disorders affecting the upper extremity, no contraindications to TMS (Rossi et al., 2009) and were not participating in any physical training program or skill learning paradigm for their upper extremity. The experimental protocol was approved by the Institutional Review Board of the Cleveland Clinic. All subjects provided written informed consent.
Design and procedures
All subjects participated in 3 testing sessions separated by at least 1 week. On each session, subjects were randomly assigned to perform a low-force fatigue (LFF), high-force fatigue (HFF), or no fatigue (NF) task involving isometric contraction of the first dorsal interosseous (FDI) muscle. Corticomotor representations were evaluated before and after each fatiguing protocol using TMS (see below, TMS recording).
Fatiguing Protocol
Subjects were seated with their left arm (non-dominant) resting comfortably on a flat surface. They were asked to abduct their left index finger against a force transducer (Omega LCKD 5-lb, Stamford, CT). We chose to study the non-dominant FDI (based on Edinburgh Handedness Inventory (Oldfield, 1971)) as the non-dominant hand experiences more pronounced fatigue than the dominant (Zijdewind et al., 1990). Subject’s wrist and forearm were stabilized and the thumb, middle, ring and little fingers were restricted with from moving during the fatiguing protocol with a Velcro strap. Electromyography (EMG) was measured with surface electrodes (silver-silver chloride, 8 mm diameter) placed in the belly-belly montage on the skin overlying the FDI muscle. During the fatiguing protocol, the finger abduction force was recorded (Labchart software, version 7.3) and displayed on a screen to provide visual feedback. Target forces used for the LFF (30% MVC) and HFF (95% MVC) were determined based on the finger abduction MVC force over 3 trials acquired before the fatigue protocols. During LFF, subjects were required to sustain 30% MVC force until exhaustion and during HFF they were required to sustain 95% of MVC until exhaustion. Exhaustion was defined as the point at which the subject individually determined that he or she was unable to continue with the task and/or if their voluntary force fell below 5% of their target force even after receiving verbal encouragement from the experimenter. During no-fatigue protocol, subjects sat quietly with their hands rested on a flat surface for 30 min (Figure 1).
Figure 1.

Experimental design. For each TMS session, subjects first underwent TMS mapping of the FDI. This mapping was followed by a thirty minute rest period. Following the rest period, subjects underwent either protocol 1 (low-force fatigue) or protocol 2 (high-force fatigue). For the low-force protocol, subjects maintained contraction of the FDI at 30% maximal force of contraction. For the high-force protocol, subjects maintained contraction of the FDI at 95% maximal force of contraction. After the fatigue protocol, subjects immediately underwent a second TMS motor mapping of the FDI. For the no fatigue protocol, no contraction was performed in order to ensure same day reliability of TMS outcomes. *Only 30 minutes of rest was given for protocol 3, where motor mapping was immediately followed.
TMS recordings
TMS was used to assess changes in corticomotor map area, overall degree of corticomotor output and location of the corticomotor excitability before and immediately following each fatiguing protocol. Further, TMS was used before and after a session of no fatigue to ensure within-session reliability of our TMS outcomes. TMS was delivered to the right M1 via a figure-of-eight coil (70 mm) connected to a monophasic Magstim device (2002 Magstim Co., Whitland, Dyfed, UK). The coil was placed tangential to the scalp with the handle oriented backward and laterally at a 45° angle to the midsagittal axis. Each subject’s cranial landmarks were registered to a standard MRI template in order to assist accurate navigation with TMS. Repeatable neuronavigation was achieved through the use of a frameless stereotaxic system, which found the spatial relation between the head, target, and coil in real time (BrainSight, v2, Rogue Research Inc., Montreal, Canada). While subjects rested their hands, motor evoked potentials (MEP) were recorded (PowerLab 4/25T, AD instruments, Colorado Springs, CO) in the contralateral (left) FDI muscle using surface EMG. The EMG was amplified (X500-5000), band-pass filtered (10 Hz-2 kHz), and digitized at 4 kHz. The digitized EMG responses were analyzed offline using Labchart Pro (AD Instruments Inc. Colorado Springs, CO) (version 7.3).
First, we defined the motor ‘hotspot’ in right M1, i.e. the scalp site eliciting a MEP in the contralateral FDI muscle. In order to determine the motor ‘hotspot’ we first started at 50% of the maximum stimulator output (%MSO) in order to consistently evoke a MEP in at least 3 out of 5 TMS pulses. We then reduced the %MSO in steps of 2% until we were no longer able to consistently elicit a MEP. We tested multiple locations within the primary motor cortex using a stereotactic grid (5 × 7 cm2) with a 1 cm spatial resolution placed over M1. We defined the motor hotspot as the site that elicited a MEP ≥ 50μV in at least 3/5 pulses at the lowest %MSO. The %MSO used at the motor hotspot was termed resting motor threshold (rMT), where rMT indicates the excitability of the corticomotor pathways (Talelli et al., 2006).
Next, we defined the corticomotor map for the FDI muscle. This was achieved by delivering pulses to sites in a 5 × 7 cm2 grid with a 1 cm spatial resolution centered at the motor hotspot. At each site, we delivered 5 pulses each at 120% of the rMT. Pulses were delivered at a frequency of one every 5–6 second. The grid was divided into 4 quadrants, where each quadrant was randomly tested. The same grid location and %MSO was used post-fatigue.
Data Analysis
Fatigue protocol analysis
The duration of the fatigue task was calculated as the time from the beginning of the fatiguing protocol to the subjectively-defined end of the task (see above). In order to index the degree of fatigue, we assessed change in root mean square (RMS) of the EMG signal from the first tenth to the final tenth of the total duration of the fatigue protocol (see figure 2c). In addition to measuring the degree of the change in EMG signal, we performed spectral analysis. During sustained isometric contractions, it has been shown that EMG power frequency shifts to the lower frequencies is an indicator of fatigue (Knorr et al., 2012). We incorporated spectral analysis, specifically the change in median power frequency (MDF), in order to test the degree of shift in the EMG frequency during low and high-force fatigue. MDF was assessed offline using LabChart 7 v7.3 (Adinstruments, Oxford, UK). EMG was filtered to 10–500 Hz). A Hann window was applied onto the rectified EMG collected. A short-time fourier transform with a 1024-point window length and a 50% overlap was used to calculate the MDF of the EMG signal. We assessed the change in MDF from the first to the last tenth of each fatigue (LFF or HFF) protocol.
Figure 2.

a) Subjects accurately maintained 30% and 95% of their MVC throughout the duration of the fatiguing protocol. b) Subjects were able to maintain low force fatigue (LFF) for a significantly longer time than high force fatigue (HFF). c) Example EMG during LFF indicating the 1st and last 10th, where the RMS was taken in order to analyze increase in EMG activation during fatigue. d) There was a significant increase in EMG amplitude throughout the low-force fatigue protocol but not the high-force fatigue protocol. Initially there was no difference between LFF and HFF; however, 12 out of 15 subjects only increased their EMG by 8.4±26.7% during the high force condition, where the remaining 3 increased their EMG by 127±18% %. Interestingly, the 3 outliers did not demonstrate the longest duration of high-fatigue out of the 15 subjects. The figure includes all 15 subjects. e) Example median power frequency (MDF) analysis for one subject during the LFF. f) There was a significant difference pre to post EMG in the decrease of MDF for both LFF and HFF; however there was no difference between the low-force fatigue and the high-force fatigue protocol. ‡ indicates a significant difference pre-to-post fatigue. * indicated significant difference between task conditions. Error bars indicated SEs. p < .05
TMS analysis
Corticomotor map area was assessed offline by calculating the peak-to-peak amplitude of MEPs from each scalp site on the 5 × 7 cm2 grid. Scalp sites that elicited an MEP > 50 μV in 3 out of 5 TMS pulses were included in the overall size of the corticomotor representation of the FDI. The total area count of the map was described as the total number of scalp sites that met the above criteria.
Corticomotor output was assessed by defining the largest MEP elicited in the corticomotor map (MEPmaxima) (mean of the 5 stimuli). Further, we defined the overall excitation of the corticomotor map by summing normalized MEPS’s across all responsive scalp sites (Equation 1) (Plow et al., 2014). All MEPs at responsive scalp sites (pre- and post-fatigue) were normalized to the MEPmaxima of the baseline map. We normalized MEPs at responsive sites in the post-fatigue map to the MEPmaxima from the pre-fatigue map in order to compute a valid comparison, where a smaller or larger MEPmaxima at post-fatigue may confound the value of post-fatigue excitation.
| Equation 1 |
Because map volume changes may be due to changes in total map area count, we extracted two concentric sub-regions of the map. Sites that yielded MEPs <50% and sites the yielded MEPs >50% of the MEPmaxima were classified. This enabled us to view whether there were changes at the least excitable or most excitable region of the map, respectively.
The location of the corticomotor maps was assessed by calculating the overall weighted center of the maps (center of gravity [COG]). The COG of the motor maps pre- and post-fatigue was expressed as the MEP-weighted center. Center of gravity describes the weighted-average location of the spread of corticospinal activation devoted to the target muscle. We described the COG medio-lateral (x) and antero-posterior (y) coordinates in relation to the vertex. The medio-lateral coordinate was computed by multiplying the medio-lateral coordinate at each site by its normalized MEP (normalized to the maps MEPmaxima) and summing across all positions (Equation 2). The antero-posterior (y) coordinate was calculated using the same method (Equation 3).
| Equation 2 |
| Equation 3 |
Where MEPi is the average normalized amplitude of MEP at each responsive site and xi and yi represent the × and y coordinates of the site normalized to the vertex. We also investigated reorganization of the corticomotor output following fatigue by assessing the change in location of the MEPmaxima. We found the medio-lateral (x) and the antero-posterior (y) coordinates of the motor maps MEPmaxima in relation to the subject’s vertex before and after each fatigue task. In addition to characterizing the shift of the MEPmaxima, we determined the spatial distribution of map area by assessing changes of the map area specifically within the anterior and/or posterior halves of the mapping grid. Application of TMS to the same 5 × 7 cm2 grid pre- and post-fatigue enabled post-hoc analysis in which the grid was divided into anterior and posterior halves. We compared the map area between the anterior and posterior sub-grids before and after the fatiguing protocol to determine whether changes to map area were localized anteriorly or posteriorly.
Statistics
The demographic variables were described using sample mean with standard deviation or proportion as appropriate. We examined within-session reliability of our TMS outcomes by performing TMS pre and post 30 minutes of rest. We performed intra-class coefficients (ICC) on pre to post rMT, map area count and the MEPmaxima of which all map values were normalized. ICC was conducted with absolute agreement at a p-value of .05 and excellent reproducibility >0.6. In addition to within-session, we also examined inter-session reliability using baseline outcome measures for each day subjects performed low-force, high-force and no fatigue.
We used a two-way repeated measure ANOVA [Session (low-force fatigue, high-force fatigue, and no-force fatigue) × Time)] based on linear mixed effects model, a generalization of conventional linear model, for the analysis of TMS measurements. The mixed effects models allow us to introduce the two separate sources of variation: random variation among individuals and random variation within individuals. As a result, it automatically leads to covariance models that acknowledge the difference variation sources in the experiment. Maximum likelihood methods were used to fit the mixed model. ANOVA F-type tests were conducted at the 0.05 significance level (two tailed). All analyses were performed by using the SAS statistical software package (Version 9.3 for Windows, SAS Institute Inc., Cary, NC, USA).
Results
Fatigue Protocol
Designated levels of force were generally maintained for both HFF and LFF throughout the duration of the protocol. Subjects targeted 30% of their MVC force for the LFF; on average, they held 28.1% MVC force for the first 10th of the duration and 29.5% for the last 10th of the duration. Subjects targeted 95% of their MVC force for HFF; they held 95.4% MVC force for the first 10th and 96.7% for the last 10th of the contraction duration (figure 2a). The LFF was maintained for a significantly longer duration when compared to the HFF (258.85s vs. 87.12s; t(14)=−5.64, p<0.0001) (figure 2b). Surface EMG signals from the FDI indicated a significant increase in EMG amplitude from the first 10th to the last 10th of the fatigue duration for LFF (76.8±82% increase; t(14)=−2.6, p <0.05) (figure 2c). The HFF protocol did not result in an increase in EMG activation from pre to post HFF (figure 2d). (HFF EMG analysis was based on 12 subjects’ data; the data of the other 3 subjects were significant outliers as they averaged a 127±18% increase (greater than 2 standard deviations from the mean) where the remaining 12 subjects showed an 8.4±26.7% increase). Further, there was a significant difference between low force fatigue and high force fatigue (t(11)=2.48, p < .05). Even though an increase in EMG was only visible during LFF, both HFF and LFF showed changes in median power frequency (figure 2e). Surface EMG median power frequency analysis showed a significant decrease from the first 10th to the last 10th of the fatigue duration for both LFF and HFF (−30.2±19% & −33.8±12.9%, t(14) = 6.69, p <0.001 and t(11) = 7.819, p < 0.001). There was no significant difference in the MDF percent decrease in median power frequency between LFF and HFF (t(11) = −.466, p = 0.650).
Reliability of TMS outcomes
ICC showed within-session reliability of rMT (ICC = .947, p <.001), map area count (ICC = .675, p = .026), MEPmaxima (ICC = .955, p <.001) and the MEPmaxima location (ICC = .925, p < .001) for the no fatigue session. Likewise, MEPmaxima and MEPmaxima location (ICC = 0.927, p <.001; ICC = .674, p = .007) showed good-excellent between-session reliability, where baseline values did not differ significantly between testing conditions. Average baseline rMT was 43.4±2.1% maximum stimulator output for the NF session, 42.2±2.0% for the HFF session, and 42.8%±2.0% for the LFF session (F(2,42)=0.0867, p=0.92)). We found no difference between average MEPmaxima across baseline of all 3 conditions ((NF: 1.47±1.32 mV; LFF: 1.46±1.21 mV ; HFF: 1.47±1.3 mV) (p>0.05). Likewise, there was no between day difference in the motor map area count (NF: 14.1±.5; LFF: 13±3.3; HFF: 12.7±1.9) (F(2,28)=1.22, p=0.31)); though, ICC values showed only weak-to-moderate reliability (ICC = .422, p = 0.1).
Corticomotor Map Area Count
The two-way repeated measures ANOVA revealed a significant main effect (F(3, 14)=3.64, p=0.039). Post-hoc analysis revealed that following LFF, the area count of the motor map was significantly smaller (by ~3 active points [i.e. 3 cm2]) across subjects (t(14)=−2.94, p=0.01) (figure 3a). The smaller map area was observed in 11 out of the 15 subjects, where only 7 out of 15 subjects demonstrated a smaller map area following HFF. There were no significant changes in the map area from baseline after HFF (p=0.152) or NF (p=0.654) (figure 3a) in motor map area. An illustration of motor map area from pre to post LFF and HFF is depicted in figure 3b.
Figure 3.

a) Map area count significantly decreased after the low force fatigue (LFF), but not after high force (HFF) or control no fatigue (NF). Map area count decreased in 12 out of 15 patients during low force fatigue and 7 out of 15 patients after high force fatigue. b) Representative map area count between the low force fatigue day and the high force fatigue day. A – Anterior, P = Posterior, L = Left, R = Right. Error bars indicated SEs. *P < .05
Corticomotor Output
In order to assess the excitability of the map representations, we first analyzed the MEPmaxima within the corticomotor map from baseline to post-fatigue. The two-way repeated measures ANOVA revealed a significant main effect (F(3, 14)=4.06, p=0.029). Post-hoc analysis revealed that following LFF MEPMaxima significantly decreased by .503 mV (t(14)=−2.31, p=0.037), but not after HFF (t(14)=−0.3, p = 0.76) and NF (t(14)=1.63, p .126).
Because there was a significant decrease in MEPMaxima following LFF, in order to assess changes in corticomotor map volume, we normalized all active points within the map to the baseline MEPMaxima. There was a significant main effect (F(3, 14)=13.13, p < .001). Post-hoc analysis showed a decrease in total corticomotor map volume following LFF (−41.3±39.5%; t(14)=−4.75, P < 0.001), but not HFF (−11.87±135.9%; t(14)=−.55, p = .6) and NF (16.0±78.7%; t(14)=.71, p = .5) (figure 4a). In order to ensure the difference was not due to the decrease in corticomotor map area observed after LFF, we assessed whether the map volume changes were due to a decrease in the most excitable active points (sites with MEPs >50% normalized MEP) or a drop out of the least excitable active points (sites with MEPs <50% normalized MEP) at the periphery of the map. Following LFF, there is a significant main effect (F(3, 14)=6.91, p=0.005) and decrease in map volume at the most excitable active points (56% decrease) (t(14)=−4.01, p=0.0013) (figure 4b–c), but not with the least excitable points of the corticomotor map F(3, 14)=1.17, p=0.36) (figure 4b–c). Figure 4d illustrates the map volume difference between baseline and post-LFF.
Figure 4.

a) Total map volume decreased after the low force fatigue day but not after high force. b) There was no decrease in map volume in the least excitable regions of the map after low force fatigue (<50% normalized motor evoked potential) c), but there was a significant decrease in map volume from the most excitable regions (>50% normalized motor evoked potentials). d) Representation of the total map before and after LFF in a representative subject. Hotter colors represent more excitable points where colder colors represent least excitable points. Error bars indicate SEs. *p < .05.
Location of the corticomotor map
In order to assess changes in the location of representation of the corticospinal output devoted to the FDI muscle following fatigue, we assessed the direction and degree of shift of the corticomotor map COG and MEPmaxima from the pre- to post-fatigue maps. There was no shift in COG following either fatigue condition. For MEPmaxima, though we failed to observe a significant interaction between time and condition (F(3, 14)=2.48, p=0.1), there was a significant effect for condition (F(2, 14)=6.86, p=0.008). Post-hoc analysis revealed a significant posterior shift of MEPmaxima following LFF (t(14) =−6.33, p = .019). The shift was on the order of 6.36±2.48mm after LFF, whereas no change occurred following NF (p = .47) or HFF (p = .77) (figure 5). Moreover, after LFF, the map area within the anterior half of the grid had decreased (t(14)=−2.929, p=0.011), while there was no change in the map area within the posterior half of the grid (p=0.447). As a result, less of the total map area occupied the anterior half of the grid than the posterior half following LFF (t(14)=−2.236, p=0.042).
Figure 5.
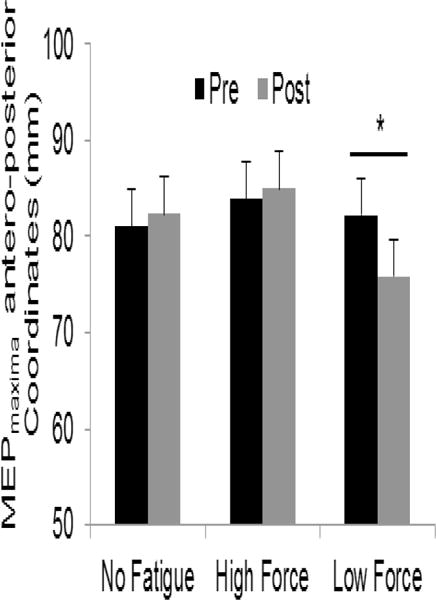
Location of MEPmaxima. There was a significant posterior shift of the MEPmaxima following low-force fatigue but not following no fatigue and high-force fatigue. Error bars indicate SEs. * p < .05.
Discussion
The primary aim of our study was to assess whether corticomotor representation transiently reorganizes following a submaximal and maximal voluntary fatiguing task. Here, we have found that the representation of a muscle reduces when recovering from a submaximal fatiguing contraction. Further, we found that a submaximal contraction results in a shift of the muscle representation towards posterior sensory territories (figure 4d & 5). This finding becomes more interesting when one considers that markers of fatigue, such as shift in median power of frequency of motor units, are similar across both maximal and submaximal tasks. Thus, a greater loss of corticomotor representation after low-force condition could signify a greater degree of post-exercise depression that is spatially widespread. Further, our results suggest that a loss of anterior higher motor input to M1 or a loss of their output to the muscle may represent a failure of their compensatory capacity that is otherwise critical during the fatiguing contraction, where a posterior shift towards sensory regions following fatigue may be indicative of greater reliance on sensory feedback critical to recovery of the muscle.
It has been previously established that during muscular fatigue, voluntary activation of the muscle diminishes and motor unit firing rates decline as a result of central fatigue (Gandevia, 2001). Further, immediately following a fatiguing task, Brasil-Neto et al. 1993 and others (Samii et al., 1996, Pitcher et al., 2005) demonstrate a continuation of such failure, calling it post-exercise depression, where TMS elicits weaker corticomotor output in the fatigued muscle. We have extended findings of post–exercise depression using mapping of corticomotor representations. We found that although center of gravity did not shift, possibly because we restricted our cortical maps to a 5 × 7 cm2 grid over the motor hotspot, the maximal MEP location shifted posteriorly towards the sensory cortices. In addition, the anterior portion of the motor maps was no longer excitable with TMS, where MEP’s were only able to be elicited within the posterior regions of the maps.
Such spatial shifts post-fatigue can be understood based on functional neuroimaging studies. Based on electroencephalographic (EEG) source analysis and fMRI, it has been demonstrated that fatigue results in an overall shift of the strongest source or center of cortical activation (Liu et al., 2007). During fatigue, regions anterior to M1, including a number of secondary and higher motor cortices, show greater activation (Liu et al., 2002, Liu et al., 2003, van Duinen et al., 2007, Post et al., 2009) and strengthened functional connectivity with M1 (Jiang et al., 2012). Such shifts are thought to compensate for fatigue-related reduction in activation of the M1. For instance, in our study, muscle force was maintained and EMG RMS increased during fatiguing contraction. However, after fatigue we witnessed a decrease in excitability of the corticomotor networks with TMS. How could the CNS manage to increase descending command during fatigue, but result in a less excitable M1 immediately following fatigue? While during fatigue, the corticomotor system projecting to the spinal motor neuron pool may be strengthened by input signals from more cortical fields that do not usually participate in the action under non-fatigue conditions (Liu et al., 2002, Liu et al., 2003, van Duinen et al., 2007, Post et al., 2009), including higher-order areas such as secondary or association motor cortices, this input is likely removed after the fatigue task. In fact, there is added intra-cortical inhibition exerted between higher-motor areas and M1 following fatigue (Benwell et al., 2007). Therefore, the loss of excitation of anterior regions may represent a failure of their compensatory ability; especially since their corticomotor pathways have higher TMS thresholds than M1 to begin with (Baumer et al., 2006). A posterior shift of corticomotor excitability may be indicative of increased sensory feedback from the somatosensory cortex during the recovery phase of fatigue. This hypothesis is in line with Taylor & Gandevia 2001, where they have suggested that submaximal contractions may be influenced by afferent inputs to the M1. Further, Tomasevic et al. (2013) showed that functional communication between the S1 and M1 is altered with small changes in fatigue in patients with multiple sclerosis. The sensory reliance is thought to contribute to continuous monitoring/correction that are required during motor execution (Tomasevic et al., 2013).
An interesting finding is that we only observed a shift in output following low-force but not high-force fatigue, and increases in EMG during low-force but not high-force fatigue. These differences can be understood based on reports of Eichelberger and Bilodeau (2007). They showed that fatigue in low-force conditions is likely central in origin, where fatigue as a result of higher levels of force was mediated more by peripheral mechanisms e.g. reduced calcium release, impaired reuptake of calcium (Davis and Walsh, 2010) and/or occlusion of circulation due to high intramuscular pressure associated with a high-force contraction. High-force fatigue is more likely to deplete its peripheral resources faster because it has previously been demonstrated that the majority of motor units in the first dorsal interosseus muscle are recruited before its force reaches 50% of the MVC, demonstrated by the minimal increase in EMG during high-force fatigue in our findings (De Luca and Hostage, 2010). Still, this is not to say that high intensity contractions do not rely on central mechanisms (Bigland-Ritchie and Woods, 1984, Bilodeau, 2006). For example, another possible explanation may be due to the difference in duration of our fatiguing contractions where submaximal fatigue was maintained for significantly longer than maximal voluntary contractions. Samii et al. 1997 have reported that a significant degree of post-exercise depression only occurs beyond 90 seconds of exercise. This is in line with our results where the submaximal contractions were maintained for 259 seconds and maximal isometric contractions was maintained for 87 seconds.
Even though the present study shows a difference in cortical reorganization following low-force fatigue vs. high-force fatigue, there are a few limitations. Despite our efforts to isolate the muscle contraction to the FDI, it is possible that co-contraction of neighboring muscles may have contributed to the maintenance of our fatigue protocol; especially considering subjects were able to maintain the high-force fatigue for roughly 1.5 minutes. However, even though we did not perform peripheral nerve stimulation to account for peripheral mechanisms, we were able to fatigue the FDI in both the high and low-force condition indicated by the reduction of median power frequency throughout each fatiguing protocol. Still, this does not address how possible co-contraction of neighboring muscles influences the overall results of the study. Future studies will benefit from a comparison of cortical reorganization of an isolated muscle contraction vs. co-contraction fatiguing task. Further, this study is unable to account for the contribution of the spinal motor neurons to the map and excitability changes following the LFF. It has previously been shown that during low-force fatigue the cortex accounts for about one-half to two-thirds of total central fatigue effect by spinal and supraspinal contributions (Smith et al., 2007). However, based on previously mentioned TMS and fMRI studies (Liu et al., 2002, Liu et al., 2003, van Duinen et al., 2007, Post et al., 2009), we believe the reorganization we observed in the present study originates in corticomotor output. Future studies could dissociate whether effects are supraspinal, or spinal or neuro-muscluar in origin.
In a broad context, our findings are significant as they may inform future studies for patients who are afflicted by conditions that result in excessive fatigue and reduced quality of life (i.e. multiple sclerosis, cancer, stroke and chronic fatigue syndrome). Currently, there are limited options for patients with fatigue-related conditions; however, a number of recent studies have shown the promise of treating central mechanisms of fatigue using popular non-invasive brain stimulation techniques for rehabilitation (Tecchio et al., 2013, Saiote et al., 2014, Tecchio et al., 2014). For example, Tecchio et al., 2014 showed that patients with multiple sclerosis report relief from fatigue when the somatosensory cortex was facilitated with anodal transcranial direct current stimulation. These results are in line with the present study, as we demonstrate in a healthy population, a posterior shift in corticospinal excitability following low-force fatigue. By using the healthy population we are able to understand the immediate effects of muscle fatigue on post-exercise depression, where future studies may use its reorganization as a model, which could serve to evaluate the effects of treatment/rehabilitation interventions.
In summary, our study provides evidence for cortical reorganization as well as reduced cortical excitability following low-force fatigue but not high-force fatigue. Based on previous literature, this suggests that high-force fatigue may be mediated to a greater extent peripherally whereas low force fatigue may be mediated via central origins. Still, it is possible that the substantially longer duration of task performance for the low-force fatigue task (259 s for low-force fatigue vs. 87 s for high-force fatigue) may have caused the adaptations at the cortical level. Our results may suggest that a posterior shift towards sensory regions may be indicative of greater reliance on sensory feedback critical to recovery of the muscle post-fatigue.
We studied corticomotor post-exercise depression following submaximal and maximal isometric fatiguing contractions.
Submaximal but not maximal isometric fatigue resulted in reduced corticomotor map representation and corticospinal output.
Submaximal isometric fatigue resulted in a posterior shift in the corticomotor representation.
The exercise depression may be indicative of increased sensory feedback during the recovery phase of fatigue.
Acknowledgments
This work was supported in part by an NIH grant (R01NS35130) to GY, and grants from the NIH and the American Heart Association to EP (1K01HD069504 and 13BGIA17120055) as well as by the Clinical & Translational Science Collaborative (RPC2014-1067) to DAC.
Footnotes
Publisher's Disclaimer: This is a PDF file of an unedited manuscript that has been accepted for publication. As a service to our customers we are providing this early version of the manuscript. The manuscript will undergo copyediting, typesetting, and review of the resulting proof before it is published in its final citable form. Please note that during the production process errors may be discovered which could affect the content, and all legal disclaimers that apply to the journal pertain.
Bibliography
- Baumer T, Bock F, Koch G, Lange R, Rothwell JC, Siebner HR, Munchau A. Magnetic stimulation of human premotor or motor cortex produces interhemispheric facilitation through distinct pathways. J Physiol. 2006;572:857–868. doi: 10.1113/jphysiol.2006.104901. [DOI] [PMC free article] [PubMed] [Google Scholar]
- Benwell NM, Byrnes ML, Mastaglia FL, Thickbroom GW. Primary sensorimotor cortex activation with task-performance after fatiguing hand exercise. Exp Brain Res. 2005;167:160–164. doi: 10.1007/s00221-005-0013-2. [DOI] [PubMed] [Google Scholar]
- Benwell NM, Mastaglia FL, Thickbroom GW. Differential changes in long-interval intracortical inhibition and silent period duration during fatiguing hand exercise. Exp Brain Res. 2007;179:255–262. doi: 10.1007/s00221-006-0790-2. [DOI] [PubMed] [Google Scholar]
- Bigland-Ritchie B, Woods JJ. Changes in muscle contractile properties and neural control during human muscular fatigue. Muscle Nerve. 1984;7:691–699. doi: 10.1002/mus.880070902. [DOI] [PubMed] [Google Scholar]
- Bilodeau M. Central fatigue in continuous and intermittent contractions of triceps brachii. Muscle Nerve. 2006;34:205–213. doi: 10.1002/mus.20572. [DOI] [PubMed] [Google Scholar]
- Brasil-Neto JP, Pascual-Leone A, Valls-Sole J, Cammarota A, Cohen LG, Hallett M. Postexercise depression of motor evoked potentials: a measure of central nervous system fatigue. Exp Brain Res. 1993;93:181–184. doi: 10.1007/BF00227794. [DOI] [PubMed] [Google Scholar]
- Davis MP, Walsh D. Mechanisms of fatigue. J Support Oncol. 2010;8:164–174. [PubMed] [Google Scholar]
- De Luca CJ, Hostage EC. Relationship between firing rate and recruitment threshold of motoneurons in voluntary isometric contractions. Journal of neurophysiology. 2010;104:1034–1046. doi: 10.1152/jn.01018.2009. [DOI] [PMC free article] [PubMed] [Google Scholar]
- Eichelberger TD, Bilodeau M. Central fatigue of the first dorsal interosseous muscle during low-force and high-force sustained submaximal contractions. Clin Physiol Funct Imaging. 2007;27:298–304. doi: 10.1111/j.1475-097X.2007.00751.x. [DOI] [PubMed] [Google Scholar]
- Gandevia SC. Spinal and supraspinal factors in human muscle fatigue. Physiol Rev. 2001;81:1725–1789. doi: 10.1152/physrev.2001.81.4.1725. [DOI] [PubMed] [Google Scholar]
- Gandevia SC, Petersen N, Butler JE, Taylor JL. Impaired response of human motoneurones to corticospinal stimulation after voluntary exercise. J Physiol. 1999;521(Pt 3):749–759. doi: 10.1111/j.1469-7793.1999.00749.x. [DOI] [PMC free article] [PubMed] [Google Scholar]
- Jiang Z, Wang XF, Kisiel-Sajewicz K, Yan JH, Yue GH. Strengthened functional connectivity in the brain during muscle fatigue. Neuroimage. 2012;60:728–737. doi: 10.1016/j.neuroimage.2011.12.013. [DOI] [PMC free article] [PubMed] [Google Scholar]
- Jones EG. GABAergic neurons and their role in cortical plasticity in primates. Cereb Cortex. 1993;3:361–372. doi: 10.1093/cercor/3.5.361-a. [DOI] [PubMed] [Google Scholar]
- Knorr S, Rice CL, Garland SJ. Perspective on neuromuscular factors in poststroke fatigue. Disabil Rehabil. 2012;34:2291–2299. doi: 10.3109/09638288.2012.683233. [DOI] [PubMed] [Google Scholar]
- Kotan S, Kojima S, Miyaguchi S, Sugawara K, Onishi H. Depression of corticomotor excitability after muscle fatigue induced by electrical stimulation and voluntary contraction. Front Hum Neurosci. 2015;9:363. doi: 10.3389/fnhum.2015.00363. [DOI] [PMC free article] [PubMed] [Google Scholar]
- Liepert J, Kotterba S, Tegenthoff M, Malin JP. Central fatigue assessed by transcranial magnetic stimulation. Muscle Nerve. 1996;19:1429–1434. doi: 10.1002/(SICI)1097-4598(199611)19:11<1429::AID-MUS7>3.0.CO;2-E. [DOI] [PubMed] [Google Scholar]
- Liu JZ, Dai TH, Sahgal V, Brown RW, Yue GH. Nonlinear cortical modulation of muscle fatigue: a functional MRI study. Brain Res. 2002;957:320–329. doi: 10.1016/s0006-8993(02)03665-x. [DOI] [PubMed] [Google Scholar]
- Liu JZ, Lewandowski B, Karakasis C, Yao B, Siemionow V, Sahgal V, Yue GH. Shifting of activation center in the brain during muscle fatigue: an explanation of minimal central fatigue? Neuroimage. 2007;35:299–307. doi: 10.1016/j.neuroimage.2006.09.050. [DOI] [PMC free article] [PubMed] [Google Scholar]
- Liu JZ, Shan ZY, Zhang LD, Sahgal V, Brown RW, Yue GH. Human brain activation during sustained and intermittent submaximal fatigue muscle contractions: an FMRI study. J Neurophysiol. 2003;90:300–312. doi: 10.1152/jn.00821.2002. [DOI] [PubMed] [Google Scholar]
- McKay WB, Tuel SM, Sherwood AM, Stokic DS, Dimitrijevic MR. Focal depression of cortical excitability induced by fatiguing muscle contraction: a transcranial magnetic stimulation study. Exp Brain Res. 1995;105:276–282. doi: 10.1007/BF00240963. [DOI] [PubMed] [Google Scholar]
- Oldfield RC. The assessment and analysis of handedness: the Edinburgh inventory. Neuropsychologia. 1971;9:97–113. doi: 10.1016/0028-3932(71)90067-4. [DOI] [PubMed] [Google Scholar]
- Petersen NT, Taylor JL, Butler JE, Gandevia SC. Depression of activity in the corticospinal pathway during human motor behavior after strong voluntary contractions. J Neurosci. 2003;23:7974–7980. doi: 10.1523/JNEUROSCI.23-22-07974.2003. [DOI] [PMC free article] [PubMed] [Google Scholar]
- Pitcher JB, Robertson AL, Clover EC, Jaberzadeh S. Facilitation of cortically evoked potentials with motor imagery during post-exercise depression of corticospinal excitability. Exp Brain Res. 2005;160:409–417. doi: 10.1007/s00221-004-2021-z. [DOI] [PubMed] [Google Scholar]
- Plow EB, Varnerin N, Cunningham DA, Janini D, Bonnett C, Wyant A, Hou J, Siemionow V, Wang XF, Machado AG, Yue GH. Age-related weakness of proximal muscle studied with motor cortical mapping: a TMS study. PLoS One. 2014;9:e89371. doi: 10.1371/journal.pone.0089371. [DOI] [PMC free article] [PubMed] [Google Scholar]
- Post M, Steens A, Renken R, Maurits NM, Zijdewind I. Voluntary activation and cortical activity during a sustained maximal contraction: an fMRI study. Human brain mapping. 2009;30:1014–1027. doi: 10.1002/hbm.20562. [DOI] [PMC free article] [PubMed] [Google Scholar]
- Rossi S, Hallett M, Rossini PM, Pascual-Leone A. Safety, ethical considerations, and application guidelines for the use of transcranial magnetic stimulation in clinical practice and research. Clin Neurophysiol. 2009;120:2008–2039. doi: 10.1016/j.clinph.2009.08.016. [DOI] [PMC free article] [PubMed] [Google Scholar]
- Saiote C, Goldschmidt T, Timaus C, Steenwijk MD, Opitz A, Antal A, Paulus W, Nitsche MA. Impact of transcranial direct current stimulation on fatigue in multiple sclerosis. Restor Neurol Neurosci. 2014;32:423–436. doi: 10.3233/RNN-130372. [DOI] [PubMed] [Google Scholar]
- Samii A, Wassermann EM, Hallett M. Post-exercise depression of motor evoked potentials as a function of exercise duration. Electroencephalogr Clin Neurophysiol. 1997;105:352–356. doi: 10.1016/s0924-980x(97)00033-7. [DOI] [PubMed] [Google Scholar]
- Samii A, Wassermann EM, Ikoma K, Mercuri B, George MS, O’Fallon A, Dale JK, Straus SE, Hallett M. Decreased postexercise facilitation of motor evoked potentials in patients with chronic fatigue syndrome or depression. Neurology. 1996;47:1410–1414. doi: 10.1212/wnl.47.6.1410. [DOI] [PubMed] [Google Scholar]
- Sanes JN, Wang J, Donoghue JP. Immediate and delayed changes of rat motor cortical output representation with new forelimb configurations. Cereb Cortex. 1992;2:141–152. doi: 10.1093/cercor/2.2.141. [DOI] [PubMed] [Google Scholar]
- Smith JL, Martin PG, Gandevia SC, Taylor JL. Sustained contraction at very low forces produces prominent supraspinal fatigue in human elbow flexor muscles. J Appl Physiol (1985) 2007;103:560–568. doi: 10.1152/japplphysiol.00220.2007. [DOI] [PubMed] [Google Scholar]
- Talelli P, Greenwood RJ, Rothwell JC. Arm function after stroke: neurophysiological correlates and recovery mechanisms assessed by transcranial magnetic stimulation. Clin Neurophysiol. 2006;117:1641–1659. doi: 10.1016/j.clinph.2006.01.016. [DOI] [PubMed] [Google Scholar]
- Taylor JL, Gandevia SC. Transcranial magnetic stimulation and human muscle fatigue. Muscle Nerve. 2001;24:18–29. doi: 10.1002/1097-4598(200101)24:1<18::aid-mus2>3.0.co;2-d. [DOI] [PubMed] [Google Scholar]
- Tecchio F, Cancelli A, Cottone C, Tomasevic L, Devigus B, Zito G, Ercolani M, Carducci F. Regional personalized electrodes to select transcranial current stimulation target. Front Hum Neurosci. 2013;7:131. doi: 10.3389/fnhum.2013.00131. [DOI] [PMC free article] [PubMed] [Google Scholar]
- Tecchio F, Cancelli A, Cottone C, Zito G, Pasqualetti P, Ghazaryan A, Rossini PM, Filippi MM. Multiple sclerosis fatigue relief by bilateral somatosensory cortex neuromodulation. J Neurol. 2014;261:1552–1558. doi: 10.1007/s00415-014-7377-9. [DOI] [PubMed] [Google Scholar]
- Tomasevic L, Zito G, Pasqualetti P, Filippi M, Landi D, Ghazaryan A, Lupoi D, Porcaro C, Bagnato F, Rossini P, Tecchio F. Cortico-muscular coherence as an index of fatigue in multiple sclerosis. Mult Scler. 2013;19:334–343. doi: 10.1177/1352458512452921. [DOI] [PubMed] [Google Scholar]
- van Duinen H, Renken R, Maurits N, Zijdewind I. Effects of motor fatigue on human brain activity, an fMRI study. Neuroimage. 2007;35:1438–1449. doi: 10.1016/j.neuroimage.2007.02.008. [DOI] [PubMed] [Google Scholar]
- Zanette G, Bonato C, Polo A, Tinazzi M, Manganotti P, Fiaschi A. Long-lasting depression of motor-evoked potentials to transcranial magnetic stimulation following exercise. Exp Brain Res. 1995;107:80–86. doi: 10.1007/BF00228019. [DOI] [PubMed] [Google Scholar]
- Zijdewind C, Bosch W, Goessens L, Kandou TW, Kernell D. Electromyogram and force during stimulated fatigue tests of muscles in dominant and non-dominant hands. Eur J Appl Physiol Occup Physiol. 1990;60:127–132. doi: 10.1007/BF00846032. [DOI] [PubMed] [Google Scholar]