Abstract
Background/Aims
Two-dimensional shear-wave (2D-SWE) elastography is one of the noninvasive methods for the evaluation of liver fibrosis. The purpose of this study is to investigate the changes in liver stiffness (LS) by employing 2D-SWE as well as its correlation with noninvasive fibrosis markers in patients with chronic hepatitis C (CHC), who are undergoing direct-acting antiviral (DAA) therapy.
Materials and Methods
The researchers included all the patients with CHC who are scheduled for DAA treatment in this study. 2D-SWE measurements were performed at baseline, end of treatment (EOT), and 12 weeks after the treatment. According to the latest EFSUMB guidelines, elastography measurements were performed during the ultrasonographic evaluation and recorded in kilopascals (unit). The correlation between biochemical and viral responses, and noninvasive fibrosis scores (FIB-4, AST-to-platelet ratio index (APRI)) was also evaluated.
Results
This study employed 230 patients who underwent treatment with DAAs between September 2016 and September 2017. However, 131 patients were able to complete the study, of which 48 (36.6%) were male and 83 (63.4%) were female. The mean age was 65.0 (±11.18) years. Both EOT and sustained viral response (SVR) had the same rate of 99.2% (130/131). The SWE measurement (mean) values at pretreatment, EOT, and 12 weeks after treatment was 12.92, 10.45, and 9.07 kPa, respectively (p<0.05), whereas the APRI scores were 0.76, 0.39, and 0.30, respectively (p<0.05). Additionally, the FIB-4 scores at pretreatment, EOT, and 12 weeks after treatment were 2.98, 2.43, and 2.03, respectively (p<0.05). The results of liver stiffness measurements (LSM) were similar in all the groups of cirrhotic, noncirrhotic, treatment-experienced, and treatment-naive patients.
Conclusion
DAA treatments in the patients with CHC led to almost a complete SVR and a considerable decrease in LS in a short time.
Keywords: Chronic Hepatitis C, liver stiffness, shear wave elastography
INTRODUCTION
The hepatitis C virus (HCV) is a primary cause of chronic liver disease globally with substantially high morbidity and mortality rates (1). Approximately 70–80 million individuals are chronically infected with HCV worldwide. Chronic hepatitis C (CHC) causes an increased accumulation of fibrous tissues in the liver, thereby resulting in cirrhosis, portal hypertension, hepatic insufficiency, and hepatocellular carcinoma (2). Hepatic fibrosis increases with the progression of disease. The stage of liver fibrosis needs to be evaluated in patients with CHC, especially for prognosis, disease management, and determination of the optimal treatment response (3–5). Although liver biopsy is still the gold standard method for the evaluation of inflammation and fibrosis, it is an invasive procedure that is not preferred by patients (6, 7). Additionally, the obtained piece in this test represents a small portion of the liver, which can increase the possibility of sampling errors. Therefore, noninvasive assessment methods were developed for the evaluation of liver fibrosis. These procedures include some blood-based methods such as AST to platelet ratio index (APRI), FIB-4, and so on (8, 9). Noninvasive fibrosis serum markers and ultrasonography-based elastography methods [shear-wave elastography (SWE)] have gained prominence for the evaluation of liver fibrosis in chronic liver diseases with viral etiologies (5, 10). Elastography (SWE) is a method that is used to estimate the biomechanical features associated with elastic restoring forces generated in the tissues in response to the applied shear stress. A force generated manually (by pressing on or vibrating the skin over the organ) or electromechanically (by an ultrasound probe) causes a reversible micron-level change in the shape of the tissue at a constant depth. Hard tissues are displaced less than soft tissues, and these tissue displacements can be measured by employing elastographic methods (11). The first elastographic method used for the evaluation of liver fibrosis is transient elastography (TE) (12). TE is quite sensitive in identifying and excluding cirrhosis in patients with chronic liver diseases of different etiologies (12). Recently, other forms of SWE methods, apart from TE, have emerged as assessment tools of liver fibrosis. Some studies have shown that 2D-SWE has a higher applicability than the reference elastography method and is less affected by inflammation and steatosis, especially in the early stages of fibrosis (13, 14).
Nowadays, the treatment of HCV has evolved from interferon (IFN)-based therapies to oral administration of drugs, known as direct-acting antiviral (DAA) agents. These drugs directly target the virus-specific proteins and have revolutionized the treatment of chronic HCV (15). The purpose of this study is to investigate the changes in liver stiffness (LS) by employing 2D-SWE as well as its correlation with noninvasive fibrosis markers in patients with chronic hepatitis C (CHC), who are undergoing direct-acting antiviral (DAA) therapy.
MATERIALS AND METHODS
This is a prospective, cross-sectional cohort study. The researchers of this study invited all patients scheduled for DAA treatment with CHC diagnosis at their clinic. The researchers included both the patients with and without cirrhosis along with naïve and experienced patients undertaking the administration of IFN and protease inhibitors (Boceprevir or Telaprevir) in this study. Exclusion criteria were as follows: patients with ascites or chronic renal failure and patients who did not wish to participate study. Although ascites do not interfere with 2D-SWE measurement (unlike with TE), patients with ascites were excluded from this study to avoid conflict. In addition, the researchers also excluded patients with alcohol consumption of more than 80 g/day, severe fatty liver, hepatotoxic drugs, autoimmune hepatitis, primary biliary cirrhosis, hemochromatosis, or Wilson’s disease in this study. The Ethical Committee granted their approval for this study and forms of informed consent were obtained from the patients before being included in the study. Patients were grouped as cirrhotic, noncirrhotic, treatment-naive, and treatment-experienced. Furthermore, the patients were also grouped according to the started treatment regimen [ledipasvir/sofosbuvir (L/S) combination or ritonavir, ombitasvir, paritaprevir, and dasabuvir (3D) combination]. Biochemical and virologic parameters (HCV RNA, ALT, serum albumin, etc.) were obtained in every three months, and noninvasive fibrosis markers (FIB-4 and APRI scores) were calculated. 2D-SWE measurements were performed at baseline, end of treatment, and three months after the treatment. Ultrasound examinations and elastography measurements were performed by using ultrasonography device with shear-wave feature (Aplio 500, Toshiba, Tokyo, Japan). According to EFSUMB criteria, the same practitioner (SY) took the elastography measurements during the ultrasonographic evaluation of these patients. The patients undertook fasting for at least 6–8 h fasting, which was followed by 10-min rest. They laid on their back, and the right intercostal space for the right lobe of liver was examined for anomalies (11). An SWE measuring window on the monitor was placed on 1–3 cm below the capsule within the liver tissue. The practitioner achieved ten measurements in the kilopascal unit, and their mean was recorded as the valid measurement. The correlation between the biochemical and viral parameters was also evaluated.
Statistical analysis
The Statistical Package for the Social Sciences (SPSS) version 21 (IBM Corp.; Armonk, NY, USA) was employed for statistical analyses, and a p value less than 0.05 was accepted as valid for this study. The repeated measures ANOVA test was used to evaluate the changes in LSM, APRI, and FIB-4 measurements at different time intervals (at pretreatment, end of treatment, and 12 weeks after treatment cessation). The LSM and other variables (APRI and FIB-4) were investigated by using histograms to determine their normal distribution. Because all parameters were normally distributed, Pearson test was used to calculate their correlation coefficients and their significance.
RESULTS
The researchers invited 230 patients who were administered with DAA agents in the department between September 2016 and September 2017 to participate in this study. Patients with ascites (eight patients) were excluded. In total, 43 patients did not agree to participate in the study; the most probable reason was not to attend the time-consuming, repetitive LSMs. Finally, 179 patients agreed to participate. However, only 131 patients attended the LSM on time and completed the study (Figure 1). The mean age of the patients was 65.0 (±11.18) years. Of the total 131 patients, 48 (36.6%) patients were male and 83 (63.4%) were female; 51 patients were treatment naive, 61 had experienced treatment with PEG-IFN, and 19 had experienced treatment with protease inhibitor and PEG–IFN. Of the total 131 patients, 28 patients were cirrhotic and 103 were non-cirrhotic. Apart from two patients (one genotype 2 and one genotype 4), all patients (n=129) had HCV genotype 1. The initial HCV RNA mean in the overall group was 2.35×10⁶±5.36x10⁶ IU/mL. Moreover, 94 patients were treated with a combination of ledipasvir/sofosbuvir and 37 with a combination of ritonavir, ombitasvir, paritaprevir, and dasabuvir (3D). Ribavirin was added to the treatment for 23 patients. DAA regimes were administered in 55 and 76 patients for 12 and 24 weeks, respectively. The mean serum alanine aminotransferase (ALT) levels in the overall group at pretreatment, EOT, and 12 weeks after the treatment cessation were 34.6, 19.6, and 14.6 IU/L, respectively (p<0.05; Table 1). The mean serum aspartate aminotransferase (AST) levels in the overall group at pretreatment, EOT, and 12 weeks after the treatment cessation were 38.5, 22.5, and 19.5 IU/L, respectively (p<0.05; Table 1). There was an increase in the serum albumin level, whereas the serum total bilirubin had a statistically insignificant decrease (Table 1). At the end of the DAA treatment, the viral response was achieved in 130 of 131 patients (99.2%), and the SVR after 12 weeks of treatment cessation was the same. Similarly, APRI and FIB-4 scores showed considerable improvement with treatment (Table 1, Figures 2, 3).
Figure 1.
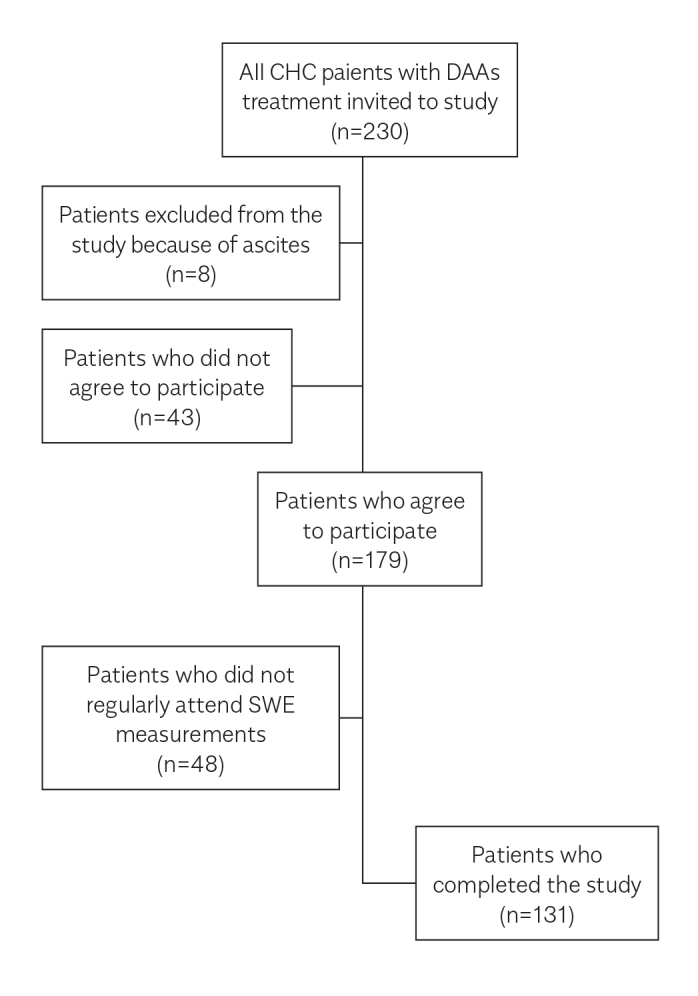
Flow chart of the patients. A total of 230 patients with CHC, who were treated with DAAs, were included, and a total of 131 patients completed the study. CHC: Chronic hepatitis C; DAA: direct-acting antivirals; SWE: shear-wave elastography.
Table 1.
Serum AST, ALT, albumin levels, and APRI and FIB-4 scores at pretreatment, EOT and 12 weeks after the treatment.
| Parameter | Pretreatment | EOT | 12 weeks after treatment | p |
|---|---|---|---|---|
| ALT (U/L) | 34.6 | 19.6 | 14.6 | <0.05 |
| AST (U/L) | 38.5 | 22.5 | 19.5 | <0.05 |
| Serum bilirubin (mg/dL) | 0.76 | 0.63 | 0.61 | 0,07 |
| Serum albumin (mg/dL) | 4.09 | 4.17 | 4.29 | <0.05 |
| Platelet Count (x1000/mm3) | 181 | 194 | 193 | <0.05 |
| Mean APRI (all groups) (n=131) | 0.76 | 0.39 | 0.30 | <0.05 |
| Mean APRI (cirrhotic) (n=28) | 1.32 | 0.66 | 0.46 | <0.05 |
| Mean APRI (noncirrhotic) (n=103) | 0.61 | 0.31 | 0.25 | <0.05 |
| Mean FIB-4 (all groups) (n=131) | 2.98 | 2.43 | 2.03 | <0.05 |
| Mean FIB-4 (cirrhotic) (n=28) | 5.31 | 4.65 | 3.54 | <0.05 |
| Mean FIB-4 (noncirrhotic)(n=103) | 2.35 | 1.82 | 1.61 | <0.05 |
EOT: end of treatment: ALT: Alanine Aminotransferase: AST: Aspartate Aminotransferase
Figure 2.
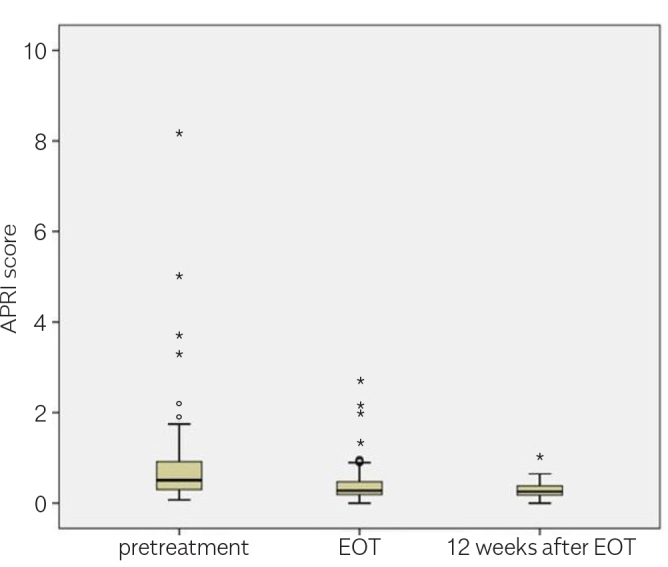
APRI scores by time in the overall groups (n=131).
Figure 3.
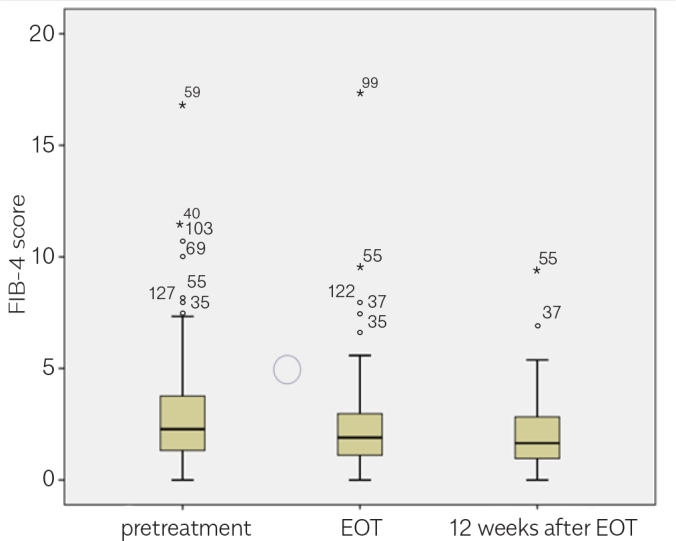
FIB-4 scores by time in the overall groups (n=131).
Results of LS measurement
A notable decrease was observed in the LS measurements of patients receiving DAA therapy, which was also sustained in the subsequent measurements (Table 2, Figures 4–6). The change in FIB-4 and APRI results shared a correlation with the LSM. Table 3 and 4 present the correlation coefficients between LSM (kPa) and FIB-4 and APRI scores, respectively.
Table 2.
Liver stiffness measurements, overall and in the subgroups, at pretreatment, EOT, and 12 weeks after the treatment cessation.
| Subgroups | Liver stiffness (kPa) (pretreatment) | Liver stiffness (kPa) (EOT) | Liver stiffness (kPa) (12 weeks after treatment) | p |
|---|---|---|---|---|
| Over all (n=131) | 12.92 | 10.45 | 9.07 | <0.05 |
| Cirrhotic (n=28) | 16.13 | 12.60 | 10.98 | <0.05 |
| Noncirrhotic (n=103) | 11.94 | 9.79 | 8.48 | <0.05 |
| Ledipasvir/Sofosbuvir treatment (n=94) | 13.64 | 10.71 | 9.38 | <0.05 |
| 3D treatment (n=37) | 10.38 | 9.51 | 7.93 | <0.05 |
| Treatment naive (n=51) | 12.56 | 10.44 | 8.61 | <0.05 |
| Treatment experienced (n=80) | 13.09 | 10.45 | 9.28 | <0.05 |
EOT: end of treatment: kPa: kilo pascal
Figure 4.
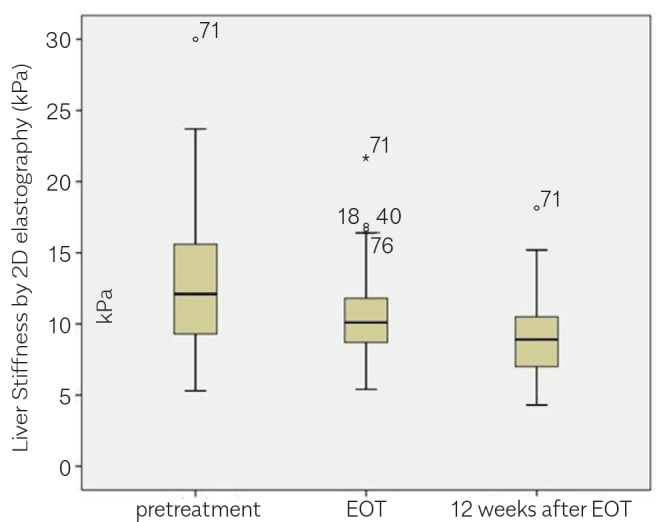
Liver stiffness measurements (kPa) by time in the overall groups (n=131).
Figure 5.
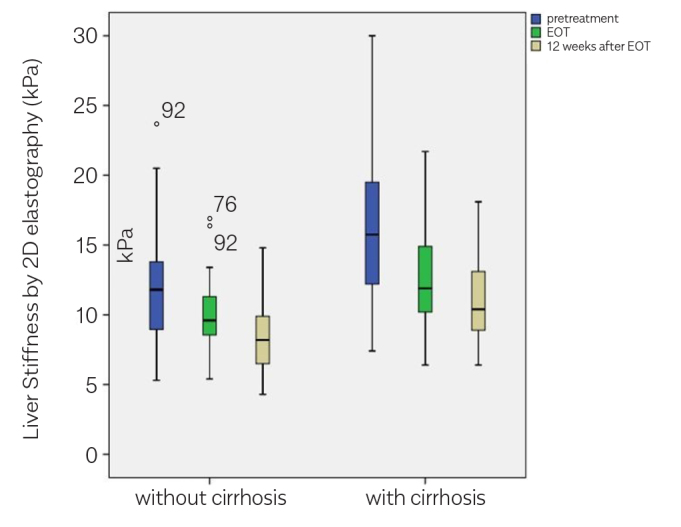
Liver stiffness measurements (kPa) by time in the cirrhotic and noncirrhotic subgroups.
Figure 6.
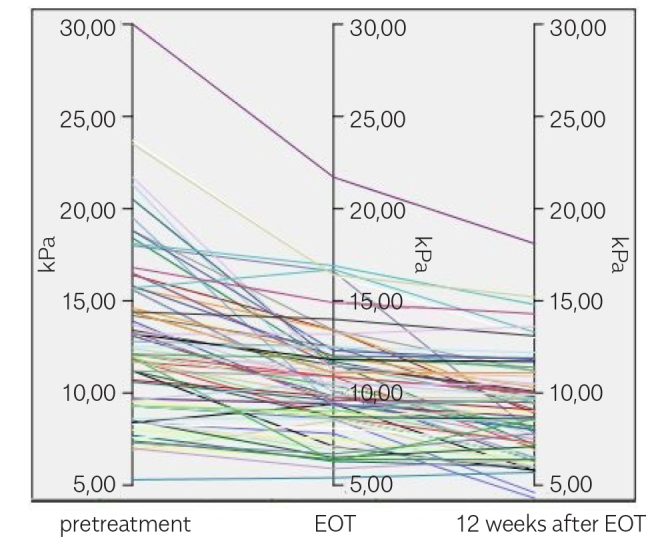
Liver stiffness measurements (kPa) by time for individuals. pretreatment EOT 12 weeks after EOT
Table 3.
Pearson correlation coefficient values for liver stiffness measurements (kPa) and FIB-4 results at the time point of pretreatment, EOT, and 12 weeks after the EOT.
| Liver Stiffness (kPa) and FIB-4 | correlation coefficient | p |
|---|---|---|
| pretreatment | 0.499 | <0.05 |
| EOT | 0.314 | <0.05 |
| 12 weeks after the EOT | 0.329 | <0.05 |
kPa: kilo pascal: FIB-4: fibrosis 4: EOT: end of treatment
Table 4.
Pearson correlation coefficient values for liver stiffness measurements (kPa) and APRI results at the time point of pretreatment, EOT, and 12 weeks after the EOT.
| Liver Stiffness (kPa) and APRI | correlation coefficient | p |
|---|---|---|
| Pretreatment | 0.246 | <0.05 |
| EOT | 0.214 | <0.05 |
| 12 weeks after the EOT | 0.300 | <0.05 |
kPa: kilo pascal: APRI: AST to platelet ratio: EOT: end of treatment
DISCUSSION
We observed a considerable decrease in LS in patients, who responded to DAA therapy, right after the treatment in a relatively short time. This improvement sustained in patients with SVR after the treatment. This decrease was preserved in both cirrhotic and noncirrhotic subgroups. LS alteration after antiviral treatment has already been published in several studies by using various elastography techniques. A previous study evaluated the effects of treatment on LS in patients with CHC who received PEG–IFN and were assessed by TE. Additionally, this treatment induced a considerable decrease in LS (16).
TE had been employed for the evaluation of LS for several years. Today, there are several ultrasonographic real-time SWE-based (ARFI, point SWE, 2D-SWE, and 3D-SWE) systems. The comparison of these systems revealed that they are all same in LS assessment, even the diagnostic performance for 2D-SWE was better than for TE (14, 17–19).
In addition, 2D-SWE measurement is more convenient than TE because it images LS in real time, is not limited to a single location, and is accompanied by a higher frame rate of B-mode ultrasonographic imaging (13, 14). Apart from this, shear-wave penetrations of several centimeters are needed as surface mechanical sources to create shear waves in TE, unlike ultrasound-based 2D-SWE LSM, in which shear waves are generated by US beams (11). Instead, the 2D-SWE LSM with a clearer and real-time view of the region of interest in liver tissue may be expected to be more useful than TE in this regard.
This study showed that the decrease in mean LSM (kPa) was also consistent with the improvements in viral and biochemical responses along with APRI and FIB-4 scores. This normalization of APRI and FIB-4 scores is mostly correlated with ALT and AST, which are the determinants of these scores (20, 21). Because these scores are non-invasive, reproducible, and well correlated with clinical results, they are generally accepted in the evaluation of liver fibrosis (22).
A very similar study (just like ours) from Japan (23), in a similar way, reported that there was a notable improvement in LS and fibrosis markers with the administration of daclatasvir–asunapravir in patients with CHC.
The main limitation of our study is the lack of the simultaneous liver biopsies accompanying the elastographic measurements for LS. Because liver biopsy was not performed in this study, it was difficult to suggest that the correction in elastography was accompanied by a histological improvement. A successful antiviral therapy was expected to improve liver fibrosis and, then, accordingly decrease LSM. In SWE, the measurement of LS is also determined by inflammation and congestion, apart from liver fibrosis. Therefore, the reduction in LSM may also be due to both decreased liver fibrosis and/or inflammation. This observation explains the similarity in LSM between the cirrhotic and noncirrhotic groups in this study.
The patients in this study were mostly female. No statistically significant difference in age was observed between females (67.7±10.7 years) and males (60.4±10.3 years) (p=0.874). No statistically significant difference between female and male patients was found during their SWE measurements (13.2, 9.7, and 6.5 kPa for females, and 11.3, 9.1, and 5.4 kPa for males; p=0.456). Studies have shown that body mass index and gender do not affect measurements (11).
In conclusion, DAA agents have revolutionized the treatment of CHC and obtained a higher SVR. Once again, this study shows that this response was associated with an improvement in LS. This may be particularly crucial for the patients with a high risk of hepatic decompensation and HCC development.
Footnotes
Presented in: This study was presented at the 34th UGH Congress 1–6 December 2017, Antalya, Turkey.
Ethics Committee Approval: Ethics committee approval was received for this study from the Ethical Committee of Mersin University (decision date: 07/02/2019. desicion number: 78017789/050.01.04/E970387).
Informed Consent: Written informed consent was obtained from the patients who participated in this study.
Peer-review: Externally peer-reviewed.
Author contributions: Concept – O.S., S.Y.; Design – O.S., S.Y.; Supervision - E.A., O.S.; Resource – O.S., S.Y., O.Ö.; Materials –O.S., E.A., E.U., O.Ö., E.A., E.Ü.; Data Collection and/or Processing – O.S, E.A., E.A., E.Ü., S.Y., O.Ö.; Analysis and/or Interpretation – S.Y., O.S.; Literature Search – O.Ö., E.Ü., E.A.; Writing – S.Y., O.S.; Critical Reviews – O.S.
Conflict of Interest: The authors have no conflict of interest to declare.
Financial Disclosure: The authors declared that this study has received no financial support.
REFERENCES
- 1.Shepard CW, Finelli L, Alter MJ. Global epidemiology of hepatitis C virus infection. Lancet Infect Dis. 2005;5:558–67. doi: 10.1016/S1473-3099(05)70216-4. [DOI] [PubMed] [Google Scholar]
- 2.Barr RG, Ferraioli G, Palmeri ML, et al. Elastography Assessment of Liver Fibrosis: Society of Radiologists in Ultrasound Consensus Conference Statement. Radiology. 2015;276:845–61. doi: 10.1148/radiol.2015150619. [DOI] [PubMed] [Google Scholar]
- 3.Gebo KA, Herlong HF, Torbenson MS, et al. Role of liver biopsy in management of chronic hepatitis C: a systematic review. Hepatology. 2002;36(5 Suppl 1):S161–72. doi: 10.1053/jhep.2002.36989. [DOI] [PubMed] [Google Scholar]
- 4.Marcellin P, Asselah T, Boyer N. Fibrosis and disease progression in hepatitis C. Hepatology. 2002;36(5 Suppl 1):S47–56. doi: 10.1002/hep.1840360707. [DOI] [PubMed] [Google Scholar]
- 5.Abe T, Kuroda H, Fujiwara Y, et al. Accuracy of 2D shear wave elastography in the diagnosis of liver fibrosis in patients with chronic hepatitis C. J Clin Ultrasound. 2018;46:319–27. doi: 10.1002/jcu.22592. [DOI] [PubMed] [Google Scholar]
- 6.Ishak K, Baptista A, Bianchi L, et al. Histological grading and staging of chronic hepatitis. J Hepatol. 1995;22:696–9. doi: 10.1016/0168-8278(95)80226-6. [DOI] [PubMed] [Google Scholar]
- 7.Desmet VJ, Gerber M, Hoofnagle JH, Manns M, Scheuer PJ. Classification of chronic hepatitis: diagnosis, grading and staging. Hepatology. 1994;19:1513–20. doi: 10.1002/hep.1840190629. [DOI] [PubMed] [Google Scholar]
- 8.Sheth SG, Flamm SL, Gordon FD, Chopra S. AST/ALT ratio predicts cirrhosis in patients with chronic hepatitis C virus infection. Am J Gastroenterol. 1998;93:44–8. doi: 10.1111/j.1572-0241.1998.044_c.x. [DOI] [PubMed] [Google Scholar]
- 9.Kim BK, Kim DY, Park JY, et al. Validation of FIB-4 and comparison with other simple noninvasive indices for predicting liver fibrosis and cirrhosis in hepatitis B virus-infected patients. Liver Int. 2010;30:546–53. doi: 10.1111/j.1478-3231.2009.02192.x. [DOI] [PubMed] [Google Scholar]
- 10.Bert F, Stahmeyer JT, Rossol S. Ultrasound Elastography Used for Preventive Non-Invasive Screening in Early Detection of Liver Fibrosis. J Clin Med Res. 2016;8:650–5. doi: 10.14740/jocmr2625w. [DOI] [PMC free article] [PubMed] [Google Scholar]
- 11.Dietrich CF, Bamber J, Berzigotti A, et al. EFSUMB Guidelines and Recommendations on the Clinical Use of Liver Ultrasound Elastography, Update 2017 (Long Version) Ultraschall Med. 2017;38:e48. doi: 10.1055/a-0641-0076. [DOI] [PubMed] [Google Scholar]
- 12.European Association for Study of Liver; Asociacion Latino-americana para el Estudio del Higado. EASL-ALEH Clinical Practice Guidelines: Non-invasive tests for evaluation of liver disease severity and prognosis. J Hepatol. 2015;63:237–64. doi: 10.1016/j.jhep.2015.04.006. [DOI] [PubMed] [Google Scholar]
- 13.Poynard T, Pham T, Perazzo H, et al. Real-Time Shear Wave versus Transient Elastography for Predicting Fibrosis: Applicability, and Impact of Inflammation and Steatosis. A Non-Invasive Comparison. PLoS One. 2016;11:e0163276. doi: 10.1371/journal.pone.0163276. [DOI] [PMC free article] [PubMed] [Google Scholar]
- 14.Tada T, Kumada T, Toyoda H, et al. Utility of real-time shear wave elastography for assessing liver fibrosis in patients with chronic hepatitis C infection without cirrhosis: Comparison of liver fibrosis indices. Hepatol Res. 2015;45:E122–9. doi: 10.1111/hepr.12476. [DOI] [PubMed] [Google Scholar]
- 15.Gupta V, Kumar A, Sharma P, Arora A. Newer direct-acting antivirals for hepatitis C virus infection: Perspectives for India. Indian J Med Res. 2017;146:23–33. doi: 10.4103/ijmr.IJMR_679_15. [DOI] [PMC free article] [PubMed] [Google Scholar]
- 16.Yada N, Sakurai T, Minami T, et al. Ultrasound elastography correlates treatment response by antiviral therapy in patients with chronic hepatitis C. Oncology. 2014;87(Suppl 1):118–23. doi: 10.1159/000368155. [DOI] [PubMed] [Google Scholar]
- 17.Lee SM, Chang W, Kang HJ, Ahn SJ, Lee JH, Lee JM. Comparison of four different Shear Wave Elastography platforms according to abdominal wall thickness in liver fibrosis evaluation: a phantom study. Med Ultrason. 2019;21:22–9. doi: 10.11152/mu-1737. [DOI] [PubMed] [Google Scholar]
- 18.Kim YY, Kim MJ, Shin HJ, Yoon H, Kim HY, Lee MJ. Interconversion of elasticity measurements between two-dimensional shear wave elastography and transient elastography. Med Ultrason. 2018;20:127–33. doi: 10.11152/mu-1307. [DOI] [PubMed] [Google Scholar]
- 19.Mulabecirovic A, Mjelle AB, Gilja OH, Vesterhus M, Havre RF. Liver elasticity in healthy individuals by two novel shear-wave elastography systems-Comparison by age, gender, BMI and number of measurements. PLoS One. 2018;13(9):e0203486. doi: 10.1371/journal.pone.0203486. [DOI] [PMC free article] [PubMed] [Google Scholar]
- 20.Martinez SM, Fernández-Varo G, González P, et al. Assessment of liver fibrosis before and after antiviral therapy by different serum marker panels in patients with chronic hepatitis C. Aliment Pharmacol Ther. 2011;33:138–48. doi: 10.1111/j.1365-2036.2010.04500.x. [DOI] [PubMed] [Google Scholar]
- 21.Stasi C, Milani S. Non-invasive assessment of liver fibrosis: Between prediction/prevention of outcomes and cost-effectiveness. World J Gastroenterol. 2016;22:1711–20. doi: 10.3748/wjg.v22.i4.1711. [DOI] [PMC free article] [PubMed] [Google Scholar]
- 22.WHO Guidelines Approved by the Guidelines Review Committee. Guidelines for the Screening, Care and Treatment of Persons with Hepatitis C Infection. World Health Organization Copyright (c) World Health Organization; Geneva: 2014. 2014. [Google Scholar]
- 23.Tada T, Kumada T, Toyoda H, et al. Improvement of liver stiffness in patients with hepatitis C virus infection who received direct-acting antiviral therapy and achieved sustained virological response. J Gastroenterol Hepatol. 2017;32:1982–8. doi: 10.1111/jgh.13788. [DOI] [PubMed] [Google Scholar]


