

One of the goals of imprisonment is to reduce violence.1 Although imprisonment has risen dramatically since the 1970s, its effects on future violent crime are poorly understood.2 This study’s objective was to examine the effect of imprisonment on violent crime in the community among individuals on the policy margin between prison and probation sentences. Drawing on data from a population-based cohort of individuals convicted of a felony in Michigan between 2003 and 2006 (n=111,110) and followed through June 2015, we compared rates of commission of violent crime committed by individuals sentenced to prison to individuals sentenced to probation using a natural experiment based on the random assignment of judges to criminal cases. Being sentenced to prison had no significant effects on arrests or convictions for violent crimes after release from prison, but imprisonment modestly reduced the probability of violence if comparisons included the effects of incapacitation during imprisonment. Results suggest that for individuals on the current policy margin between prison and probation, imprisonment is an ineffective long-term intervention for violence prevention, as it has, on balance, no rehabilitative or deterrent effects after release.
Understanding and preventing violence is a longstanding area of study in the social, behavioral, and health sciences. The World Health Organization has declared violence to be a “leading worldwide public health problem,” conclusions echoed by the US Surgeon General, Centers for Disease Control, and National Academy of Sciences.3–6 One estimate puts the medical costs for injuries caused by violence in the United States at over $5 billion per year.7 There are also persistent mental health effects of violence that impact individuals involved in violence and secondary effects on family, friends, caregivers, and communities.8,9 Race/ethnicity, gender and income are all correlated with exposure to violence, and violence is concentrated in poor communities.9–11 For example, homicide is a leading cause of death among young black men in the United States.12
Violence has also long-played a central role in policy decisions related to the criminal justice system. While there are many motivations for imprisonment, including retribution, governments imprison individuals convicted of violent crimes in part to prevent future violence in the community.1 Indeed, perhaps the most widespread intervention intended to reduce violence is imprisonment, the rate of which has risen dramatically since the 1970s.13 Public fear of violence and disorder is widely cited as a cause of this increase.14–17 Violence also features prominently in contemporary debates around reducing imprisonment. Concerns about negative effects of imprisonment on mental and physical health, employment, political representation, and other measures of economic and social wellbeing, coupled with the massive public cost of current levels of imprisonment, have prompted calls for “decarceration,” primarily by diverting people with non-violent offenses from prison to alternative punishments.18 However, approximately 46 percent of people in US prisons were incarcerated for a violent offense.19 As a result, any effort to significantly reduce the prison population must also lower the rates of imprisonment or the sentence lengths (or both) for people with a conviction for violence.19,20
Theories disagree as to whether imprisonment will increase or decrease violence in the community. There are three potential mechanisms by which imprisonment may reduce future violence: incapacitation refers to the idea that individuals in prison cannot commit acts of violence against people in the community; deterrence refers to the theory that people who have been imprisoned will be less likely to engage in violence after they are released if the risk of being returned is sufficiently high; and rehabilitation represents the possibility that individuals may receive productive treatment programs and services while in prison that address underlying psychological processes which could, if untreated, cause violent behavior.21,22
Alternatively, imprisonment could increase a person’s propensity toward violence. Imprisonment can exacerbate preexisting mental health problems or cause new ones that may increase the risk of engaging in violence or being victimized by violence.23–27 While in prison, people may develop internal dispositions (e.g., attitudes and values) that are deeply cynical and distrustful of the justice system, making their relationship with the law more antagonistic and unstable, as well as aggressive strategies for coping with the constant threat of victimization (e.g., being hypervigilant and reacting to minor slights with force).28,29 Imprisonment may also erode social networks that support health and wellbeing and introduce obstacles (e.g., legal exclusion, social stigma) to finding housing, employment, and health care after release or encourage the formation of pro-criminal social networks.30–34
The primary objective of this study was to understand whether and how sentencing someone to prison changed the likelihood that the person would commit a future violent offense in the community. Our data and methods allowed us to identify this effect among individuals who were on the margin between prison and probation sentences (see Supplementary Methods), making this study particularly informative regarding policy questions about the likely effects of moderate changes in the use of imprisonment, particularly among those who currently receive shorter prison terms. Because prior violence has long been known to be highly predictive of future violence, we stratified analyses by whether the baseline conviction was for a violent crime.35
Although prior published studies have examined the association between imprisonment and recidivism, such studies have not focused on violence specifically, instead examining conviction for any crime.36–39 Others have examined the effects of longer vs. shorter imprisonment or prison security level on future conviction or arrest for any crime.40–43 Furthermore, much prior research on imprisonment and recidivism has been limited because unobserved individual characteristics could influence the “treatment” (imprisonment) and the outcome (violent crime), thus confounding attempts to attribute causality to imprisonment, a well-known problem with regression and matching methods that are common in this literature.44,45 The most obvious concern is that characteristics that are unobserved to the researcher that indicate someone is more likely to commit a violent act in the future are used by judges to sentence people to prison rather than probation. When these same characteristics are also correlated with future violence, failure to control for these characteristics in a regression or matching design will lead to false conclusions that prison “caused” increased violence. For instance, failure to condition on information about the crime available to the judge beyond type of crime, on individual characteristics such as education, income, or marital status, or on local area unemployment could bias estimates in regression and matching studies. Finally, both micro-and macro-level studies have generated conflicting evidence.46–49 Indeed, a 2014 report of the National Research Council concluded that, “Evidence is limited on the crime prevention effects of most of the policies that contributed to the post-1973 increase in incarceration rates,” and that, “The body of credible evidence on the effect of the experience of imprisonment on recidivism is small.” (p. 155-156)50
To overcome the problem of unobserved confounding, we used a natural experiment based on judge random assignment on a population cohort of individuals sentenced for felonies in Michigan between 2003 and 2006 and followed through June 2015 (see Supplementary Methods for a detailed discussion of assumptions required for such a natural experiment). Although this study was not the first to use such an identification strategy, prior published work has not had large enough samples with sufficient statistical power to investigate effects on specific types of crimes such as violence or to investigate effects by subgroups such as people who have committed violent and non-violent offenses, populations that are critical to both policy and theory.31,32,51 (In an unpublished study, Mueller-Smith investigated the effects of prison or jail incarceration on violence among those not previously convicted of a violent crime using a similar natural experiment in Harris County, Texas, finding null effects.) Our analysis measured arrest and conviction outcomes at one, three, and five years after sentencing and after individuals were released from prison. In all analyses, we compared people sentenced to prison to people sentenced to probation starting from sentencing. The “after-release” results thus removed any incapacitation effect of imprisonment, allowing us to examine effects of imprisonment after an individual returned to the community (see Methods on how confounding by age is removed in the analysis).
In the post-sentence risk period (which includes the effects of incapacitation), the unadjusted probability of both arrest and conviction for a violent crime were lower among those sentenced to prison compared to probation at all time points, as shown in Figure 1, Panel A (p<0.001 for all point-in-time differences; t-statistics [degrees of freedom]: Panel (1): 1yr 33.74 [63,580]; 2yr 38.09 [63,580]; 3yr 34.32 [63,580]; 4yr 30.37 [63,580]; 5yr 25.82 [63,580]; Panel (2): 1yr 15.57 [63,583]; 2yr 20.22 [63,583]; 3yr 16.58 [63,583]; 4yr 12.92 [63,583]; 5yr 9.36 [63,583]). However, when we removed incapacitation by examining the post-release risk period, the unadjusted probabilities of both arrest and conviction for a violent crime were higher among those sentenced to prison compared to probation, as shown in Figure 1, Panel B (p<0.001 for all point-in-time differences; t-statistics [degrees of freedom]: Panel (3): 5.82 [59,407]; 2yr 8.87 [58,581]; 3yr 11.89 [57,101]; 4yr 13.56 [55,414]; 5yr 13.86 [53,125]; Panel (4): 1yr 9.59 [60,877]; 2yr 13.41 [60,426]; 3yr 15.66 [59,898]; 4yr 17.83 [59,243]; 5yr 19.27 [58,272]). It was unclear whether these unadjusted outcomes reflect causal effects of imprisonment itself or systematic unobserved differences between those sentenced to prison rather than probation in underlying propensity to engage in violence, thus motivating our use of the natural experiment based on judge random assignment.
Fig. 1: Arrests and convictions for violent crime.
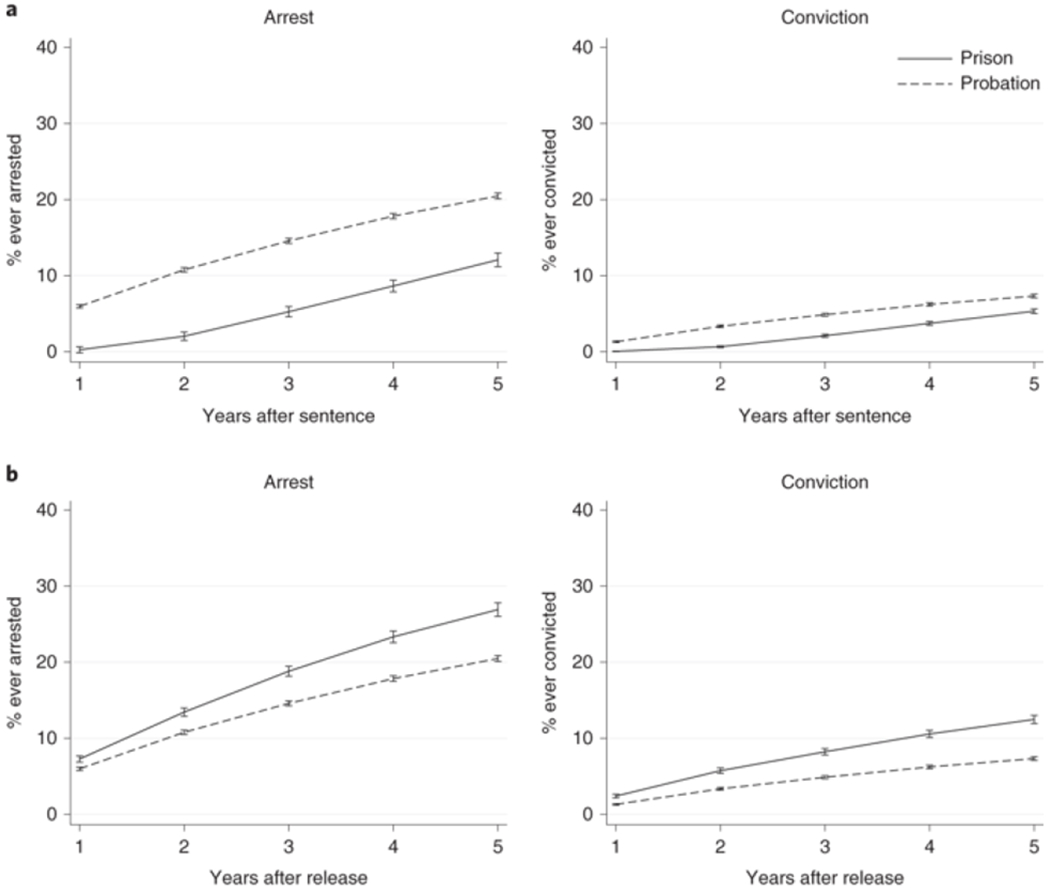
a,b, Cumulative percentages of individuals with one or more arrest (left) or conviction (right) for a violent crime during follow-up, by time since the sentence (a) and time since release (b), who received a baseline sentence of either prison or probation (unadjusted). Error bars represent 95% CIs. See Methods for definitions of risk periods, violent crimes, arrests and convictions. Sample sizes: arrest in a (all time points): prison, 19,979; probation, 43,606; conviction in a (all time points): prison, 19,977; probation, 43,605; arrest in b: 1 year: prison, 15,804; probation, 43,605; 2 years: prison, 14,978; probation, 43,605; 3 years: prison, 13,498; probation, 43,605; 4 years: prison, 11,811; probation, 43,605; 5 years: prison, 9,522; probation, 43,605; conviction in b: 1 year: prison, 17,273; probation, 43,606; 2 years: prison, 16,822; probation, 43,606; 3 years: prison, 16,294; probation, 43,606; 4 years: prison, 15,639; probation, 43,606; 5 years: prison, 14,668; probation, 43,606. Sample sizes at each time period in b vary due to differential follow-up time for time-since-release risk periods (see Methods). All point-in-time differences between prison and probation groups are statically significant at P < 0.001 (two-tailed t-tests of difference of means).
Instrumental variables estimates from two-stage least squares (2SLS) regression models of violent arrests and convictions during the post-sentence risk period, which includes incapacitation in prison, demonstrated that being sentenced to prison reduced the probability of violent arrest and felony conviction at all post-sentence time periods among those in the margin between prison and probation (Table 1; Ordinary Least Squares regression estimates in Supplementary Table 5; estimates for alternative measures of outcomes in Supplementary Table 6; full model results and model fit statistics for models in Table 1 are presented in Supplementary Table 7). For example, at five years since sentence, a prison sentence reduced the probability of arrest for a violent crime by 8.4 percentage points (unstandardized beta = −0.084; 95% CI = [−0.114, −0.054]; p < 0.001, z = −5.45) and the probability of conviction by 2.4 percentage points (unstandardized beta = −0.024; 95% CI = [−0.045, −0.003]; p = 0.026, z = −2.23). Negative post-sentence effects of imprisonment on violent outcomes were larger in absolute value for the subgroup with baseline convictions for violent offenses. For example, by five years post-sentence, imprisonment reduced the probability of a violent arrest by 16.2 percentage points (unstandardized beta = −0.162; 95% CI = [−0.201, −0.124]; p < 0.001, z = −8.26) and the probability of a violent felony conviction by 6.1 percentage points in this subgroup (unstandardized beta = −0.061; 95% CI = [−0.090, −0.032]; p < 0.001, z = −4.14). Collectively, there were relatively small reductions in violence perpetrated in the community one, three, and five years after sentencing due to incapacitation during imprisonment:5-8 percentage points on arrest and 1-4 percentage points on conviction among people with a non-violent offense at baseline and 8-16 percentage points on arrest and 2-7 percentage points on conviction among people with a baseline violent offense (unstandardized betas; all statistically significant with two-tailed test at p < 0.05 or lower; see Table 1 for exact p-values and confidence intervals).
Table 1.
Effects of prison vs. probation sentence on violent crime, by time since sentence
| Entire Sample (n=111,110) |
No Baseline Violent Offense (n = 79,337) |
Baseline Violent Offense (n = 31,762) |
|
|---|---|---|---|
|
A. Outcome: Ever Arrested for Violent Crime | |||
| 1 year since sentence | −0.072 | −0.054 | −0.081 |
| (−0.089 , −0.056) | (−0.073 , −0.035) | (−0.103 , −0.059) | |
| p<0.001 | p<0.001 | p<0.001 | |
| 3 years since sentence | −0.099 | −0.082 | −0.142 |
| (−0.125 , −0.073) | (−0.113 , −0.051) | (−0.175 , −0.109) | |
| p<0.001 | p<0.001 | p<0.001 | |
| 5 years since sentence | −0.084 | −0.046 | −0.162 |
| (−0.114 , −0.054) | (−0.081 , −0.010) | (−0.201 , −0.124) | |
| p<0.001 | p=0.013 | p<0.001 | |
| B. Outcome: Ever Convicted of Violent Crime | |||
| 1 year since sentence | −0.012 | −0.010 | −0.022 |
| (−0.021 , −0.004) | (−0.019 , −0.001) | (−0.034 , −0.010) | |
| p=0.004 | p=0.034 | p<0.001 | |
| 3 years since sentence | −0.037 | −0.039 | −0.069 |
| (−0.055 , −0.020) | (−0.058 , −0.020) | (−0.092 , −0.045) | |
| p<0.001 | p<0.001 | p<0.001 | |
| 5 years since sentence | −0.024 | −0.025 | −0.061 |
| (−0.045 , −0.003) | (−0.049 , −0.001) | (−0.090 , −0.032) | |
| p=0.026 | p=0.042 | p<0.001 | |
Each cell contains one unstandardized coefficient from a different 2-Stage Least Squares regression model, the coefficient’s 95% confidence interval, and its p-value (two tailed test). Coefficients represent the change in the probability of one or more arrests or convictions for a violent crime during follow-up due to prison vs. probation sentence at baseline, holding sentence length constant at 24 months. Full model results, model fit statistics, and coefficient z-statistics in Supplementary Table 7.
When we excluded incapacitation effects by examining the post-release risk period, our 2SLS estimates found no statistically significant effects of being sentenced to prison on violent crimes among those on the margin between prison and probation, regardless of whether the outcome was arrest or conviction and regardless of when the outcome was measured (Table 2, full model results in Supplementary Table 8). Moreover, subgroup analyses showed that the effects of imprisonment were small and non-significant across all outcomes and time periods for both those whose baseline conviction was for a violent offense and those whose baseline conviction was for a non-violent offense (all p-values 0.123 or larger from two-tailed tests, see Table 2 for exact p-values and confidence intervals).
Table 2.
Effects of prison vs. probation sentence on violent crime, by time since release
| Entire Sample |
No Baseline Violent Offense |
Baseline Violent Offense |
||||
|---|---|---|---|---|---|---|
| Prison vs. Probation Change in Probability | Sample size | Prison vs. Probation Change in Probability | Sample size | Prison vs. Probation Change in Probability | Sample size | |
| A. Outcome: Ever Arrested for Violent Crime | ||||||
| 1 year since release | −0.005 | 106,926 | −0.008 | 78,856 | −0.013 | 28,070 |
| (−0.025 , 0.014) | (−0.033 , 0.018) | (−0.041 , 0.015) | ||||
| p=0.591 | p=0.547 | p=0.350 | ||||
| 3 years since release | 0.006 | 104,605 | −0.003 | 78,425 | −0.020 | 26,180 |
| (−0.024 , 0.035) | (−0.041 , 0.036) | (−0.062 , 0.021) | ||||
| p=0.706 | p=0.888 | p=0.337 | ||||
| 5 years since release | 0.012 | 100,445 | 0.036 | 76,748 | −0.042 | 23,697 |
| (−0.028 , 0.053) | (−0.017 , 0.089) | (−0.094 , 0.010) | ||||
| p=0.545 | p=0.180 | p=0.116 | ||||
| B. Outcome: Ever Convicted of Violent Crime | ||||||
| 1 year since release | 0.001 | 108,404 | 0.006 | 79,094 | −0.005 | 29,310 |
| (−0.010 , 0.012) | (−0.007 , 0.019) | (−0.022 , 0.012) | ||||
| p=0.822 | p=0.380 | p=0.557 | ||||
| 3 years since release | 0.004 | 107,425 | −0.003 | 78,949 | −0.023 | 28,476 |
| (−0.015 , 0.024) | (−0.026 , 0.021) | (−0.052 , 0.006) | ||||
| p=0.655 | p=0.832 | p=0.123 | ||||
| 5 years since release | 0.017 | 105,799 | 0.002 | 78,667 | −0.017 | 27,132 |
| (−0.007 , 0.040) | (−0.027 , 0.032) | (−0.051 , 0.017) | ||||
| p=0.157 | p=0.870 | p=0.339 | ||||
Each cell contains one unstandardized coefficient from a different 2-Stage Least Squares regression model, the coefficient’s 95% confidence interval, and its p-value (two tailed test). Coefficients represent the change in the probability of one or more arrests or convictions for a violent crime during follow-up due to prison vs. probation sentence at baseline, holding sentence length constant at 24 months. Full model results, model fit statistics, and coefficient z-statistics in Supplementary Table 8.
Interpreting post-release imprisonment effects requires considering the frequency of future imprisonment because future imprisonment may reduce post-release violence through a “secondary” incapacitation effect. People sentenced to prison were more likely to be subject to secondary incapacitation, meaning that they were at greater risk than people sentenced to probation of being sent to prison later due to technical violations of parole or probation. In supplemental analyses (Supplementary Table 6), we found that being sentenced to prison increased the probability of future imprisonment within five years by almost 20 percentage points among people with a non-violent offense (unstandardized beta = 0.195; 95% CI = [0.152, 0.238]; p < 0.001, z = 8.81) and almost 15 percentage points among people with a violent offense (unstandardized beta = 0.145; 95% CI = [0.102, 0.188]; p < 0.001, z = 6.58). The vast majority of this increase in prison admissions was due to technical violations, as there was no effect of imprisonment on new felony convictions for violent crimes that resulted in a new prison sentence among either group (baseline non-violent offense: unstandardized beta = 0.025; 95% CI = [−0.004 , 0.055]; p = 0.090, z = 1.69; baseline violent offense: unstandardized beta = −0.014; 95% CI = [−0.042 , 0.014]; p = 0.335, z = −0.97).
Therefore, it is possible that prison sentences increased the underlying propensity for post-release violent crime, but that these effects were not observed due to subsequent additional prison time resulting from admissions to prison for technical violations. Alternatively, it is also possible that individuals returned to prison for technical violations would not have committed violent crimes had they remained in the community. Under the first scenario, imprisonment increased post-release violence. Under the second scenario, imprisonment had no net effect, either positive or negative, on post-release violence. Thus, under either assumption, imprisonment did not prevent post-release violence in the community.
We note the limitations of this study. First, our results came from a single US state and may not be generalizable to other states or countries with different criminal justice practices and social and economic conditions. As we noted in 52, “Michigan is characterized by high unemployment, by declining opportunities for employment in low skill occupations, and by high rates of racial and economic residential segregation.” The proportion of those convicted of felonies who were sentenced to prison is lower in our Michigan sample than the average for state felonies in 2006 (18% vs. 41%), suggesting that those on the sentencing margin in Michigan may have longer criminal records or have committed more serious crimes. However, Michigan’s mean time served in prison is only slightly higher than the national average for state prison time served (59 months vs. 53 months).53 As we noted in 54, “Compared to state corrections practices across the nation in the same time period, Michigan’s rates of probation revocations to incarceration were slightly lower than national averages while its rates of parole revocations to prison were much lower than national averages. In 2007, Michigan’s probation revocation rate was 0.5% while the national average was 2%, and Michigan’s parole revocation rate was 6.6% while the national average was 11.4%.”
Second, we could only examine violence detected by law enforcement and, for convictions, only felony convictions (although our arrest outcome included misdemeanor arrests). Third, we focused specifically on violence in the community and did not consider violence in prison, which only rarely leads to arrest or prosecution and was therefore not reliably measured in our data. Fourth, analyses conducted since release had two potential sources of bias. One is that release dates could have been determined in part by prison behavior. The other is that starting the risk period at release shortened the follow-up period for those sentenced to prison, so those with longer prison sentences did not have post-release outcomes to measure, potentially introducing sample selection bias. Overall, 15.5%, 21.3%, and 33.1% of individuals sentenced to prison were not released in time to measure outcomes one, three, and five years following release, respectively.
Finally, our estimated effects are “local average treatment effects,” meaning we estimated the effect of incarceration in prison vs. probation among individuals for whom the randomly assigned judge made the difference between prison and probation, rather than all individuals sentenced to prison in Michigan (for further discussion, see Supplementary Methods). In other words, individuals who would have been sentenced to prison by all judges or to probation by all judges did not inform the causal estimates we present. This means that the incapacitation and post-release effects we estimated could be larger or smaller for the entire set of individuals sentenced to prison. However, this also means that our estimates are applicable to individuals on the policy margin, those who would likely be impacted by changes in policy that increase or decrease the use of imprisonment. We also note that any natural experiment will estimate local average treatment effects, and this is likely the best identification strategy possible given the practical and ethical challenges of doing a true randomized experiment in criminal sentencing in a broad and diverse sample similar to our sample, which covers an entire large state over multiple years.
An assessment of the magnitude of the incapacitation effect of imprisonment on violence in the community can be provided by comparing the number of crimes prevented via imprisonment estimated based on the arrest effect sizes in Table 1 to the average yearly total number of violent crimes reported to police in Michigan.55 If we make the simplifying assumption that the effect sizes at one year follow-up apply to all individuals sentenced to prison in Michigan, then the violence reduction would equal 1,438 crimes (19,979 times 0.072). This represents just 2.7 percent of 53,145 “index” violent crimes recorded by the Michigan State Police on average per year between 2003 and 2006 (index crimes include murder and non-negligent manslaughter, rape, robbery, and aggravated assault). Alternatively, using a more expansive definition of violent crimes, including simple assault, weapons offenses, all other sex offenses, and negligent manslaughter, this represents just 0.7 percent of the 196,502 average number of yearly violent crimes in the state. These calculations suggest that the estimated number of violent crimes prevented by imprisonment is small relative to the total amount of violent crime in the state.
With regard to policy implications, prison’s incapacitation effects should be considered in relation to alternative interventions for preventing violence. For example, changes in policing practices and laws governing access to firearms in the United States have been implicated in substantial reductions in firearm deaths, as have violence interrupter interventions.56–58 Compared with these interventions, imprisonment has higher costs and greater potential for negative collateral consequences. Prior research on the consequences of imprisonment has documented the effects of imprisonment on individual morbidity and mortality, both during imprisonment and after release, and on the secondary effects of imprisonment on children, partners, and family members, although not all studies consistently show negative collateral consequences.23,59–67 Our results suggest that imprisoning fewer people for violent offenses on the margin between prison and probation would have relatively small effects on violence in the community, and that alternative policies and interventions to prevent violence may show greater benefit at reduced social and economic costs.
Methods
This study used a natural experiment within a longitudinal cohort design, following the population of individuals sentenced for felonies in the state of Michigan, USA between 2003 and 2006 and tracking their arrests and convictions for violent crimes through June 2015 (n=111,110). The natural experiment is that Michigan courts randomly assign judges to criminal cases via a random number generator on a court computer, which provides a source of sentencing variation (Supplementary Figure 1, Supplementary Table 2) that is independent of the characteristics of the person being sentenced (Supplementary Table 3). To estimate the effects of being sentenced to prison vs. probation on future violence we used two-stage least squares (2SLS) regression models with randomly assigned judges as the instrumental variables.68,69 Thus, the causal effects were estimated using only the variation in sentencing produced through random judge assignment, under the assumption that the random assignment was independent of unobserved causes of the outcome (see Instrumental Variables Assumptions in Supplementary Methods).
From administrative databases at the Michigan Department of Corrections (MDOC), we extracted data on dates of all felony convictions and whether they were violent or non-violent, identifiers for assigned judges, start and end dates of imprisonment spells, and pre-sentence covariates (see Supplementary Methods). Sample exclusions were documented in Supplementary Figure 2. We excluded individuals for whom judges had no discretion in sentencing or judges were not randomly assigned: individuals sentenced for first-degree murder or for which the minimum sentence was set by statute (mostly felony firearm crimes), those whose cases were handled by specialty courts, individuals in counties with only one judge, individuals assigned to judges that presided over less than 100 cases, and individuals sentenced only to fines or community supervision (pre-exclusion sample size: 144,272; post-exclusion sample size: 110,100). We used matched records from the Michigan State Police to track arrests.
Felony convictions were classified as violent based on “person” crimes in the Warrant Manual authored by the Prosecuting Attorneys Association of Michigan. We used matched records from the Michigan State Police to identify the dates and types of subsequent arrests. Arrests were classified as violent based on National Crime Information Center codes for homicide (900), kidnapping (1000), sexual assault (1100), robbery (1200), assault (1300), other sex offenses (3600), and weapons offenses (5200). The baseline date was the first felony conviction after January 1, 2003. The most common baseline crimes classified as violent among those sentenced to prison and probation are provided in Supplementary Table 4 and were similar though not identical across the two groups.
Participants were followed from the baseline felony sentence through June 2015. Our outcomes were arrest or conviction for a violent crime which occurred in the community. Both outcomes were of interest because arrest captures a greater number of violent acts (including misdemeanors such as simple assault), whether or not they resulted in felony charges or convictions, but felony conviction includes acts for which the individual has been adjudicated guilty in court. Information on covariates and their descriptive statistics is available in the Supplementary Information.
The outcomes were violent crimes at intervals of one, three, and five years after the start of the risk period, using two different approaches for determining when the risk period began. Probationers were at-risk for violent behavior in the community immediately following sentencing, but prisoners were not at-risk until their first release. One policy effect of interest was the total effect of imprisonment, which includes the effect of incapacitation while imprisoned. The effects of imprisonment estimated under this approach included incapacitation because one cannot commit a violent crime in the community when one is in prison. This effect was captured by starting the risk period at the sentence date for all subjects. Any effects of sentencing reform for the marginal prisoner would be estimated using this risk period, referred to as “post-sentence.”
The other risk period starts prisoners at release. Under this approach, the risk period began on the date of release from the first imprisonment associated with the baseline sentence to prison (hereafter, “post-release”), so that the estimated effects of imprisonment do not include incapacitation. For the group sentenced to probation, the second risk period began at the date of sentencing to probation, even if the individual had subsequent periods of imprisonment. Prisoners and probationers sentenced in the same year started their risk periods in different years, so differences in sentence could be conflated with the passage of time, which itself can affect violence through either period effects or age effects. Because we wanted to assess the incapacitation mechanism and its contribution to the overall effect, we conducted our analysis both ways.
To address confounding with age and period, we constructed residualized versions of all outcomes on the entire sample by age and year. These measures are derived from ordinary least squares regression models for each outcome that included only dummies for age and year as predictors. We used the residuals from these models as our outcomes in the main analyses. Such residualized outcomes are therefore independent of age and year.
The methods for this work were originally presented in ref 70 and are reproduced here with permission. Although our interest in this paper was the comparison between prison and probation sentences, there were multiple dimensions to felony sentencing that needed be taken into account in the modeling strategy. One was that there were other possible sentences besides prison and probation, including jail and jail followed by probation. Second, a judge must decide on the minimum sentence length in months for probation and prison sentences (the maximum sentence length is set by statute based on the specific crime) or the jail sentence length in the event of a jail sentence. Failure to properly condition on these other aspects of sentencing could have led to biased estimates because other aspects of sentencing were affected by the judge who is assigned (the instrument) and also had the potential to affect the outcome, so omitting them from the model could have led to a violation of the exclusion restriction (see Supplementary Methods). Although we included individuals with jail and probation with jail sentences in the analysis to avoid introducing sample selection bias, we focused on prison vs. probation because it provided a comparison between incarceration and no incarceration.
Our “second stage” model included a set of three binary treatment variables for prison, jail, and jail with probation sentences, with probation as the omitted reference category. The model also included interactions between prison and prison sentence length, probation and probation sentence length, jail with probation and probation sentence length, and jail with jail sentence length. All sentence length variables were specified with quadratic functional form. We did not include the interaction between jail with probation and jail sentence length because jail sentence lengths that accompany jail with probation sentences exhibited little variation and were generally only a few months. We instrumented for the three sentence type treatments (prison, jail, jail with probation) and the three sentence length treatments (prison sentence length, probation sentence length, jail sentence length) using the set of all judge dummy variables and their interactions with the pre-sentence characteristics in Supplementary Table 1, resulting in six “first-stage” equations. All first stage models and the second stage model also conditioned on the main effects of the pre-sentence characteristics and county fixed effects (county dummy variables). The county fixed effects were necessary because judges were randomly assigned within counties. They also served to control for mean county differences in sentencing practices and outcomes. Prison and probation sentence length variables were centered at 24 months (the modal sentence length for both sentence types), so coefficients on the prison dummy variable were interpretable as the effect of a 24-month prison sentence compared to a 24-month probation sentence. Both first and second stage models were estimated using Ordinary Least Squares (OLS) regression, as is conventional in the econometrics literature, although we did replicate our results using binary probit models as well.68 Models were estimated using the ivregress and ivprobit routines in Stata version 14.
This study was reviewed and approved by the Health Sciences and Behavioral Sciences Institutional Review Board at the University of Michigan (FWA00004969) under Study ID HUM00046081. A waiver of informed consent was granted to this study due to the anonymized nature of the data and the number of subjects, which precluded individual consent.
Supplementary Material
Acknowledgments
This study was funded by grants from the National Science Foundation (SES1061018) and the Eunice Kennedy Shriver National Institute of Child Health and Human Development (R01 HD079467), with additional support from center grants from the Eunice Kennedy Shriver National Institute of Child Health and Human Development to the Population Studies Centers at the University of Michigan (R24 HD041028) and at UC Berkeley (R24 HD073964). The funders had no role in study design, data collection and analysis, decision to publish or preparation of the manuscript. We thank Charley Chilcote and Paulette Hatchett at the Michigan Department of Corrections for facilitating access to the data and for advice on their use.
Footnotes
Data availability
Access to the data used in this paper was granted without permission for pubic distribution. The data can be requested directly from the Michigan Department of Corrections, Office of Research and Planning, 206 E. Michigan Ave., Grandview Plaza, PO Box 30003, Lansing, MI 48909, USA.
Competing Interests
The authors declare no competing interests.
Contributor Information
David J Harding, Department of Sociology and Social Sciences D-Lab, University of California – Berkeley, Berkeley CA 94720 USA.
Jeffrey D Morenoff, Department of Sociology and Institute for Social Research, University of Michigan, Ann Arbor MI 48106 USA.
Anh P Nguyen, Institute for Health Research, Kaiser Permanente Colorado, Aurora CO 80014 USA.
Shawn D Bushway, Department of Public Administration and Policy, Rockefeller College of Public Affairs and Policy, University at Albany, State University of New York, Albany NY 12203 USA.
Ingrid A Binswanger, Institute for Health Research, Kaiser Permanente Colorado, Aurora CO 80014 USA and Division of General Internal Medicine, Department of Medicine, University of Colorado School of Medicine, Aurora, CO USA.
References:
- 1.MacCormick A The Prison’s Role in Crime Prevention. J. Crim. Law Criminol. 41, 36–48 (1950). [Google Scholar]
- 2.Council, N. R. The Growth of Incarceration in the United States: Exploring Causes and Consequences. Committee on Causes and Consequences of High Rates of Incarceration. (National Academies Press, 2014). [Google Scholar]
- 3.Koop C & GD L Violence in america: A public health emergency: time to bite the bullet back. JAMA 267, 3075–3076 (1992). [PubMed] [Google Scholar]
- 4.Mercy JA, Rosenberg ML, Powell KE, Broome CV & Roper WL Public health policy for preventing violence. Heal. Aff. 12, 7–29 (1993). [DOI] [PubMed] [Google Scholar]
- 5.Krug EG, Dahlberg LL, Mercy JA, Zwi AB & Lozano R World report on violence and health. (2002). [DOI] [PubMed]
- 6.Thompson D Community Violence as a Population Health Issue. (National Academy of Sciences, 2016). doi: 10.17226/23668 [DOI] [Google Scholar]
- 7.Corso PS, Mercy JA, Simon TR, Finkelstein EA & Miller TR Medical Costs and Productivity Losses Due to Interpersonal and Self-Directed Violence in the United States. Am. J. Prev. Med. 32, 474–482 (2007). [DOI] [PubMed] [Google Scholar]
- 8.Sharkey PT, Tirado-Strayer N, Papachristos AV & Raver CC The effect of local violence on children’s attention and impulse control. Am. J. Public Health 102, 2287–2293 (2012). [DOI] [PMC free article] [PubMed] [Google Scholar]
- 9.Zimmerman GM & Posick C Risk Factors for and Behavioral Consequences of Direct Versus Indirect Exposure to Violence. Am. J. Public Health 106, 178–188 (2015). [DOI] [PMC free article] [PubMed] [Google Scholar]
- 10.Sampson RJ, Morenoff JD & Raudenbush S Social Anatomy of Racial and Ethnic Disparities in Violence. Am. J. Public Health 95, 224–232 (2005). [DOI] [PMC free article] [PubMed] [Google Scholar]
- 11.Parker KF & Stansfield R The Changing Urban Landscape: Interconnections Between Racial/Ethnic Segregation and Exposure in the Study of Race-Specific Violence Over Time. Am. J. Public Health 105, 1796–1805 (2015). [DOI] [PMC free article] [PubMed] [Google Scholar]
- 12.Rockett IRH et al. Leading causes of unintentional and intentional injury mortality: United States, 2000–2009. Am. J. Public Health 102, 84–92 (2012). [DOI] [PMC free article] [PubMed] [Google Scholar]
- 13.Western B Punishment and Inequality in America. (Russell Sage, 2006). [Google Scholar]
- 14.Garland D The culture of control: crime and social order in contemporary society. (Oxford University Press, 2001). [Google Scholar]
- 15.Weaver VM Frontlash: Race and the Development of Punitive Crime Policy. Stud. Am. Polit. Dev. 21, 230–265 (2007). [Google Scholar]
- 16.Western B Punishment and Inequality in America. (Russell Sage Foundation, 2006). [Google Scholar]
- 17.National Research Council. The Growth of Incarceration in the United States: Exploring Causes and Consequences. (The National Academies Press, 2014). [Google Scholar]
- 18.Alexander M The New Jim Crow: Mass Incarceration in the Age of Colorblindness. (New Press, 2010). [Google Scholar]
- 19.Austin J, Eisen L-B, Cullen J & Frank J How Many Americans are Unnecessarily Incarcerated? (2016).
- 20.Gottschalk M Caught: The Prison State and the Lockdown of American Politics. (Princeton University Press, 2016). [Google Scholar]
- 21.Bushway SD & Paternoster R The Impact of Prison on Crime in Do Prisons Make Us Safer? The Benefits and Costs of the Prison Boom (eds. Raphael S & Stoll MA) 119–150 (Russell Sage Foundation, 2009). [Google Scholar]
- 22.Nagin DS, Cullen FT & Jonson CL Imprisonment and Reoffending. Crime and Justice: A Review of Research 38, 115–200 (2009). [Google Scholar]
- 23.Dumont DM, Brockmann B, Dickman S, Alexander N & Rich JD Public health and the epidemic of incarceration. Annu. Rev. Public Health 33, 325–39 (2012). [DOI] [PMC free article] [PubMed] [Google Scholar]
- 24.Schnittker J, Massoglia M & Uggen C Out and Down: Incarceration and Psychiatric Disorders. J. Health Soc. Behav. 53, 448–464 (2012). [DOI] [PubMed] [Google Scholar]
- 25.Schnittker J & John A Enduring stigma: The long-term effects of incarceration on health. J. Health Soc. Behav. 48, 115–130 (2007). [DOI] [PubMed] [Google Scholar]
- 26.Swanson JW, McGinty EE, Fazel S & Mays VM Mental illness and reduction of gun violence and suicide: Bringing epidemiologic research to policy. Ann. Epidemiol. 25, 366–376 (2015). [DOI] [PMC free article] [PubMed] [Google Scholar]
- 27.Caputo-Levine DD The yard face: The contributions of inmate interpersonal violence to the carceral habitus. Ethnography 14, 165–185 (2013). [Google Scholar]
- 28.Sampson RJ & Bartusch DJ Legal cynicism and (subcultural?) Tolerance of deviance: The neighborhood context of racial differences. Law Soc. Rev. 32, 777–804 (1998). [Google Scholar]
- 29.Trinkner R & Tyler TR Legal Socialization: Coercion versus Consent in an Era of Mistrust. Annu. Rev. Law Soc. Sci 12, 417–39 (2016). [Google Scholar]
- 30.Pager D Marked: Race, crime, and finding work in an era of mass incarceration. (University of Chicago Press, 2007). [Google Scholar]
- 31.Kling JR Incarceration length, employment, and earnings. Am. Econ. Rev. 96, 863–876 (2006). [Google Scholar]
- 32.Loeffler CE Does Imprisonment Alter the Life Course? Evidence on Crime and Employment from a Natural Experiment. Criminology 51, 137–166 (2013). [Google Scholar]
- 33.Granovetter MS The Strength of Weak Ties. Am. J. Sociol. 78, 1360–1380 (1973). [Google Scholar]
- 34.Tyler JH & Kling JR Prison-Based Education and Reentry into the Mainstream Labor Market in Barriers to Reentry?: The Labor Market for Released Prisoners in Post-Industrial America (eds. Bushway S, Stoll MA & Weiman DF) (2007). [Google Scholar]
- 35.Mossman D Assessing Predictions of Violence: Being Accurate About Accuracy. J. Consult. Clin. Psychol. 62, 783–792 (1994). [DOI] [PubMed] [Google Scholar]
- 36.Mitchell O, Cochran JC, Mears DP & Bales WD Examining Prison Effects on Recidivism: A Regression Discontinuity Approach. Justice Q. 34, 571–596 (2017). [Google Scholar]
- 37.Jolliffe D & Hedderman C Investigating the impact of custody on reoffending using propensity score matching. Crime Delinq. 61, 1051–1077 (2015). [Google Scholar]
- 38.Cochran JC, Mears DP & Bales WD Assessing the Effectiveness of Correctional Sanctions. Journal of Quantitative Criminology 30, (2014). [Google Scholar]
- 39.Bales WD & Piquero AR Assessing the impact of imprisonment on recidivism. J. Exp. Criminol. 8, 71–101 (2012). [Google Scholar]
- 40.Rydberg J & Clark K Variation in the incarceration length-recidivism dose-response relationship. J. Crim. Justice 46, 118–128 (2016). [Google Scholar]
- 41.Meade B, Steiner B, Makarios M & Travis L Estimating a Dose-Response Relationship Between Time Served in Prison and Recidivism. J. Res. Crime Delinq. 50, 525–550 (2013). [Google Scholar]
- 42.Loughran TA et al. Estimating a dose-response relationship between length of stay and future recidivism in serious juvenile offenders. Criminology 47, 699–740 (2009). [DOI] [PMC free article] [PubMed] [Google Scholar]
- 43.Chen MK & Shapiro JM Do harsher prison conditions reduce recidivism? A discontinuity-based approach. Am. Law Econ. Rev. 9, 1–29 (2007). [Google Scholar]
- 44.Smith A, Todd J&E, P. Does matching overcome LaLonde’s critique of nonexperimental estimators? J. Econom. 125, 305–353 (2005). [Google Scholar]
- 45.LaLonde R Evaluating the econometric evaluations of training programs with experimental data. Am. Econ. Rev. 76, 604–620 (1986). [Google Scholar]
- 46.Reiss AJJ & Roth JA Understanding and Controlling Violence. Report of the National Academy of Sciences Panel on the Understanding and Control of Violence. (National Academy Press, 1993). [Google Scholar]
- 47.Levitt SD The Effect of Prison Population Size on Crime Rates : Evidence from Prison Oercrowding Litigation. Q. J. Econ. 111, 319–351 (1996). [Google Scholar]
- 48.Aizer A, Doyle JJ Juvenile incarceration, human capital, and future crime: Evidence from randomly assigned judges. Q. J. Econ. 130, 759–803 (2015). [Google Scholar]
- 49.Lofstrom M, Raphael S Realignment, incarceration, and crime trends in California. Public Policy Inst. Calif. (2015). [Google Scholar]
- 50.National Research Council. The Growth of Incarceration in the United States: Exploring Causes and Consequences. Committee on Causes and Consequences of High Rates of Incarceration (The National Academies Press, 2014). [Google Scholar]
- 51.Green DP & Winik D Using Random Judge Assignments to Estimate the Effects of Incarceration and Probation on Recidivism Among Drug Offenders. Criminology 48, 357–387 (2010). [Google Scholar]
- 52.Harding DJ, Morenoff JD & Herbert CW Home is Hard to Find: Neighborhoods, Institutions, and the Residential Trajectories of Returning Prisoners. Ann. Am. Acad. Pol. Soc. Sci. 647, 214–236 (2013). [DOI] [PMC free article] [PubMed] [Google Scholar]
- 53.Sourcebook of Criminal Justice Statistics. (University at Albany, 2018). [Google Scholar]
- 54.Harding DJ, Morenoff JD, Nguyen AP & Bushway SD Short- and long-term effects of imprisonment on future felony convictions and prison admissions. Proc. Natl. Acad. Sci. 114, 11103–11108 (2017). [DOI] [PMC free article] [PubMed] [Google Scholar]
- 55.Michigan State Police. 1997-2006 Crime Statistics, State Totals. Available at: https://www.michigan.gov/msp/0,4643,7-123-1586_3501_4621-25744--,00.html. (Accessed: 22nd November 2018)
- 56.Chapman S, Alpers P & Jones M Association between gun law reforms and intentional firearm deaths in australia, 1979-2013. JAMA 316, 291–299 (2016). [DOI] [PubMed] [Google Scholar]
- 57.Wintemute GJ The future of firearm violence prevention: Building on success. JAMA 282, 475–478 (1999). [DOI] [PubMed] [Google Scholar]
- 58.Santilli A et al. Bridging the Response to Mass Shootings and Urban Violence: Exposure to Violence in New Haven, Connecticut. Am. J. Public Health 107, 374–379 (2017). [DOI] [PMC free article] [PubMed] [Google Scholar]
- 59.Comfort M Punishment beyond the legal offender. Annu. Rev. Law Soc. Sci. 3, 271–296 (2007). [Google Scholar]
- 60.Wildeman C & Muller C Mass Imprisonment and Inequality in Health and Family Life. Annu. Rev. Law Soc. Sci. 8, 11–30 (2012). [Google Scholar]
- 61.Massoglia M & Pridemore WA Incarceration and Health. Annu. Rev. Sociol. 41, 291–310 (2015). [DOI] [PMC free article] [PubMed] [Google Scholar]
- 62.Schnittker J, Massoglia M & Uggen C Incarceration and the Health of the African American Community. DuBois Rev. 8, 1–9 (2011). [Google Scholar]
- 63.Patterson EJ The Dose–Response of Time Served in Prison on Mortality: New York State, 1989–2003. Am. J. Public Health 103, 523–528 (2013). [DOI] [PMC free article] [PubMed] [Google Scholar]
- 64.Lee H, Wildeman C, Wang EA, Matusko N & Jackson JS A heavy burden: The cardiovascular health consequences of having a family member incarcerated. Am. J. Public Health 104, 421–427 (2014). [DOI] [PMC free article] [PubMed] [Google Scholar]
- 65.Wildeman C, Andersen SH, Lee H & Karlson KB Parental incarceration and child mortality in Denmark. Am. J. Public Health 104, 428–433 (2014). [DOI] [PMC free article] [PubMed] [Google Scholar]
- 66.Turney K & Wildeman C Redefining Relationships Explaining the Countervailing Consequences of Paternal Incarceration for Parenting. Am. Sociol. Rev. 78, 949–979 (2013). [Google Scholar]
- 67.Bhuller M, Dahl GB, Løken KV & Mogstad M Incarceration Spillovers in Criminal and Family Networks. Natl. Bur. Econ. Res. Work. Pap. Ser No. 24878, (2018). [Google Scholar]
- 68.Angrist JD & Pischke J-S Mostly Harmless Econometrics: An Empiricist’s Companion. (Princeton University Press, 2009). [Google Scholar]
- 69.Newhouse JP & McClellan M ECONOMETRICS IN OUTCOMES RESEARCH: The Use of Instrumental Variables. Annu. Rev. Public Health 19, 17–34 (1998). [DOI] [PubMed] [Google Scholar]
- 70.Harding DJ, Morenoff JD, Nguyen AP & Bushway SD Imprisonment and Labor Market Outcomes: Evidence from a Natural Experiment. Am. J. Sociol. 124, 49–110 (2018). [Google Scholar]
Associated Data
This section collects any data citations, data availability statements, or supplementary materials included in this article.