Abstract
Efficient H2O2 electrogeneration from 2-electron oxygen reduction reaction (ORR) represents an important challenge for environmental remediation application. H2O2 production is determined by 2-electron ORR as well as H2O2 decomposition. In this work, a novel strategy based on the systematical investigation on H2O2 decomposition pathways was reported, presenting a drastically improved bulk H2O2 concentration. Results showed that bulk phase disproportion, cathodic reduction, and anodic oxidation all contributed to H2O2 depletion. To decrease the extent of H2O2 cathodic reduction, the pulsed current was applied and proved to be highly effective to lower the extent of H2O2 electroreduction. A systematic study of various pulsed current parameters showed that H2O2 concentration was significantly enhanced by 61.6% under pulsed current of “2s ON + 2s OFF” than constant current. A mechanism was proposed that under pulsed current, less H2O2 molecules were electroreduced when they diffused from the porous cathode to the bulk electrolyte. Further results demonstrated that a proper pulse frequency was necessary to achieve a higher H2O2 production. Finally, this strategy was applied to Electro-Fenton (EF) process with ibuprofen as model pollutant. 75.0% and 34.1% ibuprofen were removed under pulsed and constant current at 10 min, respectively. The result was in consistent with the higher H2O2 and ·OH production in EF under pulsed current. This work poses a potential approach to drastically enhance H2O2 production for improved EF performance on organic pollutants degradation without making any changes to the system except for power mode.
Keywords: Hydrogen peroxide, Electro-Fenton, Oxygen reduction reaction, Pulsed current, Ibuprofen
1. Introduction
The Electro-Fenton (EF) process is an advanced oxidation process commonly used for water remediation. It was developed by Brilla’s group and Oturan’s group since the 2000s [1][2]. One of the key features of EF process is that H2O2 is electrogenerated on the cathode by O2 reduction reaction. The H2O2 generation rate is one of the most crucial parameters of process efficiency since the rate of Fenton’s reaction is predominantly determined by this parameter [3][4]. Therefore, many research has been focusing on the design of cathode materials [5][6][7] and its modification [8][9][10][11], cell configuration [12][13], as well as operation parameters optimization [12][14], to achieve a higher concentration of H2O2 in bulk electrolyte. However, few works are focused on H2O2 decomposition pathways. As many studies reported [6][7][11][12], H2O2 decomposition can result in yield loss and lower current efficiency, it is therefore essential to enhance the understanding of different decomposition pathways and factors affecting these reactions, which may provide a new strategy for enhanced H2O2 electrogeneration and improved EF performance.
The H2O2 concentration in bulk electrolyte measured by various techniques (e.g. titration, spectrophotometry) is accumulative concentration, which is the total H2O2 generated minus the decomposition of H2O2 (Eq. 1). Oturan et al. [15] suggested that some H2O2 is electrochemically reduced at the cathode surface and to a much lesser extent, disproportion in bulk. H2O2 is also oxidized to O2 at the anode via HO2• as an intermediate. Consequently, the accumulation of H2O2 is lower than its electrogeneration. Another work from Oturan et al. [3] reported that H2O2 could be destroyed by parasitic chemical decomposition, cathodic reduction (divided cell), or anodic oxidation (undivided cell), resulting in a slower accumulation in the bulk and current efficiency of H2O2 production. Bard et al. [16] reported that H2O2 is formed by “2-electron” pathway, can thereafter be reduced to H2O. It can also be re-oxidized to oxygen or be transported to the bulk. Moreover, it can disproportionate into H2O and O2 in a non-electrochemical bimolecular reaction.
| (1) |
Based on aforementioned published works, we summarized the generation and decomposition pathways of H2O2 in Tab. 1. In EF process, H2O2 is generated by 2-electron ORR pathway on cathode [17][18]. Then H2O2 partially decompose via electroreduction pathway, disproportion pathway, and anodic oxidation pathway. The most important feature of this process is that there is a significant step in which the electrogenerated H2O2 molecules diffuse from the cathode (both surface and inside) to bulk electrolyte [19][20].
Tab. 1.
Proposed H2O2 reaction pathways based on literature.
| Reaction and Position | Equation | References | No. | |
|---|---|---|---|---|
| H2O2 generation (2 electron O2 reduction) | Cathode surface and inside | O2(g) + 2 H+ + 2 e− → H2O2 | Bard et al., 2009[16] Oturan et al., 2014[15] Oturan et al., 2014[3] |
(2) |
| Disproportion of H2O2* | Cathode surface and inside | 2 H2O2 → O2(g) + 2 H2O | Oturan et al., 2014[3] Bard et al., 2009[16] |
(3) |
| Cathodic reduction of H2O2 | Cathode surface and inside | H2O2 + 2 H+ + 2 e− → 2 H2O | Oturan et al., 2014[3] Bard et al., 2009[16] |
(4) |
| Anodic oxidation of H2O2 | Anode surface | H2O2 → HO2· + H+ + e− HO2· → O2(g) + H+ + e− |
Oturan et al., 2014[15] Oturan et al., 2014[3] |
(5) (6) |
| Disproportion of H2O2 | Bulk electrolyte | 2 H2O2 → O2(g) + 2 H2O | Oturan et al., 2014[15] | (7) |
Note:
H2O2 disproportion occurred at cathode surface and inside would produce O2, which was used to generate H2O2 again. This process is different from disproportion take place in bulk electrolyte.
However, electrogeneration and decomposition of H2O2 occur at several sites (cathode surface and inside, bulk electrolyte, anode vicinity) simultaneously, making it difficult to study. Many previous works that enhance H2O2 generation [5][10][21] inevitably couple the two processes, in which H2O2 decomposition varies under different operating parameters or by different electrodes. Hence, two important questions arose: (1) How to decouple different decomposition pathways and investigate the influence of key parameters on these reactions; (2) how to reduce the extent of decomposition pathways and obtain a higher H2O2 concentration in bulk electrolyte?
2-electron ORR is closely related to cathode materials as well as applied cathodic voltage [22]. Many porous carbonaceous materials and the properly applied current have been implemented since this reaction is the prerequisite to achieve a high yield of H2O2. H2O2 electroreduction co-occurs with 2-electron ORR; the extent of H2O2 electroreduction is lower so that H2O2 molecules generated by 2-electron ORR can partially diffuse to bulk before being electroreduced to H2O. The key feature of H2O2 electroreduction pathway is that it is closely relevant to diffusion length and electricity, making it possible to reduce the extent of H2O2 electroreduction pathway by decreasing the thickness of porous cathode or applying pulsed current. Once H2O2 generated from 2-electron ORR has some time to diffuse to bulk without current during a particular time, it is reasonable to hypothesize that more H2O2 molecules could be obtained in bulk. H2O2 disproportion in cathode vicinity is a non-electrochemical bimolecular reaction [3][16], we assume that its extent can also be reduced by applying pulsed current as H2O2 concentration inside porous cathode decreased. H2O2 disproportion in bulk electrolytes is influenced by current crossing bulk electrolyte and concentration of the electrolyte. H2O2 anodic oxidation is majorly determined by applied current and cell configuration [23]. Therefore, we assume that the extent of H2O2 disproportion in bulk electrolytes and H2O2 anodic oxidation pathway cannot be reduced in a certain system.
Ibuprofen, a nonsteroidal anti-inflammatory drug, was frequently detected in the aquatic environment. It can pose a considerable threat to human health and potential long-term adverse effects on ecosystem [24][25][26]. Thus, it was chosen as the target contaminant. The aims of this study were to (1) investigate several H2O2 decomposition pathways in a decoupling way; (2) verify the feasibility of pulsed current on decreased extent of H2O2 electroreduction pathway; (3) systematically study the pulsed current parameters on improved H2O2 production; and (4) compare the ibuprofen degradation performance by EF process enabled by pulsed and constant current.
2. Materials and Methods
2.1. Materials and chemicals
All chemicals used in this study were analytical grade. H2O2 (30% solution), ferrous sulfate and ibuprofen (2-(4-(2-methyl propyl)phenyl)propanoic acid, C13H18O2) was obtained from Fisher Scientific. Sodium sulfate (anhydrous, ≥99%) and titanium sulfate (99.9%) were purchased from Sigma-Aldrich. Deionized water (18.2 MΩ cm) obtained from a Millipore Milli-Q system was used in all the experiments. Solution pH was adjusted by sulfuric acid (98%, JT Baker) [27].
Graphite plate (Shanxi Kaida Chemical Ltd.) with a size of 2 cm × 4 cm × 2 mm was used as anode and cathode for the study of H2O2 decomposition. Reticulated vitreous carbon foam (RVC foam, 45 pores per inch (PPI), thickness of 2.5 mm, KR Reynolds Ltd.) with an average pore diameter of 508 μm was cut into 2 cm × 4 cm as cathode. The specific surface area is 31 cm2/cm3. RVC foam was used for H2O2 production as it is one of the commonly used carbonaceous materials in EF process [20][28][29]. It has a 3D porous structure [30], which can support our hypothesis that H2O2 molecules generated inside the porous cathode, are partially electroreduced to H2O before it diffuse into the bulk electrolyte. Ti/mixed metal oxide (MMO, 3N International) mesh was used as anode, which produces O2 effectively and support the H2O2 generation on cathode. The Ti/MMO electrode consists of IrO2 and Ta2O5 coating on titanium mesh with dimensions of 3.6 cm diameter by 1.8 mm thickness [24]. Digital photograph of electrodes are shown in Fig. 1.
Fig. 1.
Digital photos of electrodes employed in this study. (a) RVC foam with 45PPI; (b) graphite plate; (c) Ti/MMO mesh.
A constant current was provided by an Agilent E3612A DC power supply. A programmable DC power supply (MODEL 62000P Series, Chroma Ate Inc.) was used to provide pulsed current with various parameters.
2.2. Experimental design
Invalid H2O2 decomposition results from several reaction pathways. To propose a method that can decrease the invalid H2O2 decomposition, decoupling study on these pathways should be conducted firstly. Herein, a series of experiments were designed to study each pathway and the method to reduce them (Tab. 2).
Tab. 2.
Parameters associated with decoupling study of H2O2 decomposition pathways.
| Target Reaction | No. | H2O2 Concentration (mmol L−1) | Current (mA) | Na2SO4 concontration (mol L−1) | Electrodea |
|---|---|---|---|---|---|
| Anodic Oxidation | A1 | 2 | 50 | 0.05 | G+G |
| A2 | 2 | 100 | 0.05 | G+G | |
| A3 | 2 | 200 | 0.05 | G+G | |
| Cathodic Reductionb | C1 | 0.5 | 100 | 0.05 | G+G |
| C2 | 2 | 50 | 0.05 | G+G | |
| C3 | 2 | 100 | 0.05 | G+G | |
| C4 | 2 | 200 | 0.05 | G+G | |
| C5 | 10 | 100 | 0.05 | G+G | |
| C6 | 2 | 50 | 0.05 | G+R | |
| C7 | 2 | 100 | 0.05 | G+R | |
| C8 | 2 | 200 | 0.05 | G+R | |
| Disproportion in Bulkc | D1 | 0.5 | 200 | 0.01 | G+G |
| D2 | 0.5 | 200 | 0.05 | G+G | |
| D3 | 0.5 | 200 | 0.25 | G+G | |
| D4 | 2 | 200 | 0.01 | G+G | |
| D5 | 2 | 200 | 0.05 | G+G | |
| D6 | 2 | 200 | 0.25 | G+G | |
| D7 | 10 | 200 | 0.01 | G+G | |
| D8 | 10 | 200 | 0.05 | G+G | |
| D9 | 10 | 200 | 0.25 | G+G | |
Note:
G means graphite plate, and R means RVC foam.
pH in the cathodic and anodic compartment was monitored, results were shown in part 3.3.
pH was adjusted to 3.0 for D1~D9, which is the best pH for the EF process [33].
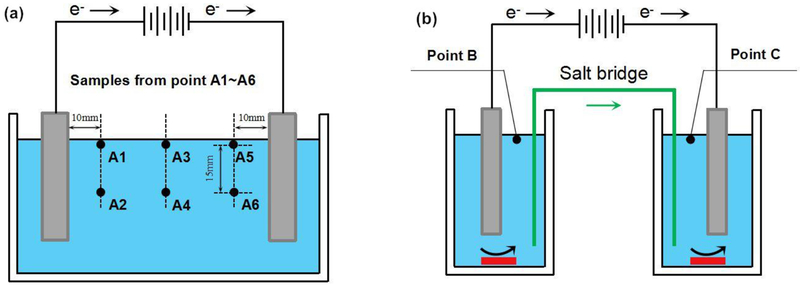
To study H2O2 disproportion pathway in bulk electrolyte, an undivided electrochemical cell with a long distance between two electrodes (20.5 cm) was designed. Two graphite plate electrodes were employed to make electricity passing through the H2O2 solution. The solution was not stirred, and samples were taken from six different points to represent the average concentration of H2O2 (Fig. 2(a)).
Fig. 2.
Schematic diagram of (a) undivided electrochemical cell for investigation of H2O2 disproportion in bulk and (b) divided cell for investigation of H2O2 cathodic reduction and anodic oxidation.
Fig. 2(b) shows the system we designed for the study of anodic oxidation and cathodic reduction of H2O2. Two glass beakers (180 mL) served as compartment 1 and 2. The two compartments were connected by a salt bridge. Samples were taken from point B and C. In several previous reports, a salt bridge was used to connect anodic and cathodic compartments for the EF process [31][32].
3D porous carbonaceous electrodes were widely used as cathode in the EF process as it has abundant reactive sites for O2 reduction. However, H2O2 may also be electroreduced to H2O on these sites when H2O2 diffuse into the bulk electrolyte from porous structure. Therefore, RVC foam was used to represent the porous cathode and confirm our hypothesis that porous structure causes severe H2O2 electroreduction than non-porous cathode (e.g. graphite).
2.3. Analytical methods
Digital photos of RVC foam with 45 PPI were taken by Nikon D7000. Solution pH and dissolved oxygen (DO) were measured by pH meter and DO meter with corresponding microprobes (Microelectro, USA). The microprobes allow the measurement on these parameters using a small amount of solution (≈0.2 mL). H2O2 was measured at 405 nm on a Shimazu UV-Vis spectrometer after coloration with TiSO4 [31]. Ibuprofen was measured by a 1200 Infinity Series HPLC (Agilent) equipped with a 1260 diode array detector (DAD), a 1260 fluorescence detector (FLD) and an Agilent Eclipse AAA C18 column (4.6×150 mm). The mobile phase was a mixture of methanol and water (68:32, v/v) at the flow rate of 0.5 mL/min. The detection wavelengths for DAD was set at 282 nm, and the column temperature at 40 °C [24][26]. Unless otherwise specified, for different pulse parameters, the sampling time was calculated to ensure the electrochemical reaction with electricity is same. The abscissa axis thus means the reaction time with electricity.
The current efficiency (CE) of H2O2 generation, defined as the ratio of the electricity consumed by the electrode reaction over the total electricity passed through the circuit, was calculated by Eq. 8 [12]:
| (8) |
Where n is the number of electrons transferred for O2 reduction to H2O2, F is the Faraday constant (96, 486 C mol−1), CH2O2 is the concentration of H2O2 (mol L−1), V is the electrolyte volume (L), I is the applied current intensity (A), and t is the reaction time (s).
3. Results and Discussion
3.1. Visualization of the generation and diffusion process of H2O2
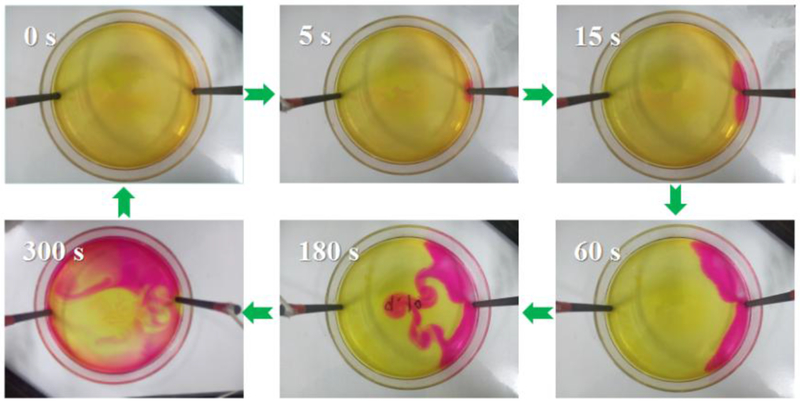
H2O2 molecules are generated in cathode vicinity (inside and surface) and accumulated in bulk electrolyte. It is well recognized that H2O2 generation is closely correlated with cathode materials and structures, H2O2 decomposition is related with where it exists in electrochemical cell. Cathode vicinity, bulk electrolyte, and anode vicinity all causes the decomposition of H2O2. To visualize the diffusion process of H2O2 molecules, an undivided electrochemical cell with addition of litmus reagents to the electrolyte was used.
Water electrolysis at the anode generates O2 and H+ (Eq. 9), and at the cathode, it produces H2 and OH− (Eq. 10). Meanwhile, H2O2 is produced via Eq. 2 at the cathode. Therefore, it is reasonable to visualize the diffusion process of H2O2 molecule by tracing the diffusion process of OH−. In Fig. 3, once OH− was generated, it diffused to bulk and anode vicinity because of the concentration gradient and electrical field. The pink color shows the diffusion process of OH− generated from graphite rod cathode vicinity. By this method, we can conclude that H2O2 molecules also follow this diffusion path, and more importantly, cathode vicinity, bulk electrolyte, and anode vicinity all contribute to the decomposition of H2O2. In part 3.2 and 3.3, their contributions on H2O2 decomposition were systematically investigated.
Fig. 3.
The pink color shows the diffusion process of OH− generated from graphite rod cathode vicinity, which also shows the diffusion process of H2O2 molecules generated from cathode vicinity.
| (9) |
| (10) |
3.2. H2O2 disproportion in bulk solution
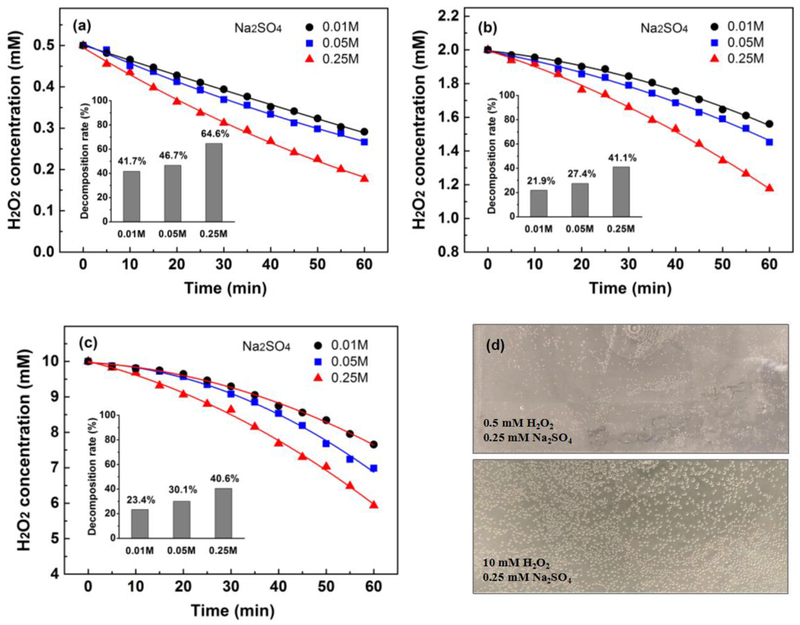
Many factors induce H2O2 decomposition, such as UV light, heat, activated carbon, inorganic salts, metal oxides, electric field [34][35]. Best to our knowledge, a decoupling investigation on H2O2 disproportion in bulk is difficult. Herein, we used a static electrochemical cell with a long distance between anode and cathode (20.5 cm, shown in Fig. 2(a)) to minimize the impact of anode and cathode on H2O2 decomposition. The solution was not stirred, 3 mL samples were taken from 6 points (0.5 mL from each point) to accurately represent the H2O2 concentration in bulk electrolyte. A constant current intensity of 200 mA was applied, the influence of different initial H2O2 concentration and Na2SO4 concentration on residual H2O2 concentration in bulk were shown in Fig. 4.
Fig. 4.
Profiles of H2O2 concentration in 0.01, 0.05 and 0.25 mol/L Na2SO4 electrolyte with different initial concentration: (a) 0.5 mmol/L; (b) 2 mmol/L; (c) 10 mmol/L. (d) Oxygen bubbles on the bottom of the static cell. Conditions: 450 mL, without stirring, current of 200 mA, initial pH of 3.
It is obvious that electric field cause H2O2 disproportion in bulk electrolyte. On the bottom of the static cell, we observed many small oxygen bubbles (Fig. 4(d)) which can not be formed just by water electrolysis without H2O2. This phenomenon illustrated that H2O2 partially decomposed to H2O and O2 in bulk electrolyte. H2O2 disproportion ratio under different initial H2O2 concentration followed a similar sequence: 0.25 mol/L > 0.05 mol/L > 0.01 mol/L. For an initial H2O2 concentration of 0.5 mmol/L, 64.6% of total H2O2 decomposed under Na2SO4 concentration of 0.25 mol/L. Even at a low concentration of Na2SO4 (0.05 mol/L and 0.01 mol/L), severe disproportion occurred (46.7% and 41.7%, respectively). Interestingly, for the initial H2O2 concentration of 2 mmol/L and 10 mmol/L, the extent of H2O2 disproportion is lower than 0.5 mmol/L. Usually, the concentration of H2O2 in EF process is several or tens of mmol/L, our results show that severe H2O2 disproportion occurs in bulk electrolyte at a wide range of electrolyte concentration.
3.3. Anodic oxidation and cathodic reduction of H2O2
The setup shown in Fig. 2(b) was used to investigate anodic oxidation and cathodic reduction of H2O2 in a decoupling way. By using a divided electrochemical cell connected by a salt bridge, H2O2 anodic oxidation and cathodic reduction can be achieved in the anodic compartment and cathodic compartment, respectively.
3.3.1. Effect of current intensity
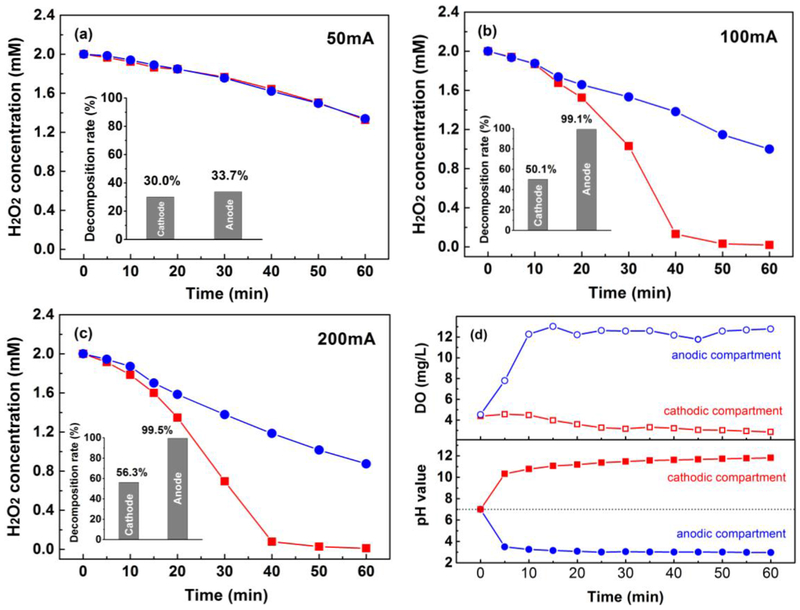
Effect of the current intensity of 50 mA, 100 mA, and 200 mA on H2O2 concentration in anodic and cathodic compartment were shown in Fig. 5. Current intensity plays a significant role on H2O2 decomposition. In the cathodic compartment, H2O2 was electroreduced to H2O via Eq. 4. While in anodic compartment, H2O2 was oxidized to O2 via Eq. 5~6. At the low current intensity of 50 mA, 30.0% and 33.7% of total H2O2 was decomposed via cathodic reduction and anodic oxidation after 60 min, respectively. At higher current intensity, the profile of H2O2 concentration in two compartments is notably different. At the current intensity of 100 mA and 200 mA, more than 90% H2O2 decomposed in anodic compartment at 40 min, while more than 50% H2O2 (50.1% and 56.3%, respectively) was electroreduced in cathodic compartment at 60 min.
Fig. 5.
Profiles of H2O2 concentration in compartment 1 and 2 with different current intensity: (a) 50 mA; (b) 100 mA; (c) 200 mA, and (d) Profiles of DO and pH in compartment 1 and 2. Conditions: initial H2O2 concentration of 2 mmol/L, the total volume of 180 mL in each compartment, initial pH of 7.
The results indicate that high current can boost H2O2 generation via Eq. 2. Meanwhile, it also results in severe H2O2 electroreduction. During operation, the profile of DO and pH of the two compartments were recorded and shown in Fig. 5(d). H+ and O2 were produced on anode, and OH− and H2 was provided on cathode. These species was separated by a salt bridge. Hence pH in cathodic compartment decreased while increased in anodic compartment. pH has no noticeable effect on H2O2 decomposition within 60 min for 2 mmol/L H2O2 (Fig. S1).
3.3.2. Effect of initial H2O2 concentration on H2O2 cathodic reduction
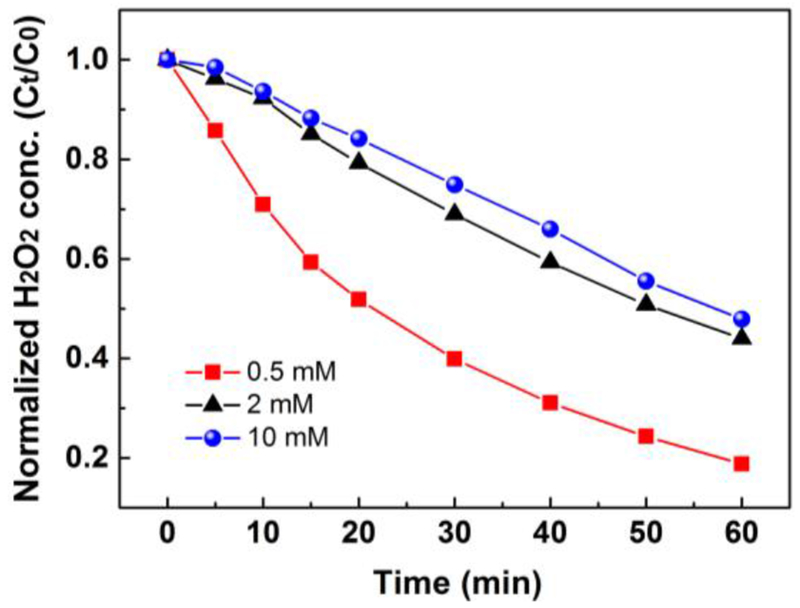
Based on our analysis, anodic oxidation cannot be inhibited because H2O2 generated in cathode vicinity will inevitably transfer to anode vicinity especially under stirring conditions. However, the extent of cathodic reduction can be possibly reduced by applying pulsed current. Here, we further investigate the influence of initial H2O2 concentration on H2O2 cathodic reduction. The current intensity of 100 mA was applied. Residual H2O2 concentration in the cathodic compartment was measured and plotted in Fig. 6. For an initial concentration of 0.5 mmol/L, 81.2% of total H2O2 was electroreduced at 60 min, while for an initial concentration of 2 mmol/L and 10 mmol/L, 56.1% and 52.2% of total H2O2 was electroreduced at 60 min, respectively. This result suggests that if the electrogenerated H2O2 concentration is around 0.5 mmol/L, the electroreduction of H2O2 should be considered since a large proportion of H2O2 was wasted by this pathway.
Fig. 6.
Influence of initial H2O2 concentration on H2O2 cathodic reduction. Conditions: 180 mL, current of 100 mA, initial pH of 7.
3.3.3. Effect of cathode material on H2O2 cathodic reduction
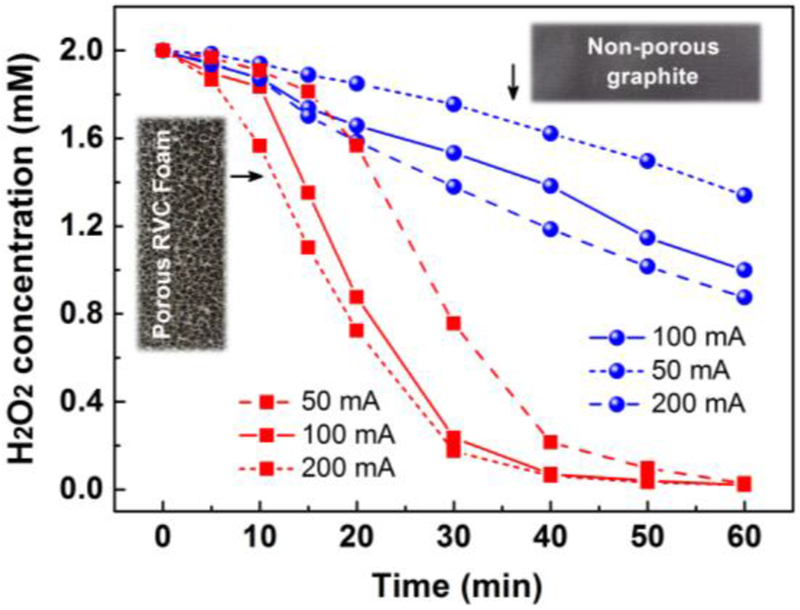
As results from 3.3.1 suggested, cathodic reduction cause severe depletion of H2O2. This reaction occurred simultaneously with the electrogeneration of H2O2. Therefore, it is reasonable to assume that this process is closely related to cathode structure, that is, the porous or non-porous cathode will show entirely different results on H2O2 electroreduction. Herein, RVC foam and graphite plate were selected as a porous and non-porous cathode, 2 mmol/L H2O2 was added to cathodic compartment in advance. Influence of current intensity on this pathway was shown in Fig. 7. It is evident that under all current intensity, porous cathode (RVC foam) causes severe H2O2 electroreduction than non-porous cathode (graphite plate).
Fig. 7.
Comparison of H2O2 cathodic reduction by graphite plate and RVC foam cathode under different current intensity. Conditions: total volume of 180 mL, 0.05 mol/L Na2SO4, initial pH of 7, the initial H2O2 concentration of 2 mmol/L.
However, the exact process by which the H2O2 formed on one site will be reduced to H2O on another site. This process may occur either through electroreduction (Eq. 4) or disproportion reaction (Eq. 3). In the latter case, the O2 originating from the disproportion reaction could be electrochemically reduced to H2O2 once again [20].
3.4. Reduced H2O2 electroreduction pathway by applying pulsed current
3.4.1. Mechanism
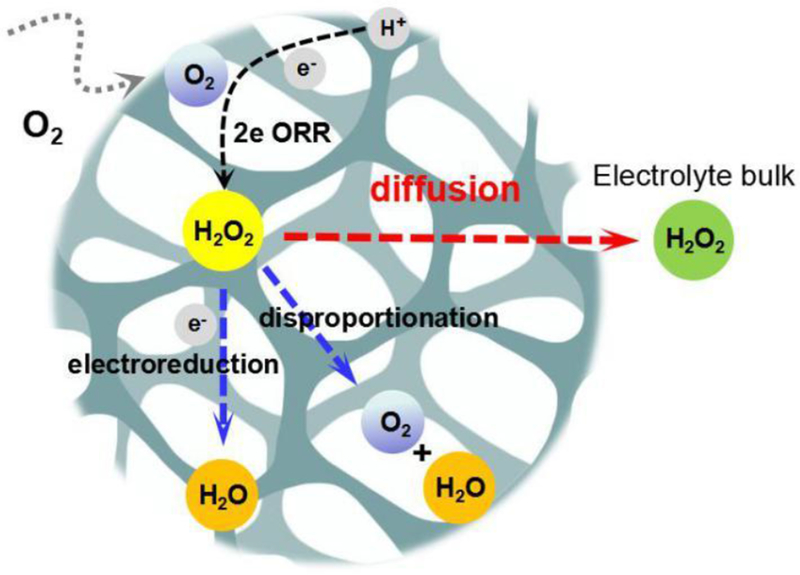
Our efforts were then aimed to put forward strategies to reduce H2O2 electroreduction, thus increase the yield of H2O2 in bulk electrolyte. Fig. 8 illustrates the behavior of H2O2 molecules before it was transported to the bulk electrolyte. Principally, after produced on active sites, the H2O2 molecules will diffuse through porous structure before reaching the bulk, in which the electroreduction occurred at other active sites. Therefore, if pulsed current is applied, the diffusion process of H2O2 molecules will be facilitated, and thus, higher H2O2 concentration can be obtained in the bulk electrolyte.
Fig. 8.
The behavior of H2O2 molecules in porous RVC foam cathode, including electrogeneration, disproportion, electroreduction, and its diffusion to the bulk electrolyte.
3.4.2. Effect of pulsed current parameters
The key feature of electrogeneration and electroreduction of H2O2 is that these two processes occur within the porous cathode. They take place simultaneously, which means the diffusion of H2O2 molecules to bulk will cause its partially electroreduction. This section is dedicated to explain in detail the impact of pulsed current parameters on H2O2 concentration in bulk and the extent of electroreduction.
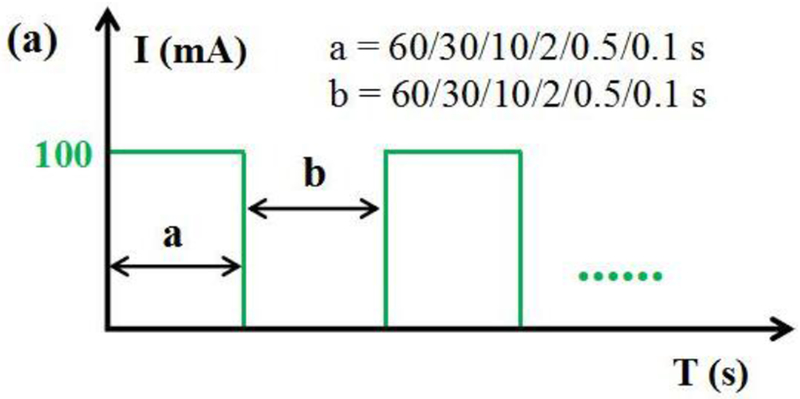
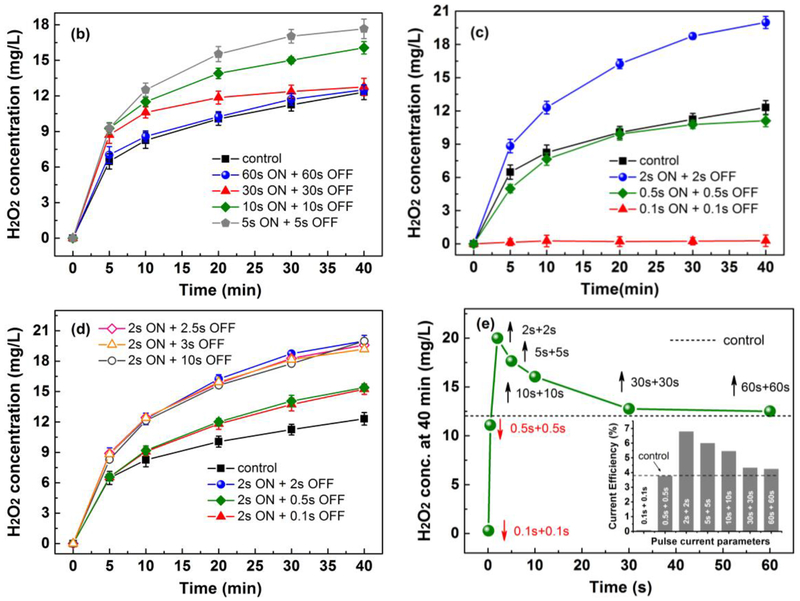
As Fig. 9 shows, different ON and OFF time scale was set to explore the best combination. With power on, the reaction of H2O2 electrogeneration occurred. However, the reaction of H2O2 electroreduction also occurred. With power off, the two reactions stopped, and the generated H2O2 has some time to diffuse to bulk electrolyte. A “volcano-shape” curve (Fig. 9(e)) was plotted based on our results, which showed the relationship between H2O2 concentration and different “ON+OFF” combinations. “2s ON + 2s OFF” showed the highest yield of H2O2 in bulk. Long time scale such like “5s ON + 5s OFF”, “10s ON + 10s OFF”, “30s ON + 30s OFF”, and “60s ON + 60s OFF” also showed the enhanced effect on H2O2 yield compared with control experiment. However, short time scale such as “0.5s ON+0.5s OFF” and “0.1s ON + 0.1s OFF” showed a decreased yield of H2O2, especially for “0.1s ON+0.1s OFF”.
Fig. 9.
Influence of different pulse parameters on H2O2 production. (a) Parameters of pulsed current; (b) low frequency (60s+60s, 30s+30s, 10s+10s, 5s+5s); (c) high frequency (2s+2s, 0.5s+0.5s, 0.1s+0.1s); (d) with same ON time (2s) and different OFF time; (e) “volcano-shape” curve. Conditions: total volume of 180 mL, Ti/MMO anode, RVC Foam cathode, 0.05M Na2SO4, initial pH of 7, 350 rpm, constant or pulsed current intensity of 100 mA. Error bars represent the standard error of the mean.
Little is known about how pulsed current influence EF performance. Based on our analysis above, two reasons may account for this phenomenon. For short time scale such like 0.1 s, even anodic O2 cannot be efficiently generated, which significantly influence the 2-electron oxygen reduction on RVC foam cathode. For long time scale such like 60 s, anodic O2 generation was not affected by such a long ON time. However, on the other hand, it is so long that most H2O2 was electroreduced within this period, although some H2O2 molecules can diffuse to bulk during power off. Therefore, it had nearly the same result as control experiments. “2s ON + 2s OFF” is, therefore, the best combination for an enhanced yield of H2O2 bulk electrolyte, which achieved the best compromise between anodic O2 generation and H2O2 diffusion within the porous cathode.
Moreover, we investigated whether OFF time influence the H2O2 yield when ON time is 2s. Results were shown in Fig. 9(d). It is evident that OFF time of 0.5 s and 0.1 s is not as effective as 2 s. This was possibly because the time scale is so short that the generated H2O2 molecules cannot transfer to bulk during this period. A longer OFF time of 2.5 s, 3 s, and 10 s doesn’t necessarily increase the H2O2 yield, indicating that OFF time of 2 s is sufficient for the diffusion of H2O2 molecules. The H2O2 production rate was calculated and compared with literature in Tab. 3. Interestingly, we also found pulsed current is not effective on non-porous cathode such as graphite electrode (Fig. S2). We believe this finding is significant because it can be applied to many porous carbonaceous cathodes, such as RVC foam, graphite felt, carbon felt, carbon fibers. We also showed our strategy worked on graphite felt in Fig. S3.
Tab. 3.
Comparison of H2O2 production rate with literature.
| Cathode | pH | Current density (A/m2) | t (min) | O2 flow rate (L/min) | [H2O2] (mg/h/cm2) | Ref. |
|---|---|---|---|---|---|---|
| Graphite felt | 3 | 132 | 300 | 0.14 | 0.11 | [36][37] |
| Carbon felt | 3 | 161 | 180 | 0.1 | 0.62 | [38] |
| GDEa | 3 | 204 | 300 | 0.14 | 1.94 | [37] |
| Graphite felt | 6.4 | −0.65b | 120 | 0.4 | 0.44 | [39] |
| Graphite felt | 3 | 50 | 60 | 0 | 0.58 | [40] |
| ACF | 3 | 250 | 180 | 0.1 | 0.55 | [41] |
| Graphite | 3 | −0.65c | 120 | 0.33 | 1.00 | [42] |
| RVC foam | 7 | 125 | 40 | 0 | 0.67 | This work |
Note:
-GDE means gas diffusion electrodes;
-the bias potential of the cathode (volts) (vs the saturated calomel electrode (SCE));
-the bias potential of the cathode (vs. SCE).
3.5. Performance on ibuprofen degradation in EF process
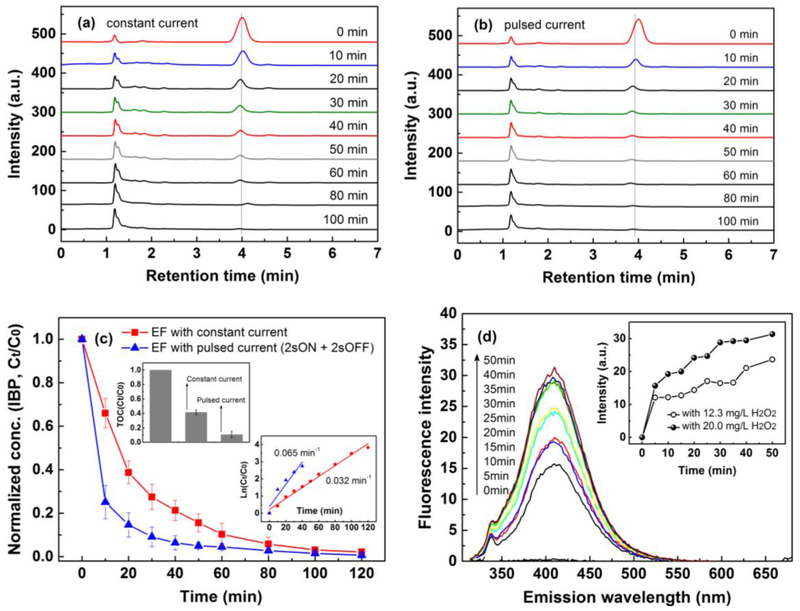
To test the feasibility of EF process under pulsed current for organic pollutants degradation, ibuprofen, which is frequently detected in the aquatic environment and poses a threat to human health, was selected as a model pollutant. Results of the comparative study were shown in Fig. 10. Fig. 10(a) and (b) demonstrates that EF under constant and pulsed current are both effective for ibuprofen removal with an initial concentration of 40 mg/L. However, it is obvious that EF under pulsed current is a lot more efficient than EF under constant current. At 10 min, the ibuprofen removal efficiency in EF under constant and pulsed current is 34.1% and 75.0%, respectively. At 60 min, nearly all the ibuprofen was removed in EF under pulsed current, while it is 100 min in EF under constant current. The pseudo first-order kinetics are 0.032 min−1 and 0.065 min−1 (Fig. 10(c)) for ibuprofen removal in EF under constant and pulsed current, respectively. TOC measurement results are shown in Fig. 10(c) also implies that EF under pulsed current is more efficient for TOC removal, in which 59.5% and 89.3% TOC was removed at 120 min in EF under constant and pulsed current, respectively. Results were compared with literature and shown in Tab. S1. Moreover, based on the aromatic intermediates and carboxylic acids detected (Tab. S2), a possible degradation pathway was proposed in Fig. S4.
Fig. 10.
HPLC analysis of ibuprofen samples taken at different time under constant (a) and pulsed current of “2s ON + 2s OFF” (b); (c) profile of normalized concentration of ibuprofen and TOC in EF process, and (d) profile of fluorescence intensity at different emission wavelength in EF process with externally added H2O2 at 22.0 and 12.3 mg/L. Conditions: total volume of 600 mL, Ti/MMO anode and RVC foam cathode, 0.05 M Na2SO4, initial pH of 3, 350 rpm, current of 100 mA, ibuprofen of 40 mg/L, Fe2+ of 70 mg/L, benzoic acid of 250 mg/L. The sampling time of EF with pulsed current and constant current was same. Error bars represent the standard error of the mean.
The enhanced ibuprofen removal efficiency verified our hypothesis that enhanced H2O2 production in bulk could accelerate EF process for organic pollutants degradation. This result is consistent with results of enhanced H2O2 production by pulsed current shown in Fig. 9(c), where 19.9 mg/L and 12.3 mg/L H2O2 was obtained in bulk at 40 min under a constant current of 100 mA and pulsed current of “2s ON + 2s OFF” (intensity: 100 mA). Furthermore, the production of hydroxyl radicals, which is responsible for ibuprofen removal and TOC removal, are compared and shown in Fig. 10(d) (fluorescence spectra of the solution under constant current was shown in Fig. S5). Hydroxyl radicals were captured by benzoic acid and form hydroxybenzoic acid with fluorescence properties [43]. Thus, the higher spectral peak value in Fig. 10(d) implies that more hydroxyl radicals are generated in EF process under pulsed current.
4. Conclusions
In EF process, the concentration of H2O2 in bulk electrolyte is determined by H2O2 electrogeneration via 2-electron ORR as well as H2O2 decomposition. In this work, we designed several experiments to investigate H2O2 disproportion in bulk, H2O2 anodic oxidation, and H2O2 cathodic reduction in a decoupled way. H2O2 Electroreduction is the only pathway that can be weakened based on our analysis. When applying pulsed current, H2O2 concentration in bulk was dramatically enhanced by 61.6% (“2s ON + 2s OFF”) than under constant current. A summary of different parameters showed a “volcano-shape” curve, indicating that a proper pulse frequency is necessary to achieve the enhanced H2O2 production. Finally, EF process enabled by pulsed current was proved to be more efficient for ibuprofen degradation than constant current, proving potential practical application for organic wastewater treatment.
Supplementary Material
Acknowledgements
This work was financially supported by the US National Institute of Environmental Health Sciences (NIEHS, Grant No. P42ES017198), National Natural Science Foundation of China (Grant No. 91434134), and the Foundation for Innovative Research Groups of the National Natural Science Foundation of China (Grant No. 51421063). The content is solely the responsibility of the authors and does not necessarily represent the official views of the NIEHS, the National Institutes of Health and the National Natural Science Foundation of China.
Footnotes
Conflict of Interest
The authors declare that they have no conflict of interest.
Reference
- [1].Oturan MA, Peiroten J, Chartrin P, Acher AJ, Complete destruction of p-Nitrophenol in aqueous medium by electro-fenton method, Environmental Science and Technology. 34 (2000) 3474–3479. doi: 10.1021/es990901b. [DOI] [Google Scholar]
- [2].Brillas E, Mur E, Casado J, Iron(II) Catalysis of the Mineralization of Aniline Using a Carbon-PTFE O2 - Fed Cathode, Journal of The Electrochemical Society. 143 (1996) L49–L53. doi: 10.1149/1.1836528. [DOI] [Google Scholar]
- [3].Sirés I, Brillas E, Oturan MA, Rodrigo MA, Panizza M, Electrochemical advanced oxidation processes: Today and tomorrow. A review, Environmental Science and Pollution Research. 21 (2014) 8336–8367. doi: 10.1007/s11356-014-2783-1. [DOI] [PubMed] [Google Scholar]
- [4].Zhang Y, Gao M, Wang SG, Zhou W, Sang Y, Wang XH, Integrated electro-Fenton process enabled by a rotating Fe3O4/gas diffusion cathode for simultaneous generation and activation of H2O2, Electrochimica Acta. 231 (2017) 694–704. doi: 10.1016/j.electacta.2017.02.091. [DOI] [Google Scholar]
- [5].Liu Y, Chen S, Quan X, Yu H, Zhao H, Zhang Y, Efficient Mineralization of Perfluorooctanoate by Electro-Fenton with H2O2 Electro-generated on Hierarchically Porous Carbon, Environmental Science and Technology. 49 (2015) 13528–13533. doi: 10.1021/acs.est.5b03147. [DOI] [PubMed] [Google Scholar]
- [6].Yu F, Zhou M, Yu X, Cost-effective electro-Fenton using modified graphite felt that dramatically enhanced on H2O2 electro-generation without external aeration, Electrochimica Acta. 163 (2015) 182–189. doi: 10.1016/j.electacta.2015.02.166. [DOI] [Google Scholar]
- [7].Yu X, Zhou M, Ren G, Ma L, A novel dual gas diffusion electrodes system for efficient hydrogen peroxide generation used in electro-Fenton, Chemical Engineering Journal. 263 (2015) 92–100. doi: 10.1016/j.cej.2014.11.053. [DOI] [Google Scholar]
- [8].Zhou L, Zhou M, Hu Z, Bi Z, Serrano KG, Chemically modified graphite felt as an efficient cathode in electro-Fenton for p-nitrophenol degradation, Electrochimica Acta. 140 (2014) 376–383. doi: 10.1016/j.electacta.2014.04.090. [DOI] [Google Scholar]
- [9].Wang Y, Liu Y, Wang K, Song S, Tsiakaras P, Liu H, Preparation and characterization of a novel KOH activated graphite felt cathode for the electro-Fenton process, Applied Catalysis B: Environmental. 165 (2015) 360–368. doi: 10.1016/j.apcatb.2014.09.074. [DOI] [Google Scholar]
- [10].Miao J, Zhu H, Tang Y, Chen Y, Wan P, Graphite felt electrochemically modified in H2SO4 solution used as a cathode to produce H2O2 for pre-oxidation of drinking water, Chemical Engineering Journal. 250 (2014) 312–318. doi: 10.1016/j.cej.2014.03.043. [DOI] [Google Scholar]
- [11].Zhou L, Zhou M, Zhang C, Jiang Y, Bi Z, Yang J, Electro-Fenton degradation of p-nitrophenol using the anodized graphite felts, Chemical Engineering Journal. 233 (2013) 185–192. doi: 10.1016/j.cej.2013.08.044. [DOI] [Google Scholar]
- [12].Qiang ZM, Chang JH, Huang CP, Electrochemical generation of hydrogen peroxide from dissolved oxygen in acidic solutions, Water Research. 36 (2002) 85–94. doi: 10.1016/S0043-1354(01)00235-4. [DOI] [PubMed] [Google Scholar]
- [13].Perez JF, Llanos J, Saez C, Lopez C, Canizares P, Rodrigo MA, Electrochemical jet-cell for the in-situ generation of hydrogen peroxide, Electrochemistry Communications. 71 (2016) 65–68. doi: 10.1016/j.elecom.2016.08.007. [DOI] [Google Scholar]
- [14].Scialdone O, Galia A, Gattuso C, Sabatino S, Schiavo B, Effect of air pressure on the electro-generation of H2O2 and the abatement of organic pollutants in water by electro-Fenton process, Electrochimica Acta. 182 (2015) 775–780. doi: 10.1016/j.electacta.2015.09.109. [DOI] [Google Scholar]
- [15].Vasudevan S, Oturan MA, Electrochemistry: As cause and cure in water pollution-an overview, Environmental Chemistry Letters. 12 (2014) 97–108. doi: 10.1007/s10311-013-0434-2. [DOI] [Google Scholar]
- [16].Sánchez-Sánchez CM, Bard AJ, Hydrogen peroxide production in the oxygen reduction reaction at different electrocatalysts as quantified by scanning electrochemical microscopy, Analytical Chemistry. 81 (2009) 8094–8100. doi: 10.1021/ac901291v. [DOI] [PubMed] [Google Scholar]
- [17].Zhou R, Zheng Y, Jaroniec M, Qiao S-Z, Determination of the Electron Transfer Number for the Oxygen Reduction Reaction: From Theory to Experiment, ACS Catalysis. 6 (2016) 4720–4728. doi: 10.1021/acscatal.6b01581. [DOI] [Google Scholar]
- [18].Carneiro JF, Paulo MJ, Siaj M, Tavares AC, Lanza MRV, Nb2O5 nanoparticles supported on reduced graphene oxide sheets as electrocatalyst for the H2O2 electrogeneration, Journal of Catalysis. 332 (2015) 51–61. doi: 10.1016/j.jcat.2015.08.027. [DOI] [Google Scholar]
- [19].Coria G, Perez T, Sires I, Nava JL, Mass transport studies during dissolved oxygen reduction to hydrogen peroxide in a filter-press electrolyzer using graphite felt, reticulated vitreous carbon and boron-doped diamond as cathodes, Journal of Electroanalytical Chemistry. 757 (2015) 225–229. doi: 10.1016/j.jelechem.2015.09.031. [DOI] [Google Scholar]
- [20].Li Q, Batchelor-Mcauley C, Lawrence NS, Hartshorne RS, Jones CJV, Compton RG, A flow system for hydrogen peroxide production at reticulated vitreous carbon via electroreduction of oxygen, Journal of Solid State Electrochemistry. 18 (2014) 1215–1221. doi: 10.1007/s10008-013-2250-9. [DOI] [Google Scholar]
- [21].Daneshvar N, Aber S, Vatanpour V, Rasoulifard MH, Electro-Fenton treatment of dye solution containing Orange II: Influence of operational parameters, Journal of Electroanalytical Chemistry. 615 (2008) 165–174. doi: 10.1016/j.jelechem.2007.12.005. [DOI] [Google Scholar]
- [22].Fellinger TP, Hasché F, Strasser P, Antonietti M, Mesoporous nitrogen-doped carbon for the electrocatalytic synthesis of hydrogen peroxide, Journal of the American Chemical Society. 134 (2012) 4072–4075. doi: 10.1021/ja300038p. [DOI] [PubMed] [Google Scholar]
- [23].Hickling A, Wilson WH, The Anodic Decomposition of Hydrogen Peroxide, Journal of The Electrochemical Society. 98 (1951) 425. doi: 10.1149/1.2778020. [DOI] [Google Scholar]
- [24].Yuan S, Gou N, Alshawabkeh AN, Gu AZ, Efficient degradation of contaminants of emerging concerns by a new electro-Fenton process with Ti/MMO cathode, Chemosphere. 93 (2013) 2796–2804. doi: 10.1016/j.chemosphere.2013.09.051. [DOI] [PubMed] [Google Scholar]
- [25].Loaiza-Ambuludi S, Panizza M, Oturan N, Ozcan A, Oturan MA, Electro-Fenton degradation of anti-inflammatory drug ibuprofen in hydroorganic medium, Journal of Electroanalytical Chemistry. 702 (2013) 31–36. doi: 10.1016/j.jelechem.2013.05.006. [DOI] [Google Scholar]
- [26].Xiang Y, Fang J, Shang C, Kinetics and pathways of ibuprofen degradation by the UV/chlorine advanced oxidation process, Water Research. 90 (2016) 301–308. doi: 10.1016/j.watres.2015.11.069. [DOI] [PubMed] [Google Scholar]
- [27].Zhou W, Zhao H, Gao J, Meng X, Wu S, Qin Y, Influence of Reagents Addition Strategy on Fenton Oxidation of Rhodamine B: Control of Competitive Reaction of ·OH, RSC Adv. (2016). doi: 10.1039/C6RA20242J. [DOI] [Google Scholar]
- [28].Nava JL, Recéndiz A, González LG, Carreño G, Martínez F, PORTUGALIAE ELECTROCHIMICA ACTA Mass Transport and Potential Studies in a Flow-through Porous Electrode Reactor. A Comparative Study of Reticulated Vitreous Carbon and Graphite Felt Used as Cathode, Portugaliae Electrochimica Acta. 27 (2009) 381–396. doi: 10.4152/pea.200903381. [DOI] [Google Scholar]
- [29].Xie YB, Li XZ, Interactive oxidation of photoelectrocatalysis and electro-Fenton for azo dye degradation using TiO2-Ti mesh and reticulated vitreous carbon electrodes, Materials Chemistry and Physics. 95 (2006) 39–50. doi: 10.1016/j.matchemphys.2005.05.048. [DOI] [Google Scholar]
- [30].Walsh FC, Arenas LF, Ponce de León C, Reade GW, Whyte, Mellor BG, The continued development of reticulated vitreous carbon as a versatile electrode material: Structure, properties and applications, Electrochimica Acta. 215 (2016) 566–591. doi: 10.1016/j.electacta.2016.08.103. [DOI] [Google Scholar]
- [31].Yuan S, Fan Y, Zhang Y, Tong M, Liao P, Pd-catalytic in situ generation of H2O2 from H2 and O2 produced by water electrolysis for the efficient electro-fenton degradation of rhodamine B., Environmental Science & Technology. 45 (2011) 8514–20. doi: 10.1021/es2022939. [DOI] [PubMed] [Google Scholar]
- [32].Liu H, Wang C, Li X, Xuan X, Jiang C, Cui HN, A novel electro-Fenton process for water treatment: Reaction-controlled pH adjustment and performance assessment, Environmental Science and Technology. 41 (2007) 2937–2942. doi: 10.1021/es0622195. [DOI] [PubMed] [Google Scholar]
- [33].Zhou W, Gao J, Zhao H, Meng X, Wu S, The role of quinone cycle in Fe2+ – H2O2 system in the regeneration of Fe2+, Environmental Technology. 3330 (2016) 1–10. doi: 10.1080/09593330.2016.1240241. [DOI] [PubMed] [Google Scholar]
- [34].Messele SA, Soares OSGP, Órfão JJM, Stüber F, Bengoa C, Fortuny A, Fabregat A, Font J, Zero-valent iron supported on nitrogen-containing activated carbon for catalytic wet peroxide oxidation of phenol, Applied Catalysis B: Environmental. 154–155 (2014) 329–338. doi: 10.1016/j.apcatb.2014.02.033. [DOI] [Google Scholar]
- [35].Lucking F, Koser H, Jank M, Ritter A, Iron powder, graphite and activated carbon as catalysts for the oxidation of 4-chlorophenol with hydrogen peroxide in aqueous solution, Water Research. 32 (1998) 2607–2614. doi: 10.1016/S0043-1354(98)00016-5. [DOI] [Google Scholar]
- [36].Zarei M, Salari D, Niaei A, Khataee A, Peroxi-coagulation degradation of C.I. Basic Yellow 2 based on carbon-PTFE and carbon nanotube-PTFE electrodes as cathode, Electrochimica Acta. 54 (2009) 6651–6660. doi: 10.1016/j.electacta.2009.06.060. [DOI] [Google Scholar]
- [37].Salari D, Niaei A, Khataee A, Zarei M, Electrochemical treatment of dye solution containing C.I. Basic Yellow 2 by the peroxi-coagulation method and modeling of experimental results by artificial neural networks, Journal of Electroanalytical Chemistry. 629 (2009) 117–125. doi: 10.1016/j.jelechem.2009.02.002. [DOI] [Google Scholar]
- [38].Ozcan A, Sahin Y, Savas Koparal A, Oturan MA, Carbon sponge as a new cathode material for the electro-Fenton process: Comparison with carbon felt cathode and application to degradation of synthetic dye basic blue 3 in aqueous medium, Journal of Electroanalytical Chemistry. 616 (2008) 71–78. doi: 10.1016/j.jelechem.2008.01.002. [DOI] [Google Scholar]
- [39].Zhou L, Hu Z, Zhang C, Bi Z, Jin T, Zhou M, Electrogeneration of hydrogen peroxide for electro-Fenton system by oxygen reduction using chemically modified graphite felt cathode, Separation and Purification Technology. 111 (2013) 131–136. doi: 10.1016/j.seppur.2013.03.038. [DOI] [Google Scholar]
- [40].Yu F, Zhou M, Zhou L, Peng R, A Novel Electro-Fenton Process with H2O2 Generation in a Rotating Disk Reactor for Organic Pollutant Degradation, Environmental Science and Technology Letters. 1 (2014) 320–324. doi: 10.1021/ez500178p. [DOI] [Google Scholar]
- [41].Wang A, Qu J, Ru J, Liu H, Ge J, Mineralization of an azo dye Acid Red 14 by electro-Fenton’s reagent using an activated carbon fiber cathode, Dyes and Pigments. 65 (2005) 227–233. doi: 10.1016/j.dyepig.2004.07.019. [DOI] [Google Scholar]
- [42].Zhang G, Yang F, Gao M, Fang X, Liu L, Electro-Fenton degradation of azo dye using polypyrrole/anthraquinonedisulphonate composite film modified graphite cathode in acidic aqueous solutions, Electrochimica Acta. 53 (2008) 5155–5161. doi: 10.1016/j.electacta.2008.01.008. [DOI] [Google Scholar]
- [43].Zhao H, Gao J, Zhou W, Wang Z, Wu S, Quantitative detection of hydroxyl radicals in Fenton system by UV-vis spectrophotometry, Anal. Methods. 7 (2015) 5447–5453. doi: 10.1039/C5AY00514K. [DOI] [Google Scholar]
Associated Data
This section collects any data citations, data availability statements, or supplementary materials included in this article.


