

Abstract
The role of immunohistochemistry (IHC) in the management of cancer has expanded to provide improved diagnostic classification, as well as guidance on disease prognosis, therapy, and relapse. These new tasks require evaluation of an increasing number of protein targets; however, conventional multiplexing, usually achieved using serial tissue sections stained for a single analyte per slide, can exhaust small biopsy specimens, complicate slide-to-slide protein expression correlation, and leave insufficient material for additional molecular assays. A new approach, mass spectrometry immunohistochemistry (MSIHC), compatible with high levels of target multiplexing and suitable for use on formalin-fixed, paraffin-embedded samples can circumvent many of these issues. The strategy employs antibodies that are labeled with elemental mass tags, such as isotopically pure lanthanides not typically found in biological specimens, rather than with typical fluorophores or chromogens. The metal-labeled antibodies are then detected in tissue using lasers or ion beams to liberate the tags for subsequent mass spectrometry detection. Within a given multiplexed IHC panel, the metal labels are selected so that their respective masses do not overlap. More than 30 antibodies have been imaged simultaneously, and up to 100 antibodies could potentially be detected at once if the full available mass spectrum is deployed. MSIHC has a number of advantages over conventional IHC techniques. Background due to autofluorescence is absent and the dynamic range is 105, exceeding immunofluorescence and chromogenic IHC by 100-fold and 1000-fold, respectively. Detection of labeled primary antibodies improves assay linearity over both chromogenic and fluorescent IHC. Multiplexed mass-tagged antibodies incubated simultaneously with tissue do not appear to cross-interfere, and because the mass tags do not degrade, samples are stable indefinitely. The imaging resolution of multiplexed ion-beam imaging can be better than light microscopy. With appropriate instrumentation, MSIHC has the potential to transform research and clinical pathology practice.
Next-generation sequencing, quantitative PCR, and gene expression arrays have demonstrated the usefulness of methods that can examine tens to thousands of genes from tissue extracts. These non-imaging approaches have, however, increased demands for imaging methods that might be capable of generating equivalent levels of information at scales spanning tissue-level to the subcellular. There are good reasons to try to meet this challenge, as non-imaging-based multiplexed assays are unable to address many important questions in pathobiology. These bulk sample analyses are largely uninformed by spatial context and may convey only limited information on possibly important minority cell populations, as phenotypes arising from predominant cellular components often obscure signals from low-abundance but possibly important cell subsets. Such minority populations, of course, can be of great interest, as in the case of cancer stem cells thought to represent a small but critical part of a tumor ecosystem.1,2 In addition, a highly multiplexed imaging platform could be used to understand the interplay of intra- and inter-cellular signaling pathways by examining how phenotypically distinct cell populations are spatially distributed relative to one another.
The role of immunohistochemistry (IHC, antibody-based protein detection in cells and tissue sections) in the clinical diagnosis of cancer has expanded greatly in recent years to provide critical information about disease prognosis, therapy, and relapse. These new tasks require the determination of abundance and subcellular location of an increasing number of proteins within a single biopsy, and this is accomplished using either brightfield (chromogenic) or fluorescence detection techniques. Both have limitations. Chromogenic staining in clinical labs is typically performed using a single primary antibody at a time, with additional protein targets being visualized in separate serial biopsy sections. This technique relies on multivalent secondary antibodies conjugated to enzymatic reporters, such as horseradish peroxidase, that generate colored pigments by reacting with a substrate, such as 3,3′-diaminobenzidine. Although two or more targets can be visualized simultaneously using different chromogens and amplification schemes, colorimetric detection of more than three antigens using multiple enzyme-linked secondary antibodies is challenging.3 In practice, chromogenic multiplexing is usually limited to two targets because of difficulties encountered in sample preparation and imaging. Beyond this relatively low multiplexing ceiling, IHC has additional shortcomings.4 Chromogenic IHC staining can generate dense deposits that are easy to detect but difficult to quantitate, because of nonlinear optical effects and low achievable dynamic ranges. These issues are compounded when using multiple contrast agents in a single tissue section; multiple pigments layered on top of one another may generate regions within the tissue that are virtually opaque and cannot be transilluminated.
On the other hand, fluorescent labels used in immunofluorescence (IF)-based techniques can provide a higher signal-to-noise ratio than chromogenic labels and are more frequently used for simultaneous detection of multiple targets; nevertheless, they present their own challenges. Practical limitations include a typical requirement for the use of separate animal species for each primary–secondary antibody pair, and for substantially non-overlapping reporter emission spectra if multispectral imaging techniques are not available.5–8 It should be noted that impressive levels of multiplexing (up to 10 labels at a time) are possible using conventional fluorescence microscope equipment, but this requires careful matching of fluorescent reporters, dichroic mirrors, and band-pass filters along with a complicated repertoire of species- and subtype-matched primary and secondary antibodies (Trajan Maric, personal communication). Thus, conventional IHC (IF) methodologies are not capable of generating the robust multiplexed, quantitative data needed to understand the relationship between tissue microarchitecture and expression at a proteomic level.
These and similar challenges have led to efforts that extend the multiplexing capabilities of IF markedly, albeit with some logistical hurdles. One of the most technically successful approach has used sequential methods for multiplexing, sometimes referred to as ‘dye-cycling,’ that involve repeated cycles of primary staining (with or without secondary staining), imaging, and then quenching or removing each cycle’s fluorescent reporter. Methods for erasing the signals have included low-pH antibody elutions, high-temperature fluorophore denaturation, antibody stripping, and photo- bleaching.9–16 Recently, a system (‘MultiOmyx™’) using dye- cycling has been commercialized by GE Healthcare and deployed for a few clinical indications.17 Because of the serial steps that have to be performed, the throughput is relatively low, and as with all complicated procedures, quality assurance or validation remains a challenge. Finally, it is worth stating that fluorescence imaging, however accomplished, has some intrinsic limitations. These include moderate sensitivity and dynamic range,18 problems with autofluorescence background, variable reagent and specimen stability, varying quantum yields,19 and potential channel cross-talk.20
Nevertheless, IHC and IF imaging techniques provide unique biological information that in many cases cannot be attained by other methods. Single cells can be visualized with signal fidelity equal to that achievable in the bulk population, such that even rare cell populations can be studied. Individual Hodgkin’s cells can be detected and easily characterized against a dense inflammatory background, a clinically relevant indication.21 All components of an important and complicated microenvironment can be examined simultaneously, providing insight into biological cross-talk present at the tumor–host interface. Perhaps most importantly, the spatial precision of these techniques spans many orders of magnitude, from the subcellular level up to whole organs. The value of such spatial precision increases significantly when multiple proteins can be detected simultaneously and protein co-expression or interaction can be evaluated.
Recent reports of mass spectrometry immunohistochemistry, as described in Nature Methods and Nature Medicine,22,23 have outlined a new approach for achieving simultaneous, high-order multiplexed imaging while avoiding requirements for extended labeling and/or multiple imaging sessions. In the place of fluorophores, both methods use antibodies labeled with isotopically pure metal chelator tags. Such an approach overcomes the limitations of spectral overlap seen with fluorophores, with the narrow and potentially completely resolvable peaks derived from mass measurements of the metals (Figure 1). The two methods differ in how these tags are liberated from the sample, ionized, and detected. Scanning mass cytometry (SMC) is a form of laserablation inductively coupled plasma time-of-flight mass spectrometry that uses a high-intensity laser with spot sizes down to 1μm to liberate tissue into a carrier gas. The carrier gas transports the ablated sample into an argon plasma where it is ionized and subsequently detected. The second technique, multiplexed ion-beam imaging (MIBI) is based on secondary ion mass spectrometry (SIMS) in which the sample is scanned by an ion beam with a sub-micron spot size. The secondary ions that are released are then detected using a magnetic sector mass spectrometer (Figure 2). Using these novel labeling and detection strategies, simultaneous detection of 40 and potentially up to 100 targets can be achieved in formalin-fixed, paraffin-embedded tissue sections, the most common sample type in clinical repositories worldwide.24
Figure 1.
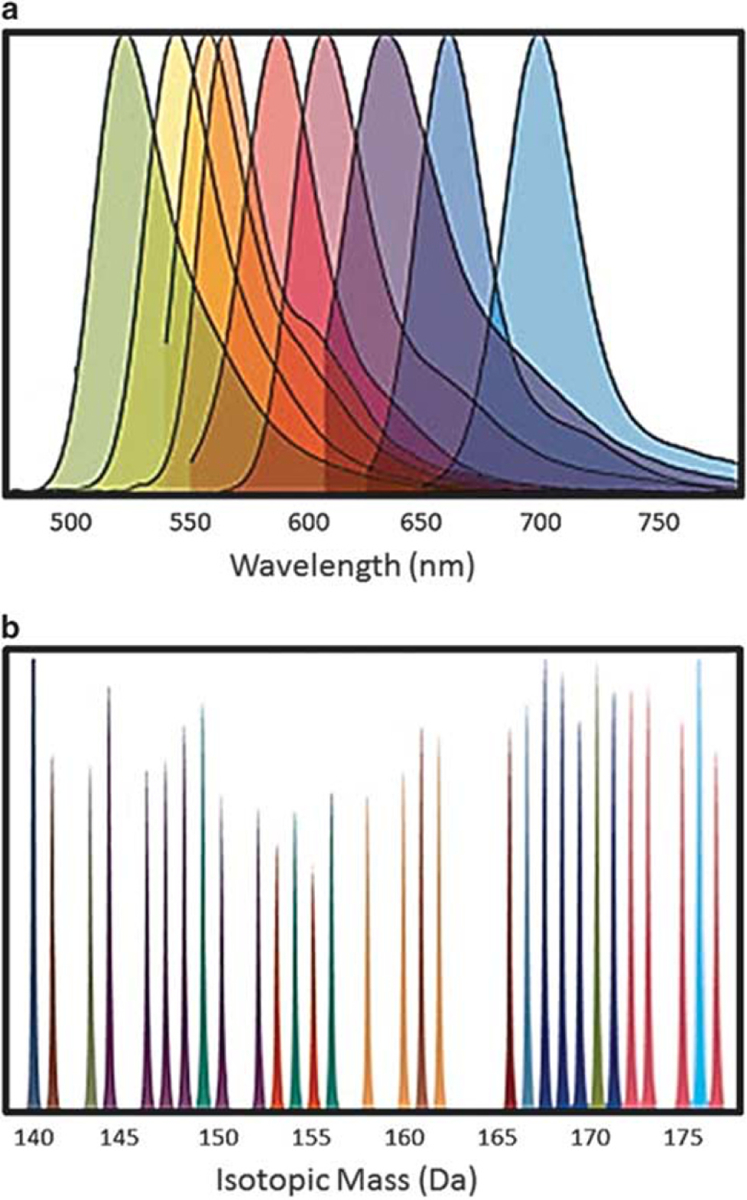
Comparison of overlap potential between fluorophores and metal tag labels. The top panel (a) indicates the spectra of commonly used fluorophores emitting in the visible range. As can be seen, there is considerable overlap between adjacent and even substantially separated fluorescent emissions. Such overlap can be resolved with the use of carefully designed excitation and emission filters and/or with spectral imaging, but does limit the potential for high-level multiplexing. In contrast, the metal tags (lower panel, b) have masses that can be clearly separated with either magnetic sector or time-of-flight-based mass spectrometers, opening up the possibility of multiplexing as many as 100 or so analytes simultaneously.
Figure 2.
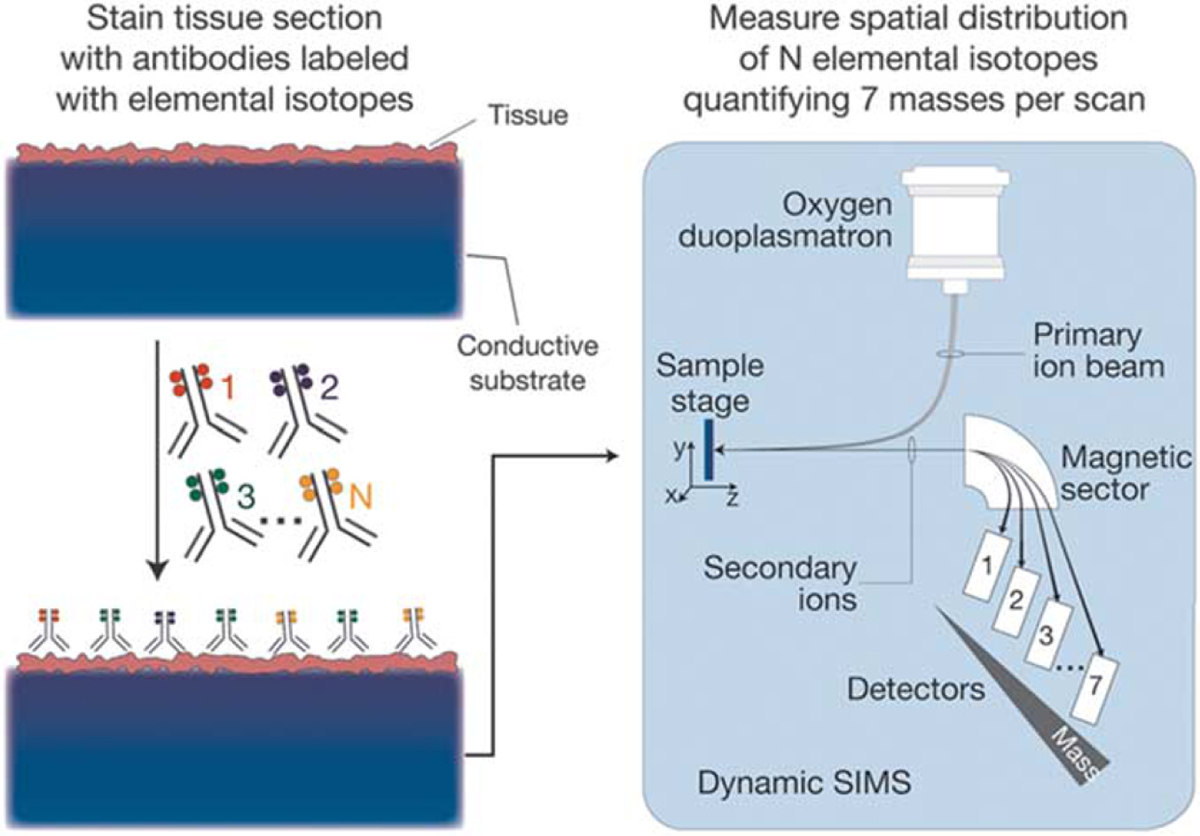
MIBI sample preparation and scanning procedures. Biological specimens, such as FFPE tissue or cell suspensions, are immobilized on a conductive substrate, such as indium tin oxide-coated glass or silicon wafer. Samples are subsequently stained with antibodies conjugated to unique transition element isotope reporters, dried, and loaded under vacuum for MIBI analysis. The sample surface is rasterized with a primary ion beam (O−) that sputters the antibody-specific isotope reporters present on the sample surface as secondary ions. Metal-conjugated antibodies are quantified via replicate scans of the same field of view, during which up to seven metals reporters are measured with each scan (figure courtesy Nature Medicine).23
This ability to visualize the presence, abundance, location, and functional state of so many targets in cells and tissues simultaneously has been described as a true next-generation approach in IHC.25 Important from a practical perspective, all the labels can be applied in a single incubation step, and, with the right instrumentation, can then be detected during a single imaging procedure. However, such a procedure implies that a single antigen retrieval protocol will be adequate for all targets, but this may not necessarily be true for every panel attempted.
Current implementations of both methods have strengths and weaknesses. The maximum field of view before stage movement of SMC is up to 500 μm2, whereas the maximum field of view using MIBI is limited to approximately 100 mm2. Because SMC utilizes TOF detection, all targets are measured simultaneously. In contrast, MIBI currently uses magnetic sector detection, which allows only seven targets to be detected per scan; the mass sensors have to be re-positioned to detect new targets for each additional scan. On the other hand, the overall ionization yield with MIBI ranges between 1% and 10% depending on the isotopic tag, and the sensitivity of MIBI is thus predicted to be around 100 times higher than SMC, in which ionization yields are approximately 0.01%. The resolution of MIBI is currently 200 nm, compared with 1 μm for SMC. Last, where SMC is destructive and ablates the full sample thickness, sample scanning by MIBI only consumes the top 5–10 nm of sample, permitting survey and replicate scanning, and potentially high-resolution axial (depth) imaging as well. Of course, both techniques are under active development, and their properties may change substantially in the future. As our expertise centers around MIBI, the following discussion will focus on how this method has been used and what innovations can be anticipated.
MATERIALS AND METHODS
MIBI analysis is currently being performed using the Nano- SIMS 50L secondary ion mass spectrometer from Cameca (Gennevilliers, France). Samples are mounted in a sample holder, loaded into a vacuum chamber and raster-scanned with a primary ion beam. The impact of this ion beam liberates secondary ions present on the sample surface, and these are subsequently identified and quantified via a magnetic sector mass spectrometer. In the case of multiplexed IHC, samples are scanned with a negatively charged oxygen (O−) duoplasmatron source, which liberates lanthanide adducts of the bound antibodies as positively charged secondary ions. Because the spot size of the current duoplasmatron source is adjustable down to 200 nm, image resolution is on par with standard light microscopy. A positively charged cesium liquid metal ion gun can also be used to measure negative secondary ions, such as carbon, nitrogen, oxygen, and halogens. Current liquid metal ion gun sources are adjustable down to spot sizes of 50 nm, permitting ion imaging with lateral resolution that is at least equivalent to that of confocal microscopy, and because of MIBI’s 5- to 10-nm ablation depth per scan, should outperform confocal systems in terms of axial resolution. This method can be used to visualize the distribution of isotopically labeled metabolic reporters, such as 15N-labeled amino acids or nucleotides, and has been employed elegantly in previous work by others to track protein turnover within the tips of stereocilia in the inner ear and to visualize cardiomyocyte cell turnover.26–28 These impressive results are due in part to the ability of SIMS to achieve parts-per-billion sensitivity with a dynamic range of 105.27,29,30
As noted, MIBI is capable of lateral (x,y) resolution comparable to light microscopy, with sensitivity that appears to be equal to or greater than conventional IF and a dynamic range that may exceed that of IHC by as much as three orders of magnitude. However, one major obstacle to broader use of this platform is its current throughput. Analysis of a 1-mm2 area of tissue at 200 to 300 nm resolution stained with seven markers currently takes 6–7 h, far too slow to be amenable to routine clinical use. However, next-generation primary ion sources, application-specific scanning routines, enhanced metal-labeling density, and time-of-flight (rather than magnetic sector) detection are projected to reduce acquisition times by 3–5 orders of magnitude while increasing the number of simultaneously detectable species to 50–100 targets. Scan routines employed in our proof-of-principle experiments used beam spot sizes of 200 nm. Alternatively, high-resolution scanning could be restricted to regions of interest identified in preliminary survey scans performed using beam diameters 2 μm or larger (equivalent to a 4Xview). A 10-fold increase in spot size would thus reduce scan time by an additional 100-fold. Acquisition times can be further reduced by increasing the amount of metal attached to each antibody. Current conjugation protocols achieve labeling efficiencies of 100–200 metal atoms per antibody. Work is underway to develop new methods that use branch-chain DNA amplification or nanoparticles that should enable attachment of up to 10 000 metal atoms per antibody. The resulting improved sensitivity and dynamic range with these mass-spec methods should enable better quantitation, as well as opening up the possibility for using lower concentrations of antibodies in some situations.
Examples
Work published in Nature Medicine23 provides some examples of MIBI imaging. Figure 3 displays a small focus of intraductal breast carcinoma from a section of FFPE material stained with hematoxylin and a number of metal-tagged antibodies, and imaged via MIBI. The panels shown are not photomicrographs—instead, they were generated by displaying the point-by-point intensity of the mass labels as detected by the magnetic sector sensor, using colors that recapitulate traditional 3,3′-diaminobenzidine-based IHC. The top left panel reflects measurement of actual hematoxylin (ie, not a surrogate stain) abundance, as hematoxylin fortuitously can be directly detected using MIBI because of the high aluminum content present in most hematoxylin preparations. Figure 4 displays a panel of eight antigens detected (out of a complete set of 10 in this imaging session), from three different breast cancer specimens with varying molecular phenotypes. The phenotypes listed down the left border of the image were previously established using standard IHC procedures, and it can be seen that they are recapitulated in the MIBI results shown in the respective image panels. For each tumor specimen, the results are displayed as simulated IF (higher row) or as simulated IHC (lower row). In the case of the simulated IF images, nuclei, highlighted in red, are detected using an antibody directed against double-stranded DNA. Subcellular distribution of all the detected antigens is consistent with their behavior when visualized with conventional imaging methods.
Figure 3.
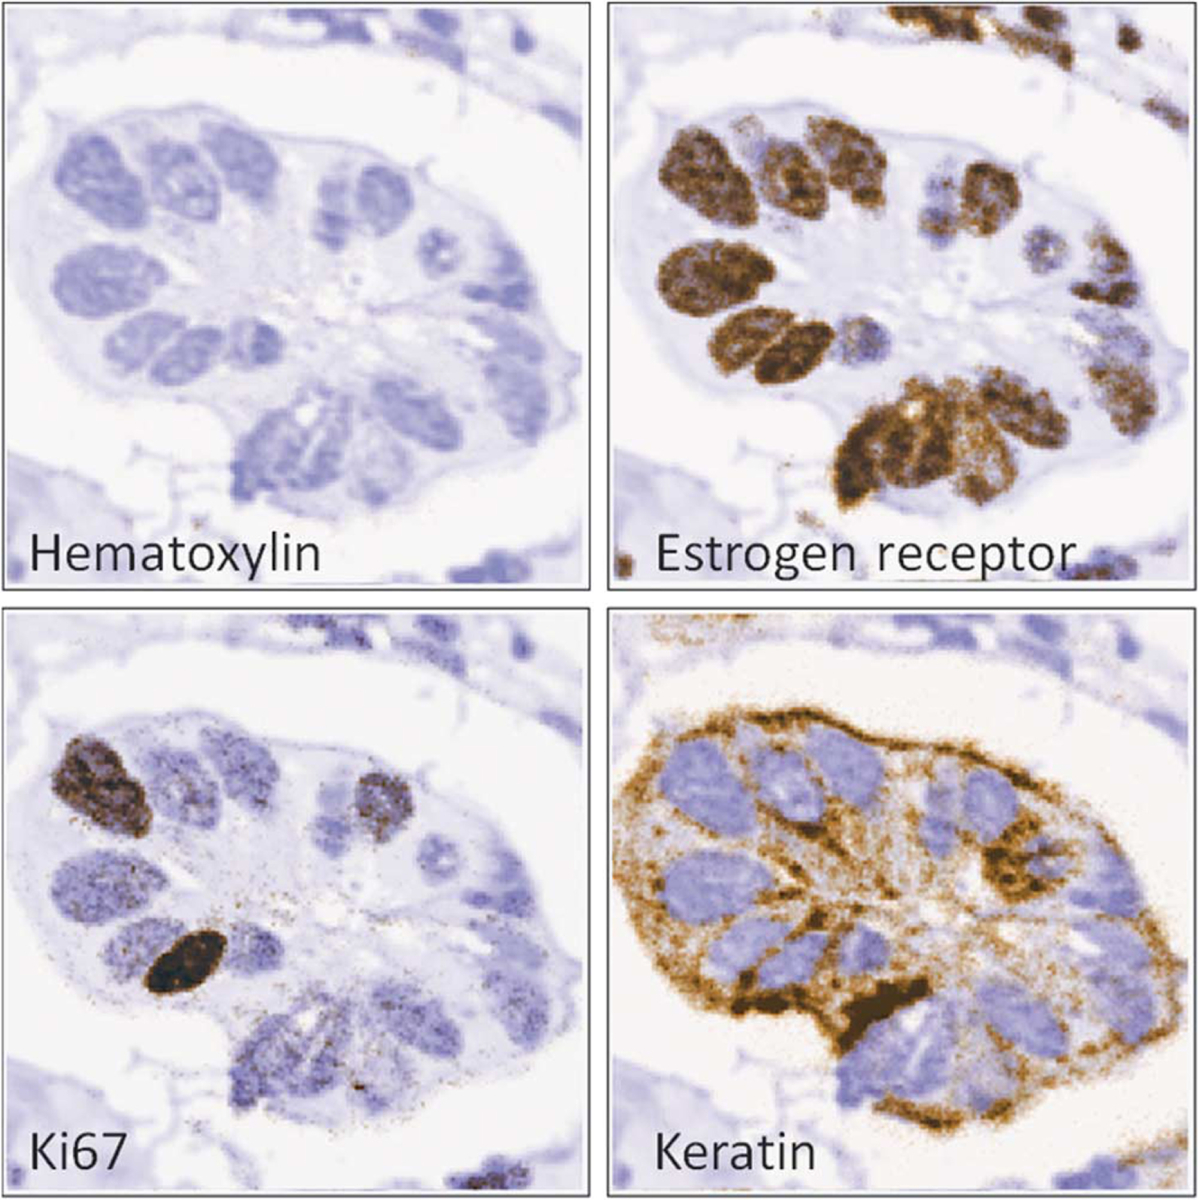
MIBI imaging of FFPE breast cancer. The four panels represent four views of a sample of a FFPE-prepared and multiply labeled specimen of intraductal carcinoma of the breast, obtained during a single scan. The top left panel displays hematoxylin abundance—as the hematoxylin preparations contained aluminum and was consequently detectable by MIBI. The other three panels show the signals of metal-labeled antibodies against ER-alpha, Ki67 and cytokeratin (8/18), commonly interrogated proteins in cancer workups. The metal signals are colored brown and overlain over the hematoxylin signal, colored blue, to replicate the appearance of conventional 3,3′-diaminobenzidine IHC. Field of view = 80 μm2.
Figure 4.
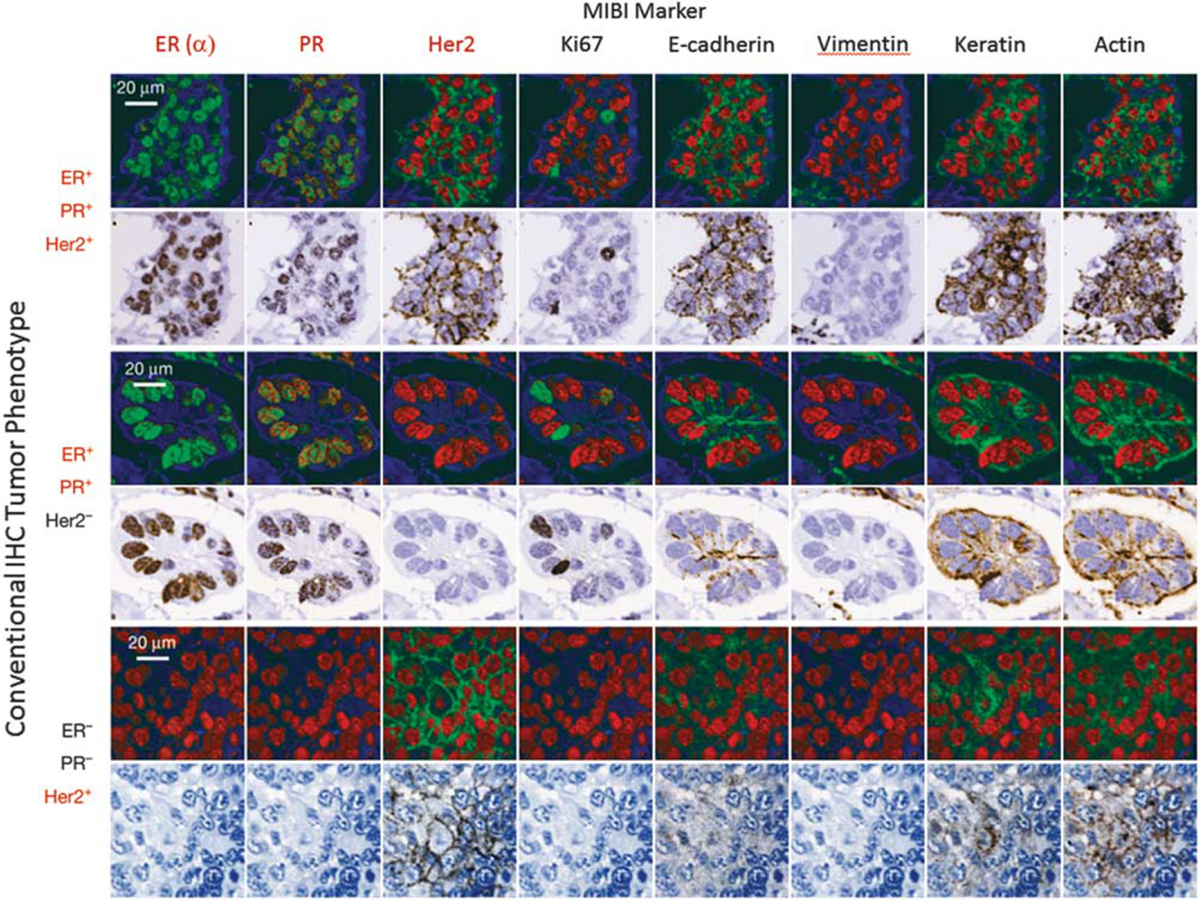
Ten-plex imaging of human breast tumors using MIBI (eight markers shown). Ten antibodies along with hematoxylin signals were used to generate the images in this figure. Eight antibody signals are shown, and the intensities displayed in both fluorescence and brightfield modes. FFPE tissue sections from three different patients were analyzed. The analytes all displayed their anticipated cell-type and subcellular distributions: HER2, ER, and PR are expressed appropriately with respect to the known immunophenotype of each specimen (shown on the left margin). ER-alpha, PR, and Ki67 demonstrate well-demarcated nuclear positivity, whereas e-cadherin and HER2 are membranous; actin, cytokeratin (8/18), and vimentin are cytoplasmic. Keratin is found in the epithelial cells while vimentin is located in the adjacent stromal tissue. Field of view = 80 μm2 (figure courtesy Nature Medicine).23
DISCUSSION
Current breast cancer diagnosis and tissue-based analysis include predictive assays to guide therapy decisions, involving a minimum of three analytes: estrogen receptor (ER), progesterone receptor (PR), and HER2. ER and PR IHC long ago supplanted chemical assays for predicting response to anti-hormonal therapies, owing to improved sensitivity and specificity, with analyses that could be verified to reflect the invasive carcinoma separately from any in situ or benign areas. Ultimately, however, a very low threshold for positivity was set, even though greater ER expression (higher levels and higher percentages) clearly predicts a higher chance of response.31 Her2/ERBB2 IHC quantitative assays identify tumors more likely to respond to trastuzumab (Herceptin). Her2/ERBB2 protein is present on all benign breast epithelium, so that the IHC assay must be carefully controlled to provide a quantitative signal in addition to assessment of a circumferential membranous staining pattern. The nonlinear chemistry of conventional IHC with secondary antibodies and amplified signals has produced an ongoing need for extensive control and validation of the Her2 IHC.32 Ki67 shows an even greater inter-laboratory variability, and is the subject of a current effort for harmonization.33 Many labs also add myoepithelial (SMA), epithelial (CK8/18), and lobular differentiation markers (ECAD) to the workup. Recently, a host of new multi-marker panels have been developed and quantitative measures (rather than just positive vs negative) have been shown to improve prognostic assessments and predictions of response to therapy. ‘IHC4’ uses a combined quantitated ‘H score’ IHC for ER, cell percentages for PR and Ki67, and HER2-staining patterns for prognostic and predictive assessments equal to the best currently available multi-gene molecular assays such as Oncotype DX (Genomic Health, Redwood City, CA, USA).34 A modification of this assay demonstrated improved predictive power through the addition of the IHC marker, BAG1.35 The ‘Mammostrat’ assay (Clarient, Aliso Viejo, CA, USA) uses a panel of five IHC markers (P53, SLC7A5, NRDG1, HTF9C, and CEACAM5).36 Gene expression (mRNA-based) assays using qRT-PCR, array hybridization, and RNA sequence assays have also been developed. The Oncotype DX assay, eg, uses a panel of 21 genes (16 analytical and 5 controls: Ki67, STK15, Survivin, CCNB1, MYBL2, MMP11, CTSL2, HER2, GRB7, GSTM1, CD68, BAG1, ER, PGR, BCL2, SCUBE2, ACTB, GAPDH, RPLPO, GUS, TFRC) to stratify risk of recurrence and to estimate the relative benefit of adjuvant chemotherapy. This list continues to grow with improved understanding of tumor metabolic phenotypes, and patterns of host stroma and immune reaction. New multiplexing techniques that combine tyramide-signal amplification and multispectral imaging are being developed and permit complex analyses of the spatial interactions between tumors and many classes of immune cells, eg, see Stack et al.3
Prostate cancer diagnostics could also benefit from clinically directed multiplexing, as core biopsies could be routinely examined using antibodies defining basal and luminal cells and cells with upregulated racemase,37,38 as well as antibody panels that might survey protein products of the Genomic Health prostate panel of 17 genes that has been developed to stratify patients into progression-risk categories.39 It is difficult to get an accurate evaluation of the false-positive and false-negative rates of prostate core biopsies, but it is clear that the use of combined 3-antibody IHC has become much more frequent and has probably decreased these rates. As medical treatments for low-risk prostate cancer become common, biopsy interpretation for atrophy and basal hyperplasia increasingly requires this IHC combination for optimal evaluation. It seems inevitable that interpretation of biopsies from virtually every site will soon depend on specific molecular localizations to support diagnoses with higher sensitivity and specificity, but also for molecular phenotyping to separate diagnoses into actionable prognostic and therapy-predictive categories.
Full appreciation of high-resolution molecular and spatial data that mass-spectrometry-based techniques are generating will require development of new analytical tools. Currently, interpretation of serial-section-based multiplexed IHC data is typically managed using approaches in which each stain is generally defined as either positive or negative: a summary matrix of results is readily generated and interpreted. If, however, graded positivity based on intensity or cell-percentage-positive scores, or both, are added to the mix, the resulting complexity may prevent adoption in the clinic (even when it has been shown provide the same actionable result as more involved gene expression analyses). On the other hand, performing multiplexing on single slides may to some degree reduce the level of complexity encountered, as in contrast to serial-section-based approaches, no spatial co-registration between marker patterns is required. Nevertheless, to be useful in the clinic, simple tools to assist interpretation, such as Boolean-logic-based pseudocoloring (eg, co-expression of one or more analytes), or automated histogram data display similar to that used for flow cytometry will need to be developed.
It is clear, however, that future highly multiplexed studies will outgrow these somewhat familiar tools. More sophisticated, but still purely molecular (non-spatial), approaches to deal with this scale of data currently include the SPADE tools on Cytobank40 and the ACCENSE method.41 The former emphasizes hierarchical or developmental connections between cell populations, whereas the latter can detect population clusters without hierarchical constraints. To give an idea of the scale of the challenge: CyTOF data processed through ACCENSE provided cell-by-cell high-dimensional information highlighting the probable existence of at least 24 subclasses of CD8+ T cells.41 Now, imagine combining such per-cell molecular complexity with geographic distribution tools. These could be used to characterize the spatial distributions of highly refined cell subclasses, and add information on distances and possible interactions between populations, such as immune cell types, and distinct tumor subregions.42
Some cautions are in order. The explosion of potentially important or actionable biomarkers poses both cost and logical selection challenges—and there are practical methodological issues that need to be addressed as well. Despite years of work to standardize the three IHC assays in common use in breast cancer workups (ER/PR/HER2), there is still ongoing significant and troubling inter-laboratory and intra-laboratory quantitative variability. If these problems cannot be overcome for these three ‘tried-and-true’ biomarkers, it is hard to imagine adding 6, 10, not to mention 30 + new markers to the panel with any robustness. The mass-tagged antibody approaches may make this challenge somewhat easier to manage. Thirty tagged antibodies can be incubated simultaneously, reducing the difficulty, time, and therefore cost to perform the multiplex analysis, although, as noted above, pre-analytical variability and details of antigen retrieval methods will need to be very critically explored. Because of the potential sensitivity, low crosstalk and high dynamic range of the metal-labeled antibody approach, many of the difficulties posed by current approaches to multiplexing are minimized.
Is metal-labeled protein (and other analyte) detection really the ‘next-gen’ step in pathology, as suggested in a recent commentary?25 We think so. As discussed above, multiple analytical challenges arise when using colorimetric or fluorometric reporters for high-level multiplex IHC analysis. Immunoperoxidase staining intensity is nonlinear and often correlates poorly with antigen concentration. Although IF offers improved dynamic range and signal-to-noise ratios, spectral overlap of reporter emission spectra and the need for primary antibodies generated in dissimilar host species ultimately limit its use in highly multiplexed assays. Although dye-cycling methods can be used to obtain information from many 10’s of antibodies, the staining, imaging, destaining process can be technically challenging and time-consuming. The use of metal reporters combined with ion-beam imaging described here is compatible with single-step labeling and imaging, increasing convenience and potential applicability. When it is possible to obtain high-resolution, cell-by-cell, highly multiplexed molecular tumor phenotypes, we anticipate that significant new biological and clinical insights may be gained. For example, spatially resolved evaluation of the activity-state of numerous signaling pathways (eg, via phospho-epitope-sensitive antibodies) in individual cells will be possible. Moreover, the ability to detect multiple molecular species within cells and organelles with ~50-nm resolution (anticipated)—in 3D—could reveal completely new vistas in basic and translational cell science. Taking advantage of the low, near-zero, signal crosstalk between labels, it is intriguing to consider studies that examine the abundance and functional status of multiple nuclear proteins at once, including less familiar targets such as FGFRR2, NFκB/Rel,43 EGF, and FGF.44 In addition, it has not escaped our notice that the methodology we outline here will also permit the multiplexed high-resolution imaging of expressed coding and non-coding RNA molecules.
Can MIBI be made cheap and easy enough to be used routinely? This question depends on a few variables. The actual cost of the primary antibody production will never be as cheap as hematoxylin and eosin, and the instrumentation requirements of SIMS are still prohibitive. Moreover, evaluation of multiple analytes per slide assays will require digital image viewing, with display and analysis tools yet to be optimized for easily transitioning between combinations, and for computer-assisted interpretation. Nevertheless, the incredible value of detailed structure with specific tissue, cellular, and subcellular localization of many different molecular species at once warrants further effort. As outlined above, the instrumentation can be engineered to provide higher throughput and shorter scan times. If single-incubation multiplexed staining cocktails can be deployed for any given clinical scenario, the multiplexing per se would have little impact on the workflow. Benefits include a great reduction in the number of physical tissue sections that have to be prepared, stained, imaged, and correlated, and a corresponding improvement in the quality and detail of pathology analysis.
In conclusion, we suggest that metal-labeled probes coupled with high-resolution imaging platforms will provide spatially resolved, multiple molecule detection while overcoming some of the drawbacks of chromogenic or fluorescence detection methods. Metal-labeling approaches offer high sensitivity and dynamic range, stable labeling, little or no channel cross-talk, and potentially even better than conventional optical microscopy resolution. These techniques are compatible with clinical workflow and can be costeffective. We anticipate that these, along with other highly multiplexed approaches, will yield new insights into basic cell biology, improved understanding of cancer phenotypes, and will have indirect or even direct clinical impact.
ACKNOWLEDGMENTS
This work is funded by the Department of Defense Grant BC132309 -DoD BCRP, NCI IMAT grants 1R21CA183660-01 and 1R33CA183654-01 and funding from the Department of Pathology and Laboratory Medicine, UC Davis.
Footnotes
DISCLOSURE/CONFLICT OF INTEREST
The authors declare no conflict of interest.
References
- 1.Simone NL, Bonner RF, Gillespie JW, et al. Laser-capture micro-dissection: opening the microscopic frontier to molecular analysis. Trends Genet 1998;14:272–276. [DOI] [PubMed] [Google Scholar]
- 2.Lubieniecka JM, Nielsen TO. cDNA microarray-based translational research in soft tissue sarcoma. J Surg Oncol 2005;92:267–271. [DOI] [PubMed] [Google Scholar]
- 3.Stack EC, Wang C, Roman KA, et al. Multiplexed immunohistochemistry, imaging, and quantitation: A review, with an assessment of Tyramide signal amplification, multispectral imaging and multiplex analysis. Methods 2014;70:46–58. [DOI] [PubMed] [Google Scholar]
- 4.Rimm DL. What brown cannot do for you. Nat Biotechnol 2006;24:914–916. [DOI] [PubMed] [Google Scholar]
- 5.Camp RL, Chung GG, Rimm DL. Automated subcellular localization and quantification of protein expression in tissue microarrays. Nat Med 2002;8:1323–1327. [DOI] [PubMed] [Google Scholar]
- 6.Fountaine TJ, Wincovitch SM, Geho DH, et al. Multispectral imaging of clinically relevant cellular targets in tonsil and lymphoid tissue using semiconductor quantum dots. Mod Pathol 2006;19:1181–1191. [DOI] [PubMed] [Google Scholar]
- 7.Bearman GH, Mahadevan-Jansen A, Levenson RM ) Spectral Imaging: Instrumentation, Applications, and Analysis III, San Jose, CA, 2005. [Google Scholar]
- 8.Levenson R, Beechem J, McNamara G. Spectral imaging in preclinical research and clinical pathology. Anal Cell Pathol (Amst) 2012;35: 339–361. [DOI] [PMC free article] [PubMed] [Google Scholar]
- 9.Tsurui H, Nishimura H, Hattori S, et al. Seven-color fluorescence imaging of tissue samples based on Fourier spectroscopy and singular value decomposition. J Histochem Cytochem 2000;48:653–662. [DOI] [PubMed] [Google Scholar]
- 10.Glass G, Papin JA, Mandell JW. SIMPLE: a sequential immunoperoxidase labeling and erasing method. J Histochem Cytochem 2009;57:899–905. [DOI] [PMC free article] [PubMed] [Google Scholar]
- 11.Wählby C, Erlandsson F, Bengtsson E, et al. Sequential immunofluorescence staining and image analysis for detection of large numbers of antigens in individual cell nuclei. Cytometry B Clin Cytom 2002;47:32–41. [PubMed] [Google Scholar]
- 12.Pirici D, Mogoanta L, Kumar-Singh S, et al. Antibody elution method for multiple immunohistochemistry on primary antibodies raised in the same species and of the same subtype. J Histochem Cytochem 2009, 57:567–575. [DOI] [PMC free article] [PubMed] [Google Scholar]
- 13.Friedenberger M, Bode M, Krusche A, et al. Fluorescence detection of protein clusters in individual cells and tissue sections by using toponome imaging system: sample preparation and measuring procedures. Nat Protoc 2007;2:2285–2294. [DOI] [PubMed] [Google Scholar]
- 14.Schubert W, Bonnekoh B, Pommer AJ, et al. Analyzing proteome topology and function by automated multidimensional fluorescence microscopy. Nat Biotechnol 2006;24:1270–1278. [DOI] [PubMed] [Google Scholar]
- 15.Schubert W, Gieseler A, Krusche A, et al. Toponome mapping in prostate cancer: detection of 2000 cell surface protein clusters in a single tissue section and cell type specific annotation by using a three symbol code. J Proteome Res 2009;8:2696–2707. [DOI] [PubMed] [Google Scholar]
- 16.Zrazhevskiy P, Gao X. Quantum dot imaging platform for single-cell molecular profiling. Nat Commun 2013;4:1619. [DOI] [PMC free article] [PubMed] [Google Scholar]
- 17.Clarke GM, Zubovits JT, Shaikh KA, et al. A novel, automated technology for multiplex biomarker imaging and application to breast cancer. Histopathology 2014;64:242–255. [DOI] [PubMed] [Google Scholar]
- 18.Zimak J, Schweller RM, Duose DY, et al. Programming in Situ Immunofluorescence Intensities through Interchangeable Reactions of Dynamic DNA Complexes. Chembiochem 2012;13:2722–2728. [DOI] [PMC free article] [PubMed] [Google Scholar]
- 19.Shcherbatyuk GV, Inman RH, Ghosh S. Anomalous photo-induced spectral changes in CdSe = ZnS quantum dots. J App Phys 2011;110: 053518–1–6. [Google Scholar]
- 20.Neher R, Neher E. Optimizing imaging parameters for the separation of multiple labels in a fluorescence image. J Microsc 2004;213:46–62. [DOI] [PubMed] [Google Scholar]
- 21.Hollman-Hewgley D, Lazare M, Bordwell A, et al. A single slide multiplex assay for the evaluation of classical Hodgkin lymphoma. Am J Surg Pathol 2014;38:1193–1202. [DOI] [PubMed] [Google Scholar]
- 22.Giesen C, Wang HA, Schapiro D, et al. Highly multiplexed imaging of tumor tissues with subcellular resolution by mass cytometry. Nat Methods 2014;11:417–422. [DOI] [PubMed] [Google Scholar]
- 23.Angelo M, Bendall SC, Finck R, et al. Multiplexed ion beam imaging of human breast tumors. Nat Med 2014;20:436–442. [DOI] [PMC free article] [PubMed] [Google Scholar]
- 24.Blow N Tissue preparation: Tissue issues. Nature 2007;448:959–963. [DOI] [PubMed] [Google Scholar]
- 25.Rimm DL. Next-gen immunohistochemistry. Nat Methods 2014;11:381–383. [DOI] [PubMed] [Google Scholar]
- 26.Senyo SE, Steinhauser ML, Pizzimenti CL, et al. Mammalian heart renewal by pre-existing cardiomyocytes. Nature 2013;493:433–436. [DOI] [PMC free article] [PubMed] [Google Scholar]
- 27.Zhang D- S, Piazza V, Perrin BJ, et al. Multi-isotope imaging mass spectrometry reveals slow protein turnover in hair-cell stereocilia. Nature 2012;481:520–524. [DOI] [PMC free article] [PubMed] [Google Scholar]
- 28.Steinhauser ML, Bailey AP, Senyo SE, et al. Multi-isotope imaging mass spectrometry quantifies stem cell division and metabolism. Nature 2012;481:516–519. [DOI] [PMC free article] [PubMed] [Google Scholar]
- 29.Lechene C, Hillion F, McMahon G, et al. High-resolution quantitative imaging of mammalian and bacterial cells using stable isotope mass spectrometry. J Biol 2006;5:20. [DOI] [PMC free article] [PubMed] [Google Scholar]
- 30.Williams P Biological imaging using secondary ions. J Biol 2006; 5:18. [DOI] [PMC free article] [PubMed] [Google Scholar]
- 31.Allred DC, Carlson RW, Berry DA, et al. NCCN task force report: estrogen receptor and progesterone receptor testing in breast cancer by immunohistochemistry. J Natl Compr Canc Netw 2009;7 (Suppl 6):S1–S21, quiz S2–3. [DOI] [PubMed] [Google Scholar]
- 32.Wolff AC, Hammond ME, Schwartz JN, et al. American Society of Clinical Oncology/College of American Pathologists guideline recommendations for human epidermal growth factor receptor 2 testing in breast cancer. J Clin Oncol 2007;25:118–145. [DOI] [PubMed] [Google Scholar]
- 33.Luporsi E, Andre F, Spyratos F, et al. Ki-67: level of evidence and methodological considerations for its role in the clinical management of breast cancer: analytical and critical review. Breast Cancer Res Treat 2012;132:895–915. [DOI] [PMC free article] [PubMed] [Google Scholar]
- 34.Cuzick J, Dowsett M, Pineda S, et al. Prognostic value of a combined estrogen receptor, progesterone receptor, Ki-67, and human epidermal growth factor receptor 2 immunohistochemical score and comparison with the Genomic Health recurrence score in early breast cancer. J Clin Oncol 2011;29:4273–4278. [DOI] [PubMed] [Google Scholar]
- 35.Afentakis M, Dowsett M, Sestak I, et al. Immunohistochemical BAG1 expression improves the estimation of residual risk by IHC4 in postmenopausal patients treated with anastrazole or tamoxifen: a TransATAC study. Breast Cancer Res Treat 2013;140:253–262. [DOI] [PubMed] [Google Scholar]
- 36.Bartlett JM, Thomas J, Ross DT, et al. Mammostrat as a tool to stratify breast cancer patients at risk of recurrence during endocrine therapy. Breast Cancer Res 2010;12:R47. [DOI] [PMC free article] [PubMed] [Google Scholar]
- 37.Sung MT, Jiang Z, Montironi R, et al. Alpha-methylacyl-CoA racemase (P504S)/34betaE12/p63 triple cocktail stain in prostatic adenocarcinoma after hormonal therapy. Hum Pathol 2007;38:332–341. [DOI] [PubMed] [Google Scholar]
- 38.Daoud NA, Li G, Evans AJ, et al. The value of triple antibody (34betaE12 + p63 + AMACR) cocktail stain in radical prostatectomy specimens with crushed surgical margins. J Clin Pathol 2012;65: 437–440. [DOI] [PubMed] [Google Scholar]
- 39.Klein EA, Cooperberg MR, Magi-Galluzzi C, et al. A 17-gene Assay to Predict Prostate Cancer Aggressiveness in the Context of Gleason Grade Heterogeneity, Tumor Multifocality, and Biopsy Undersampling. Eur Urol 2014;66:550–560. [DOI] [PubMed] [Google Scholar]
- 40.Qiu P, Simonds EF, Bendall SC, et al. Extracting a cellular hierarchy from high-dimensional cytometry data with SPADE. Nat Biotechnol 2011;29:886–891. [DOI] [PMC free article] [PubMed] [Google Scholar]
- 41.Shekhar K, Brodin P, Davis MM, et al. Automatic Classification of Cellular Expression by Nonlinear Stochastic Embedding (ACCENSE). Proc Natl Acad Sci USA 2014;111:202–207. [DOI] [PMC free article] [PubMed] [Google Scholar]
- 42.Chang AY, Bhattacharya N, Mu J, et al. Spatial organization of dendritic cells within tumor draining lymph nodes impacts clinical outcome in breast cancer patients. J Transl Med 2013;11:242. [DOI] [PMC free article] [PubMed] [Google Scholar]
- 43.Sovak MA, Bellas RE, Kim DW, et al. Aberrant nuclear factor-kappaB/Rel expression and the pathogenesis of breast cancer. J Clin Invest 1997;100:2952–2960. [DOI] [PMC free article] [PubMed] [Google Scholar]
- 44.Planque N Nuclear trafficking of secreted factors and cell-surface receptors: new pathways to regulate cell proliferation and differentiation, and involvement in cancers. Cell Commun Signal 2006;4:7. [DOI] [PMC free article] [PubMed] [Google Scholar]