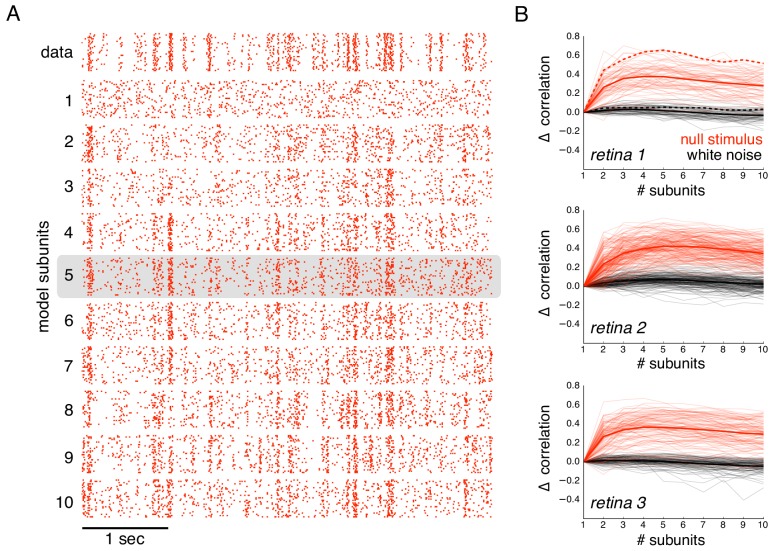
Figure 6. Subunits improve prediction of responses to null stimuli.
(A) Rasters for recorded responses of an OFF parasol cell to 30 presentations of a 5 s long null stimulus (top row). Predictions of models with increasing (1 to 10) number of subunits (subsequent rows). (B) The change in correlation (relative to the correlation obtained with one subunit) between PSTH for recorded and predicted responses with different numbers of subunits across three preparations. Spatial kernels were estimated from 24 min of non-repeated white noise stimulus, with scales and output nonlinearity estimated from the first 5 s of the repeated stimulus. Performance on the last 5 s of the repeated stimulus was averaged over 10 fits, each with a random subsample of the non-repeated white noise stimulus. Individual OFF parasol cells (thin lines) and population average (thick lines) for the null stimulus (red) and white noise (black). The cell in (A) is indicated with dashed lines.

