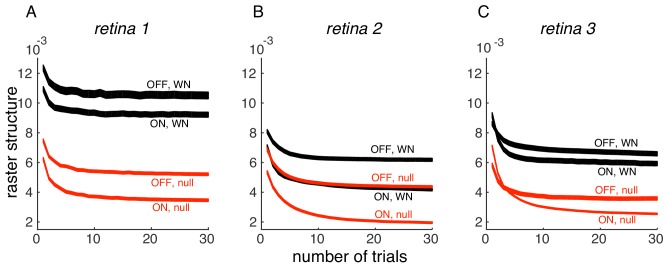
Author response image 1. Convergence of PSTH variance.
(A) PSTH variance (y-axis), averaged over ON and OFF populations for white noise (black) and null stimulus (red) as a function of the number of randomly sampled trials (x-axis). Line thickness corresponds to +/- 1 s.d. in estimation error. Same retina as in Figure 5, main paper. (B, C) Same as A, for two other retinas.

