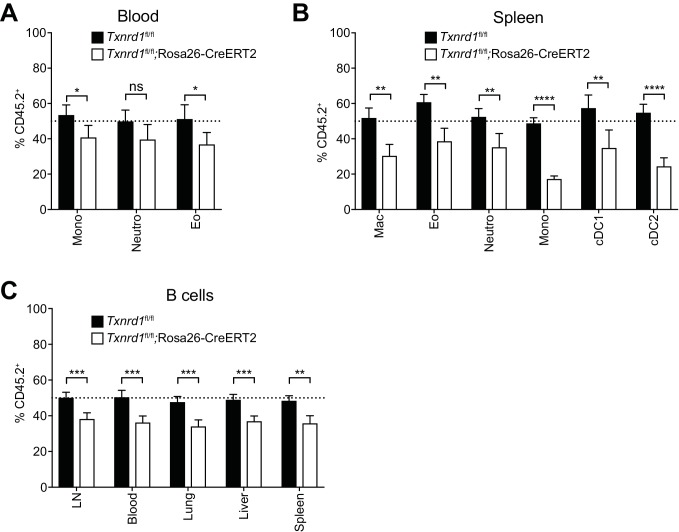
Figure 1. The Trx1 system is largely dispensable for the development and homeostatic maintenance of myeloid cells.
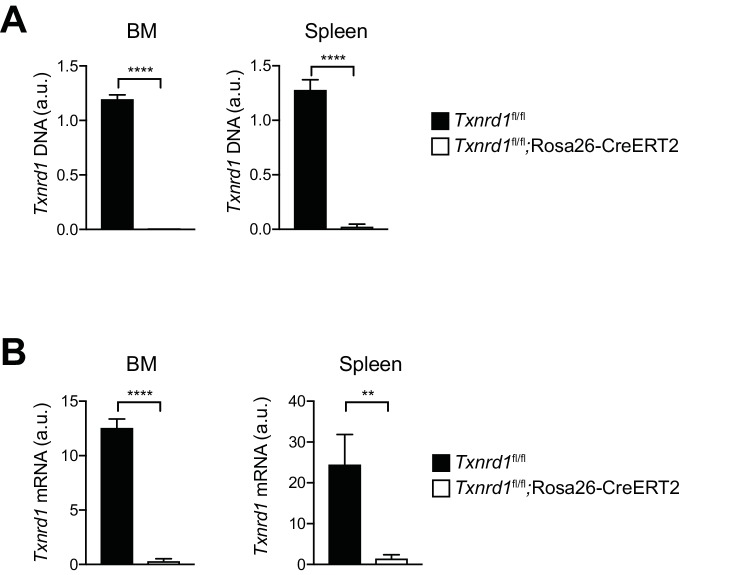
(A–E) Txnrd1fl/fl;Rosa26-CreERT2 mice and Txnrd1fl/fl littermates were injected with TAM to delete the Txnrd1 gene and were analyzed by flow cytometry 2 weeks later. Depicted are the total numbers or percentages of the indicated populations in the thymus (A), bone marrow (BM; B), blood (C), lungs (D), spleen (E); n = 4–5 mice). (F–I) Lethally irradiated WT mice (CD45.1+CD45.2+) were reconstituted with a 1:1 mixture of WT (CD45.1+) and TAM-treated Txnrd1fl/fl;Rosa26-CreERT2 (CD45.2+) bone marrows (or Txnrd1fl/fl as control). After reconstitution, the percentage of donor CD45.2+ cells among the indicated cell populations was determined by flow cytometry (n = 4–5 mice). (F) Schematic showing the experimental setup. (G) Depicted are the CD45.2+ percentages of total TCRβ+ T cells in the indicated organs. (H, I) The percentages of CD45.2+ cells among the indicated myeloid populations in the bone marrow (BM; H) and lungs (I) are shown. DP, CD4+CD8+ double positive thymocytes; CD4+ T, CD4+ single positive thymocytes; CD8+ T, CD8+ single positive thymocytes; Eo, eosinophils; Neutro, neutrophils; Mono, monocytes; DC, dendritic cells; AlvMac, alveolar macrophages; cDC1/2, type 1/2 conventional dendritic cells; Mac, macrophages; LN, lymph nodes. Bar graphs show mean + standard deviation (A–E, G–I). Data are representative of three independent experiments. For each panel, a representative experiment with biological replicates (A–E,G–I) is shown. Student’s t test (two-tailed, unpaired) was used for the comparison of two groups (A–E, G–I): *, p≤0.05; **, p≤0.01; ***, p≤0.001; ****, p≤0.0001; ns, not significant.


