

Summary
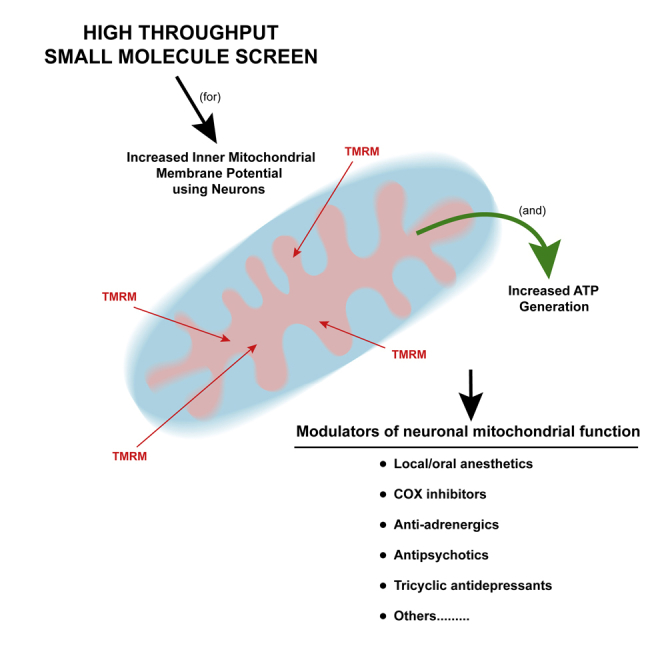
We developed a high-throughput assay for modulators of mitochondrial function in neurons measuring inner mitochondrial membrane potential (ΔΨm) and ATP production. The assay was used to screen a library of small molecules, which led to the identification of structural/functional classes of mitochondrial modulators such as local anesthetics, isoflavones, COXII inhibitors, adrenergic receptor blockers, and neurotransmitter system effectors. Our results show that some of the isolated compounds promote mitochondrial health, enhance oxygen consumption rate, and protect neurons against toxic insults found in the cellular environment of Alzheimer disease. These studies offer a set of compounds that may provide efficacy in protecting the mitochondrial system in neurodegenerative disorders.
Subject Areas: Chemistry, Biochemistry, Molecular Neuroscience
Graphical Abstract
Highlights
-
•
Dozens of small molecules identified that enhance neuronal mitochondrial function
-
•
The small molecules promote mitochondrial health and enhance oxygen consumption
-
•
They protect neurons from toxic insults associated with neurodegenerative diseases
Chemistry; Biochemistry; Molecular Neuroscience
Introduction
Mitochondrial function in neurons is critical for generating ATP (Brand and Nicholls, 2011, Vafai and Mootha, 2012), producing and detoxifying reactive oxygen species (ROS) (Zorov et al., 2014), buffering Ca2+, mediating cell apoptosis, and synthesizing and releasing neurotransmitters (Duchen, 2000). Owing to these and other critical functions within high energy-demanding neurons, impairments in the mitochondrial system are associated very broadly with brain disorders (Connolly et al., 2018, Cai and Tammineni, 2016, Lezi and Swerdlow, 2012). These impairments include reduced mitochondrial numbers, membrane potential (ΔΨm), respiratory capacity, and ATP production, coupled with increased fragmentation and decreased synaptic function (Wang et al., 2009, Cai and Tammineni, 2017, Perez Ortiz and Swerdlow, 2019). Enhancing the function of neuronal mitochondria with small molecule therapeutics may offer effective treatment for these diseases (Alam et al., 2015, Moreira et al., 2010). However, prior screens used to identify such potential therapeutics have employed established cell lines, yeast, or fibroblasts (Kitami et al., 2012, Mortibouys et al., 2013). Given the unique architecture and physiology of neurons and the established differences in mitochondria across cell types (Calvo et al., 2016), screens for neuronal mitotherapeutics are best performed in neurons themselves. Thus we have searched for chemical enhancers of neuronal mitochondrial function using mammalian primary neurons to conduct a high-throughput screen (HTS).
We report here the development of an assay and results from a small molecule screen using neurons cultured from mouse brain and measuring ΔΨm, which provides the driving force on ATP synthase. Secondary screens for ATP production were employed to funnel the initial set of molecules, which were then tested for their effects on mitochondrial respiration and aspects of mitochondrial dynamics, including mitochondrial length and circularity, the latter being a morphological measure of mitochondrial health. The final set of molecules were subsequently shown to protect mitochondrial function from the insults of increased oxidative stress and an Alzheimer-like cellular environment produced in a genetic mouse model of Alzheimer disease. Strikingly, several classes of molecules had efficacy across these assays, including local anesthetics, estrogen agonists, isoflavones, and tricyclic antidepressants. These molecules offer starting points to probe the intricacies of the neuronal mitochondrial system and for potential mitotherapeutics.
Results
Primary Neuron Assays for Inner Mitochondrial Potential and ATP Generation
The inner mitochondrial membrane potential (ΔΨm) and proton gradient generated by proton pumps during oxidative phosphorylation (OXPHOS) provide the energy to drive ATP synthesis. ΔΨm is widely used to measure the functional status and integrity of mitochondria (Connolly et al., 2018, Perry et al., 2011, Zorova et al., 2018). Hyperpolarization of ΔΨm is associated with higher energy demand, as found in differentiating neuroblasts (Voccoli and Colombaioni, 2009), dividing versus quiescent cells (Huang, 2002), and developmentally active cells (Daniele et al., 2017, Medina et al., 2002). Depolarization of ΔΨm is associated with diseased cells, aging, apoptosis, and toxic insults (Lezi and Swerdlow, 2012, Nadanaciva et al., 2011, Nicholls, 2004, Wagner et al., 2008). We measured ΔΨm and then ATP production in cultured neurons to identify chemicals that increase the functional output of mitochondria.
The fluorescent dye tetramethylrhodamine, methyl ester (TMRM) was used at non-quenching concentrations for measuring ΔΨm because of its fast equilibration time, low nonspecific binding to the plasma membrane, and reduced toxicity compared with the alternatives of TMRE, Rh123, JC-1, and DiOC6 (Figures 1A, S1A, and S1B) (Connolly et al., 2018, Perry et al., 2011). We performed multiple control experiments before and during our screen to validate, optimize, and provide quality control for the TMRM assay including (1) identifying quenching and non-quenching TMRM concentrations in primary neurons (Figures S1A and S1B) and selecting the non-quenching, 10 nM concentration of TMRM for further experiments; (2) establishing that the necessary wash steps did not alter the integrity of the delicate plated neurons and are required for accurate TMRM fluorescence readings (Figures S1C and S1D) and measuring TMRM fluorescence from neurons treated with positive, neutral, and negative compounds to show their distinct effects (Figure S1E); (3) measuring TMRM fluorescence across 384-well plates treated with DMSO vehicle alone to identify and adjust for well position effects (Figures S2A and S2B); (4) monitoring DMSO-treated wells during the screen to track variability between replicates and across the eight different source plates used for the screen (Figures S2C and S2D); and (5) developing appropriate statistical procedures for data normalization and hit selection (Figure S3). We further optimized a luciferase-based ATP assay as an orthogonal screen to help extract artifacts obtained from the TMRM screen and to monitor the relationship between ΔΨm measured with TMRM and ATP concentration in primary cultured neurons (Figure S4).
Figure 1.

TMRM and ATP Assays and Screens for Small Molecule Modulators of Neuronal Mitochondrial Function
(A–A″) Primary mouse cortical neurons loaded with TMRM and imaged 24 h later. The two leftmost images (20X) show the cell density at DIV14 (A) and fluorescent mitochondria in cell bodies and neurites (A′); the image (60X) at the right (A″) illustrates neuronal mitochondria at a higher power including the intense, perinuclear mitochondria. n = nucleus. Scale bar, 400 μm for (A and A′) and 20 μm for (A″).
(B) High-throughput screening pipeline for small molecule enhancers of neuronal mitochondrial function. Primary screen: Primary neurons were isolated, plated, and cultured to DIV13 and loaded with TMRM before compounds were added with a pin-tool. At 4 and 24 h after compound addition the neurons were washed and TMRM fluorescence was read. Orthogonal screen: TMRM hits selected from the primary screen were rescreened and tested for their ability to enhance neuronal ATP production in an orthogonal screen. Functional analysis: TMRM/ATP positive hits were clustered by structural similarity. Representative hits from main structural clusters were further assayed for dose response, effects on oxygen consumption (OCR), mitochondrial morphology, neurite sprouting, and protection to neurons against insults associated with neurodegenerative diseases.
(C–D″) (C and D) Scatterplots of normalized Z scores (Z) of TMRM fluorescence, (C′ and D′) as zoomed in (orange shading in C and D) to eliminate most toxic and autofluorescent reads, and (C″ and D″) effect size of TMRM signals at 4- (C–C″) and 24-h incubation (D–D″). Z score = (valuecompound-μplate)/σplate. Effect size = (valuecompound - μplate)/μplate. Z score and effect size (E) values for each compound were calculated per plate using population statistics from four replicate plates. We used the population of “inactive” compound-treated wells as the control; see Figures S3A and S3B for details on the “non-DMSO-control” statistical approach. Results are plotted as means ± SEM from the quadruplicates. Putative hits that increased intracellular TMRM intensity above the plate mean (μplate) by 3σ for the inner wells and by 2.5σ for the outer wells were selected for rescreen. Distribution histograms of Z score and effect size are shown on the right side of (C′, C″, D′, and D″). Arrowheads indicate the subpopulation identified as putative hits.
(E and F) Orthogonal screen of putative TMRM hits measuring ATP production; 135 putative hits with effects at 24 h (red) from the primary screen were retested alongside 134 randomly selected non-hit compounds (black) and 40 DMSO controls (gray). The compound effect at 24-h incubation on TMRM fluorescence and ATP production was normalized to DMSO controls on the same plate in the rescreen. Data were calculated as (valuecompound - μDMSO)/μDMSO. The 135 putative 24-h hits (red) plus 134 non-hits (black) are shown in the plot. Each point represents the mean from four replicate wells. (E) Correlation plot of 24-h TMRM fluorescence from the primary screen and rescreen. Linear regression fitted to values generated from the plotted 269 compounds (black line, R2 = 0.63). The distribution of normalized TMRM effect size in wells treated with putative hits (red), non-hits (black), and DMSO (gray) is shown along the abscissa. One-way ANOVA followed by Dunn's post hoc was used for comparisons with the DMSO control and non-hit groups. ∗∗∗∗p < 0.0001. (F) Correlation plot of compound effects on ATP production and TMRM fluorescence. The distribution of compound effect size on TMRM fluorescence and ATP production after 24-h incubation is shown in the histograms across the abscissa and ordinate, respectively. The putative 24-h TMRM hits are labeled in red, non-hits in black, and DMSO-treated wells in gray. Linear regression fitted to values generated from the plotted 269 compounds (black line, R2 = 0.46). One-way ANOVA followed by Dunn's post hoc was used for comparing with the DMSO control and non-hit groups. ∗∗∗∗p < 0.0001. Compounds were selected as TMRM/ATP hits if the effect size for ATP generation was greater than 15% (>3σDMSO, dashed lines in E and F) in the orthogonal screen in addition to being confirmed as TMRM hits.
For the primary screen, we incubated 13 days in vitro (DIV13) primary neurons with 10 nM TMRM for 90 min to reach equilibrium before pin-tooling compounds from the Spectrum Collection from MicroSource. This library contains 2,400 structurally diverse compounds, the majority of which are marketed drugs or compounds in clinical trials. All compounds were assayed in quadruplicate at 12.5 μM, and mitochondria-localized TMRM fluorescence (Figures 1A–1A″) was measured at 4 and 24 h to identify compounds that have acute or delayed effects on ΔΨm (Figure 1B). We predicted that acute hits might be compounds that directly and rapidly target the electron transport chain to modulate the efficiency of OXPHOS, whereas compounds with a delayed effect might modulate gene expression or signaling pathways to enhance mitogenesis and/or OXPHOS activities. From the 2,400 tested compounds, 16 (0.6%) were selected as putative hits increasing TMRM fluorescence at 4 h and 135 compounds (5.6%) increasing TMRM fluorescence at 24 h. Eleven of the compounds exhibited significant effects at both 4 and 24 h (>3 Z scores for the inner wells, >2.5 Z scores for the outer wells, Figures 1C–1D″).
We rescreened all 4- and 24-h TMRM hits alongside 40 DMSO control wells and 134 TMRM-negative compounds randomly selected from the original screen in a blind manner. There was a correlation of compound effect size on 24-h TMRM fluorescence between the primary screen and rescreen (R2 = 0.63, Figure 1E). Of the 135 compounds 120 were confirmed as hits enhancing TMRM fluorescence at 24 h (89%). Of these, 112 (93%; Table S1) proved positive using the orthogonal assay for ATP production, elevating ATP levels by ∼15% (>3 Z scores) compared within within-plate DMSO controls (Figure 1F). Although the correlation of ATP and TMRM effect sizes was more modest (R2 = 0.46), the putative hits significantly enhanced TMRM fluorescence and ATP production compared with non-hit compounds or DMSO-treated controls (Figure 1F). Only two of the 16 (13%) compounds that elevated TMRM fluorescence at 4 h increased ATP levels. To probe the relationship between TMRM signal and ATP production, we compared the correlation coefficient between the TMRM fluorescence of all rescreened compounds and ATP production at 4 and 24 h. We found a very weak correlation between these two parameters for 4 h of incubation (R2 = 0.16, p < 0.0001, Figure S4C) and a modest correlation (R2 = 0.46, p < 0.0001, Figure 1F) for 24 h, indicating a general trend between the measured whole-well TMRM signal and higher energetics of the neuronal population. We focused our subsequent studies on hits selected after a 24-h incubation with neurons given the stronger relationship between TMRM fluorescence and ATP generation. Using this incubation time, the results indicate that increased ΔΨm is a good, inexpensive surrogate for detecting elevated levels of ATP within neurons.
Structural and Functional Diversity and Potency of Modulators of Mitochondrial Function
We found that many of the confirmed 24-h TMRM/ATP hits were structurally related and grouped them using hierarchical clustering and Tanimoto similarities into several clusters (Figure 2). We also discovered that some of the structural clusters contain compounds with a similar therapeutic use (Figures 2 and S5–S7; Table S2). Surprisingly, nine of the hit compounds are topical/local anesthetics (primarily in Cluster 3, orange shading in Figure 2) that increase neuronal mitochondrial ΔΨm and elevate ATP. Owing to this novel finding, we included representatives from this group in subsequent experiments (lidocaine, benoxinate, dyclonine). Although only two isoflavone compounds were identified (Cluster 4, green), genistein was reported by Ding et al. (2011) to increase ΔΨm in primary cortical neurons treated with Aβ peptide. Therefore, we employed genistein in later experiments as a putative positive control compound. Cluster 4 also contains many steroid hormone receptor modulators and two COX inhibitors (gray). Estrogen derivatives were previously shown to contain neuro- and mitochondria-protective activity (Mortibouys et al., 2013, Sherman and Bang, 2018, Grimm et al., 2014, Irwin et al., 2008, Nilsen et al., 2007), but the mitochondrial effect of COX inhibitors was unexpected. Thus, we chose celecoxib for further characterization. Cluster 5 is composed of three indole alkaloids that have alpha-blocker activity (brown). One of them, yohimbine was previously found to be neuroprotective by inducing the NRF2-mediated antioxidant response (patent WO2012149478A3). Therefore, we included yohimbine in follow-up experiments as a potential positive control and to explore this activity further. Cluster 6 contains a collection of structurally similar alpha/beta-blockers for the treatment of high blood pressure and heart diseases (anti-adrenergics, brown), from which we chose carvedilol and naftopidil for further tests. We also highlight the interesting identification of several anti-psychotics and classic tricyclic antidepressants (pink), anti-cholinergics (purple), and anti-dopaminergic/anti-serotoninergic compounds (yellow) in Clusters 7 and 8, whose unanticipated functional modulation of mitochondria made them intriguing compounds for additional experiments. We added the antibiotic phenyl-aminosalicylate (Cluster 3, blue) and two well-known antiparkinsonian agents (Cluster 9, anti-cholinergic, purple) for some subsequent experiments to begin exploring how this rich set of structurally and functionally diverse compounds modulates the function of neuronal mitochondria.
Figure 2.

Hits from the Small Molecule Screen for Neuronal Modulators of Mitochondrial Function
Weighted Pair Group Method with Arithmetic Mean (WPGMA) clustering of the 112 confirmed TMRM/ATP 24-h hits into nine groups based on the Euclidean distance of Tanimoto similarities of their Morgan fingerprints with a cutoff at value 1.45 (red line). Representative chemical scaffolds for some clusters are highlighted in red. Shading: orange = local/topical anesthetics; green = isoflavones; gray = COX inhibitors; brown = alpha/beta blockers; pink = antipsychotics and tricyclic antidepressants; purple = anti-cholinergics; yellow = anti-dopaminergic/serotonergic compounds.
Dose response assays (Figures S5–S7; Table S2) of selected compounds revealed that the EC50's for TMRM fluorescence and/or ATP enhancement were generally between 0.1 and 5 μM. Effect sizes were measured between 15% and 30%. Nearly all compounds, apart from yohimbine, exhibited inverted-U-shaped responses suggesting mitochondrial toxicity at high concentrations. Neurons are highly sensitive cells, and most compounds have detrimental effects at high concentrations.
Mitochondrial Functional Modulators Potentiate Respiration
The effects of the compounds on ATP generation suggested that they may increase mitochondrial respiration. To test this possibility, we selected yohimbine (indole alkaloid) and doxepin (tricyclic antidepressant) for the necessary and more complex, absolute oxygen consumption rate (OCR) experiments. OCR at baseline and in response to excess ADP/substrate (State3/3u) was measured and normalized to protein content (Salabei et al., 2014, Sims and Anderson, 2008) using primary neurons presented with compounds for 24 h. Primary neurons exposed to yohimbine or doxepin showed a weak, non-significant, but consistent trend toward an increased basal rate of respiration, potentially due to a modest increase in mitochondrial function and/or content (Figures 3A–3B′). More importantly, we observed a significant increase of State 3 and 3u respiration stimulated by either Complex I or Complex II substrates in mitochondria from cultured neurons treated with yohimbine (Figures 3A–3B′), and a significant increase with Complex I substrates for doxepin. We also took advantage of the water solubility of yohimbine to administer this compound to mice in drinking water across a period of 7 months. A similar respiratory increase was observed in mitochondria isolated from the whole brains of animals chronically treated with yohimbine (Figures 3C and 3D). We calculated the respiratory control ratios (RCRs, State 3/4o) to provide a broad index of mitochondrial function (Brand and Nicholls, 2011, Rogers et al., 2011). State 3 respiration measures the maximal ability of mitochondria for substrate oxidation and ATP generation. State 4o, with OCR measured in response to oligomycin challenge, measures proton leak. The ratio between these states is influenced by most functions of OXPHOS, thus providing a net measure of the tightness between respiration and phosphorylation. Yohimbine treatment significantly increased RCR with both Complex I and II substrates with both mitochondria from cultured neurons and isolated brain mitochondria (Figures 3A′, 3B′, 3C′, and 3D′). Doxepin weakly increased RCR using Complex I, but not II, substrates in cultured neurons (Figures 3A′–3B′). Collectively, the enhanced State 3 respiration and RCR with yohimbine and the weaker effects of doxepin indicate more efficient substrate oxidation, electron transport, coupling to OXPHOS, and a lower proton leak, indicating a higher respiration capacity and efficiency in the treated mitochondria. Moreover, we previously reported that the anesthetic dyclonine produces beneficial effects in similar cell culture and in vivo experiments (Varkuti et al., 2020). Thus, representative compounds from three classes of functional mitochondrial modulators—indole alkaloids, tricyclic antidepressants, and local/topical anesthetics—all enhance neuronal mitochondrial function. These modulators may be acting directly on mitochondria or indirectly by stimulating cell signaling pathways that influence mitochondrial function (Sherman and Bang, 2018, Tsvetkov et al., 2010). However, the functional changes on mitochondria instilled by the tested compounds must be enduring and become independent of cytoplasmic signaling pathways, because increased function persists in permeabilized neurons and in mitochondria purified from cells.
Figure 3.

Effects of Compounds on Mitochondrial Function
(A–B′) Mitochondrial respiration in primary neurons exposed to compounds identified as mitochondrial functional enhancers from the screen. Before OCR measurements, DIV13 neurons were treated for 24 h with DMSO (0.1%) or the compounds (10 μM). Neurons were gently permeabilized using 25 μg/mL saponin (Sa). OCR measured from permeabilized neurons was displayed in the “middle point” mode showing a single OCR rate for each measurement period. Two measurements were performed under each condition (Base = baseline respiration, S3 = ADP/substrate-stimulated State 3 respiration, S4o = oligomycin-induced State 4 respiration) except for S3u (the FCCP-stimulated uncoupled State 3 respiration), which consisted of only one measurement. The right bar graph in each panel compares the averaged OCR from the two measurements in each condition among the DMSO- and compound-treated groups. The statistics shown were generated using two-way repeated measure ANOVA with the single control and the experimental groups. Sa = saponin, ADP = adenosine diphosphate, P = pyruvate, M = malate, Succ = succinate, Oligo = oligomycin, FCCP = carbonyl cyanide-p-trifluoromethoxyphenylhydrazone, AA = antimycin, R = rotenone. Note: We recently reported the experimental results for dyclonine (Varkuti et al., 2020), performed in parallel with yohimbine and doxepin as reported here. Thus the DMSO data shown are replicated from Varkuti et al. (2020). Statistical significance data were obtained from the DMSO control and all three experimental groups (yohimbine, doxepin, dyclonine).
(C–D′) Respiration of mitochondria isolated from brain neurons. Brain mitochondria were isolated from C57BL/6J animals administered either compound-supplemented (5 mg/kg yohimbine) or standard water for 7 months starting at 2 months of age. State 3 respiration was stimulated by addition of ADP (1 mM). Complex I substrates pyruvate and malate (P/M) or the Complex II substrate succinate (Succ) were preincluded in the assay buffer at 10 mM before the measurement of baseline respiration to maintain the healthy state of isolated mitochondria. OCR measured from isolated brain mitochondria is displayed in the “point-to-point mode” showing a series of OCR rates across each measurement period. The right bar graph in each panel compared the OCR value of the first measured point in each condition between the water- and compound-treated groups. Total protein was determined using the BCA assay (Bicinchoninic Assay) and used to normalize OCR into pmol O2/min/μg total protein. Results in all panels are plotted as the mean ± SEM (n = 11–12). Data were analyzed by two-way repeated measure ANOVA followed by Bonferroni's multiple comparison tests. ∗p < 0.05, ∗∗∗p < 0.001, ∗∗∗∗p < 0.0001 compared with corresponding controls.
Modulators of Neuronal Mitochondrial Function Alter Mitochondrial Morphology
To determine whether enhanced mitochondrial function is associated with mitochondrial morphological changes, we used a high-content assay developed in parallel to monitor aspects of mitochondrial dynamics in primary cultured neurons that conditionally express (Cre recombinase-dependent) mitochondrial-tagged GFP and cytosolic tdTomato reporters (Varkuti et al., 2020). We monitored two aspects of neuritic mitochondrial dynamics: the health of mitochondria as measured by the average circularity of axonal mitochondria, because defective mitochondria targeted for mitophagy become circular in shape, and the balance between fission/fusion measured by the average length of dendritic mitochondria. We also determined whether the compounds induced neurite sprouting by measuring the total area of neurites within the collected images (see Methods). Figure 4 illustrates the results of surveying a collection of functional modulators selected from five different structural clusters (Figure 2), quantified as robust Z scores relative to DMSO-treated control neurons. All the compounds tested showed a trend toward promoting more oblong mitochondria after 24 h, and they exhibited significant potency (Z score < −2.0) compared with the control after 48 h of treatment. Notably, the identified mitochondrial OCR enhancers yohimbine, dyclonine, and doxepin exhibited robust effects. These results provide evidence that the functional modulators promote healthier mitochondria using the morphological surrogate of circularity.
Figure 4.

Effects of Compounds on Mitochondrial Morphology and Neurite Sprouting
(A–A‴ and B) Morphological changes in primary neuronal mitochondria due to treatment with mitochondrial functional modulators. (A-A''') Using fluorescent reporters expressed in the mitochondria (mito-GFP, second column of images) and cytosol (cytosolic-tdTomato, third column of images), the circularity and length of mitochondria and the area of neurites in images were quantified after segmentation (e.g., extraction of neuritic area with ImageJ, fourth column of images). DIV13 neurons were treated with selected TMRM/ATP hit compounds or DMSO vehicle control and imaged after 24 or 48 h. Scale bar, 20 μm. (B) Neuritic mitochondria, which vary in length, were classed into axonal mitochondria (0.5 μm ≤ length ≤1.4 μm) and dendritic mitochondria (length ≥2.4 μm) based on our prior studies (Varkuti et al., 2020). The circularity of axonal mitochondria and the length of dendritic mitochondria were measured using the GFP signal and the neurite area from segmenting tdTomato fluorescence. These parameters were normalized as robust Z scores relative to in-plate, DMSO control wells. Data are presented as means ± SEM (n = 12 wells).
The tested compounds also promoted the lengthening of dendritic mitochondria to Z scores ≥ 2.0 after 48 h of treatment. This observation is consistent with a report that mitochondrial fusion and fragmentation are associated with higher and lower ΔΨm values, respectively, in neuroblasts and stable cell lines (Sherman and Bang, 2018, Voccoli and Colombaioni, 2009). Yohimbine, dyclonine, pimozide, and penfluridol were also observed to increase neuritic area after 48 h of treatment.
Neuronal Mitochondrial Modulators Provide Protection against Insults Associated with Neurodegenerative Disorders
Given the strong relationship between mitochondrial dysfunction and brain disorders, we tested a group of functional mitochondrial modulators for their potential to protect against two neurodegeneration-associated insults: neurons subjected to increased oxidative stress and those expressing Alzheimer-causing gene variants (neurons from 3XTG mice). Adding tert-butyl hydroperoxide to the cultures to increase oxidative stress severely reduced TMRM fluorescence at concentrations above 50 μM and led to complete cell death at concentrations >100 μM (Figure 5). Eight of the 10 compounds tested provided protection to the ΔΨm from the toxic effects of increased oxidative stress (Figures 5A–5A″). Primary neurons isolated and cultured from 3XTG mice to DIV23 exhibited a ∼20% reduction in TMRM fluorescence normalized to protein content per well when compared with C57Bl/6J neurons (Figures 5B–5B″). All compounds tested significantly increased ΔΨm in the presence of the insult to the level observed for control B6 neurons (Figure 5B"). Remarkably, many of the compounds tested protect against both insults, including yohimbine, genistein, dyclonine, benoxinate, lidocaine, phenyl-4-amino salicylate, pimozide, and doxepin (Figures 5A″ and 5B″).
Figure 5.

Neuronal Mitochondrial Modulators Offer Protection against Insults Associated with Neurodegenerative Diseases
(A–A″) Mitochondrial modulators protect against the decline in ΔΨm caused by increased oxidative stress. Primary forebrain neurons dissociated from C57BL/6J mice were plated into wells of four replicate, 384-well plates at the same density. At DIV13, TMRM was loaded at 10 nM along with 55 μM Luperox and a collection of mitochondrial modulators. Following 24-h treatment, the fluorescence was measured and normalized as %TMRM fluorescence relative to the within-plate DMSO controls. (A) The dose response effect of t-butyl hydrogen peroxide, a relatively stable peroxide used to increase oxidative stress in cultured neurons. DIV14 neuronal cultures in 384-well plates were treated with 16 different hydrogen peroxide concentrations from 10 nM to 400 μM, alongside paired DMSO controls, and whole-well TMRM fluorescence was assayed 24 h later. Points represent the mean ± SEM of three independent plates, each concentration tested in duplicate/plate; 24-h treatment with Luperox at 50 μM significantly reduced the whole-well TMRM fluorescence by ∼40% in DIV14 neuronal cultures. Nearly complete cell death, shown as no intracellular TMRM accumulation, was observed in cells treated with Luperox at 100 μM or greater. (A′) Heatmap and summarized bar graph (A″) of TMRM fluorescence from untreated and hydrogen peroxide-treated neuronal cultures in response to DMSO (0.1%, control) and mitochondrial functional modulators from five structural clusters. The normalized TMRM fluorescence in the heatmap is the average per well across four replicates. Compounds that provided full neuroprotective effects are those that elevated the ΔΨm depression observed in peroxide-challenged neurons to the level observed in neurons untreated with Luperox (red dashed line). Compounds at the concentration used that provided full protection to neurons included yohimbine, genistein, dyclonine, benoxinate, doxepin, and pimozide. Results are presented as mean ± SEM. n = 12 wells.
(B–B″) Mitochondrial modulators protect against the decline in ΔΨm in primary neurons cultures made from 3XTG mice. Primary forebrain neurons dissociated from C57BL/6J (B6) and 3XTG mice were plated into wells of the upper and lower halves of four replicate 384-well plates at the same density. At DIV22, TMRM was loaded at 10 nM and the modulators were added. Following 24-h treatment, the well fluorescence was measured and normalized to total protein content to correct for potential differences in cell and/or neurite density between B6 and 3XTG neuronal cultures. (B) A significant reduction (∼20%) in average normalized TMRM fluorescence was detected in the 3XTG cultures compared with the co-plated B6 neurons when treated only with 0.1% DMSO carrier. (B′) Heatmaps and summarized bar graphs (B″) of TMRM fluorescence from both B6 and 3XTG neuronal cultures in response to DMSO (0.1%, control) and the battery of mitochondrial functional modulators. The normalized TMRM fluorescence in the heatmap is the average per well across four replicates. All compounds provided full neuroprotective effects, indicated as those that elevated the ΔΨm depression observed in 3TG neuronal cultures to the level observed in B6 neurons treated with DMSO (red dashed line). Results are presented as mean ± SEM (n = 24 wells). Data (A″ and B″) were analyzed by one-way ANOVA followed by Dunnett's multiple comparison tests. ∗∗∗p < 0.001 (red), comparing drug-treated wells in the presence of the insult with control wells without the insult. ∗∗p < 0.01, ∗∗∗∗p < 0.0001 (black), comparing drug-treated wells to control wells in the presence of the insult.
Discussion
Our mitochondria-targeted TMRM/ATP high-throughput assay and screen using cultured primary neurons successfully identified multiple structural and functional clusters of compounds that enhance the function of neuronal mitochondria. The most surprising observation made concerns the large number and diversity of the compounds identified that potentiate mitochondrial function. Included among the modulators are the hormone derivatives yohimbine and genistein, which, consistent with published results, provided beneficial effects on mitochondrial function and overall neuronal health. These compounds stand out as positive controls for use in future HTSs that assay mitochondrial function. The most interesting and novel categories of hits include topical/local anesthetics as represented by dyclonine, classic tricyclic antidepressants as represented by doxepin, and the anti-psychotics as represented by pimozide and penfluridol. These results offer the prospect that molecules of these classes may offer protection against diseases that are associated with neuronal mitochondrial dysfunction. In addition, they invite the speculation that the therapeutic effects of tricyclic antidepressants and anti-psychotics might include the functional modulation of brain mitochondria. On the technical side, our results show the feasibility of screening large libraries of compounds for effects on mitochondrial function directly in neurons, providing a more biologically relevant HTS platform for use in brain disease research.
Elucidating the mechanisms of action that these molecules have on the mitochondrial system in neurons is a long-term task, but prior studies offer a few intriguing possibilities. Estrogen derivatives (Cluster 4) and the indole alkaloids (Cluster 5) have been reported to contain potent neuro- and mitochondrial-protective activity. This may occur through receptor-independent antioxidant activity, including the reduction of glutamate-induced lipid peroxidation and attenuation of endogenous and exogenous ROS, and/or by receptor-dependent (ERα, ERβ) anti-apoptotic activity, including the regulation of brain-derived neurotropic factor and the mitochondrial targeting of Bcl-2 and Bcl-xL, etc. (Klinge, 2008, Simpkins et al., 2008). Recently studies have revealed the extranuclear localization of estrogen receptors (ERα, ERβ) within mitochondria and the transport of exogenous estrogens into mitochondria (Chen et al., 2008, Psarra and Sekeris, 2008).
Given that the MicroSource Spectrum compound library consists of a large number of approved drugs, the mechanism of action for the hit compounds has already been explored in the context of the drug's original development. For instance, dyclonine and benoxinate are both local anesthetics that bind reversibly to activated sodium channels decreasing permeability and sensation. Doxepin as a tricyclic antidepressant is a known inhibitor of serotonin and norepinephrine uptake, also inhibiting histamine receptors to relieve local or generalized itching. The atypical anti-psychotic, pimozide, is a selective inhibitor of type 3 dopamine receptors thus decreasing dopaminergic transmission. It is possible, although unlikely, that these mechanisms of action perhaps funnel to some common effector of mitochondrial function and dynamics. However, given the diversity of the compounds identified along with a documented mechanism of action, we think it more likely that multiple known and unknown pathways exist that modulate the complexities of mitochondrial system dynamics and function.
A major future question prompted by this discussion is whether the mitochondrial modulators act directly on mitochondria to produce the observed effects or whether they work indirectly through various signaling systems. None of the data obtained so far address this important question, including the oxygen consumption experiments using mitochondria isolated from the brains of treated mice, because the modulators may have altered cellular signaling to instill long-term changes in mitochondrial function. One way to approach this unknown is to determine whether the modulators produce acute effects on the function of isolated mitochondria, assayed by either ATP generation or oxygen consumption experiments. The identification of distinct mitochondrial protein targets could be approached using photoaffinity-labeled mitochondrial modulators followed by proteomics experiments.
In summary, we have developed a high-throughput assay using primary neuronal cultures for mitochondrial function. Assay development using this cell type is critical for finding small molecule effectors of mitochondrial function given the unique structure and physiology of neurons. A library screen identified a remarkably diverse set of compounds that modulate mitochondrial function that, in addition, alter the mitochondrial dynamic properties of circularity (health) and length and offer protection to the mitochondrial system against two insults associated with neurodegeneration: increased oxidative stress and the neuronal environment found in a mouse model for Alzheimer disease. This set of molecules offers a unique starting point for developing mitotherapeutics to protect the neuronal mitochondrial system from the toxicity associated with neurodegenerative disorders and to probe the intricacies of the mitochondrial system in neurons.
Limitations of the Study
The majority of this study utilized primary neurons from the mouse, which provide an imperfect model for neurons in vivo. Future studies will be directed toward in vivo efficacy of the compounds on the neuronal mitochondrial system. Although many of the compounds identified are known drugs with identified molecular targets, it remains unknown whether these same cellular targets are the ones that produce the observed effects on the mitochondrial system.
Methods
All methods can be found in the accompanying Transparent Methods supplemental file.
Acknowledgments
The research was supported by NIH grants 1R01MH109957 and 3R01MH109957-03S1 to R.L.D. Additional support was provided by a training grant in Alzheimer's Drug Discovery from the Lottie French Lewis Fund of the Community Foundation for Palm Beach and Martin Counties, the Coleman Hogan Fund for Memory Research, the Esther B. O’Keeffe Foundation, and major contributions from community philanthropists including W. Meyer, A. Dreyfoos, and P. McGraw.
Author Contributions
Z.L. and R.L.D. conceptualized the project and designed most of the experiments. Z.L. developed the assays described; performed the screens, rescreens, and orthogonal screens; and performed cheminformatics and dose response, oxygen consumption, and experiments employing 3xTg neurons and increased oxidative stress. She was assisted by Y.G. R.P. treated mice with compounds and isolated the mitochondria. B.H.V. and M.K. developed and performed experiments employing high-content imaging. They also re-analyzed all the primary and orthogonal screening data. T.K. assisted with chemical and biological informatics. Z.L. and R.L.D. wrote the initial draft of the manuscript; B.H.V. and M.K. drafted revised versions of the manuscript. The final versions were edited and approved by all available authors.
Declaration of Interests
A US patent application related to some of the findings presented has been filed.
Published: March 27, 2020
Footnotes
Supplemental Information can be found online at https://doi.org/10.1016/j.isci.2020.100931.
Supplemental Information
References
- Alam N.M., Mills W.C., 4th, Wong A.A., Douglas R.M., Szeto H.H., Prusky G.T. A mitochondrial therapeutic reverses visual decline in mouse models of diabetes. Dis. Model. Mech. 2015;8:701–710. doi: 10.1242/dmm.020248. [DOI] [PMC free article] [PubMed] [Google Scholar]
- Brand M.D., Nicholls D.G. Assessing mitochondrial dysfunction in cells. Biochem. J. 2011;435:297–312. doi: 10.1042/BJ20110162. [DOI] [PMC free article] [PubMed] [Google Scholar]
- Cai Q., Tammineni P. Alternations in mitochondrial quality control in Alzheimer's disease. Front. Cell. Neurosci. 2016;10:24. doi: 10.3389/fncel.2016.00024. [DOI] [PMC free article] [PubMed] [Google Scholar]
- Cai Q., Tammineni P. Mitochondrial aspects of synaptic dysfunction in Alzheimer’s disease. J. Alzheimers Dis. 2017;57:1087–1103. doi: 10.3233/JAD-160726. [DOI] [PMC free article] [PubMed] [Google Scholar]
- Calvo S.E., Clauser K.R., Mootha V.K. MitoCarta2.0: an updated inventory of mammalian mitochondrial proteins. Nucleic Acids Res. 2016;44:D1251–D1257. doi: 10.1093/nar/gkv1003. [DOI] [PMC free article] [PubMed] [Google Scholar]
- Chen J.Q., Brown T.R., Yager J.D. Mechanisms of hormone carcinogenesis: evolution of views, role of mitochondria. Adv. Exp. Med. Biol. 2008;630:1–18. [PubMed] [Google Scholar]
- Connolly N.M.C., Theurey P., Adam-Vizi V., Bazan N.G., Bernardi P., Bolaños J.P., Culmsee C., Dawson V.L., Deshmukh M., Duchen M.R. Guidelines on experimental methods to assess mitochondrial dysfunction in cellular models of neurodegenerative diseases. Cell Death Differ. 2018;25:542–572. doi: 10.1038/s41418-017-0020-4. [DOI] [PMC free article] [PubMed] [Google Scholar]
- Daniele J.R., Esping D.J., Garcia G., Parsons L.S., Arriaga E.A., Dillin A. High-throughput characterization of region-specific mitochondrial function and morphology. Sci. Rep. 2017;7:6749. doi: 10.1038/s41598-017-05152-z. [DOI] [PMC free article] [PubMed] [Google Scholar]
- Ding B., Yuan L., Yu H., Li L., Ma W., Bi Y., Feng J., Xiao R. Genistein and folic acid prevent oxidative injury induced by β-amyloid peptide. Basic Clin. Pharmacol. Toxicol. 2011;108:333–340. doi: 10.1111/j.1742-7843.2010.00661.x. [DOI] [PubMed] [Google Scholar]
- Duchen M.R. Mitochondria and calcium: from cell signalling to cell death. J. Physiol. 2000;529:57–68. doi: 10.1111/j.1469-7793.2000.00057.x. [DOI] [PMC free article] [PubMed] [Google Scholar]
- Grimm A., Schmitt K., Lang U.E., Mensah-Nyagan A.G., Eckert A. Improvement of neuronal bioenergetics by neurosteroids: implications for age-related neurodegenerative disorders. Biochim. Biophys. Acta. 2014;1842:2427–2438. doi: 10.1016/j.bbadis.2014.09.013. [DOI] [PubMed] [Google Scholar]
- Huang S.G. Development of a high throughput screening assay for mitochondrial membrane potential in living cells. J. Biomol. Screen. 2002;7:383–389. doi: 10.1177/108705710200700411. [DOI] [PubMed] [Google Scholar]
- Irwin R.W., Yao J., Hamilton R.T., Cadenas E., Brinton R.D., Nilsen J. Progesterone and estrogen regulate oxidative metabolism in brain mitochondria. Endocrinology. 2008;149:3167–3175. doi: 10.1210/en.2007-1227. [DOI] [PMC free article] [PubMed] [Google Scholar]
- Kitami T., Logan D.J., Negri J., Hasaka T., Tolliday N.J., Carpenter A.E., Spiegelman B.M., Mootha V.K. A chemical screen probing the relationship between mitochondrial content and cell size. PLoS One. 2012;7:e33755. doi: 10.1371/journal.pone.0033755. [DOI] [PMC free article] [PubMed] [Google Scholar]
- Klinge C.M. Estrogenic control of mitochondrial function and biogenesis. J. Cell Biochem. 2008;105:1342–1351. doi: 10.1002/jcb.21936. [DOI] [PMC free article] [PubMed] [Google Scholar]
- Lezi E., Swerdlow R.H. Mitochondria in neurodegeneration. Adv. Exp. Med. Biol. 2012;942:269–286. doi: 10.1007/978-94-007-2869-1_12. [DOI] [PMC free article] [PubMed] [Google Scholar]
- Medina J.M., Lopez-Mediavilla C., Orfao A. Flow cytometry of isolated mitochondria during development and under some pathological conditions. FEBS Lett. 2002;510:127–132. doi: 10.1016/s0014-5793(01)03260-4. [DOI] [PubMed] [Google Scholar]
- Moreira P.I., Zhu X., Wang X., Lee H.G., Nunomura A., Petersen R.B., Perry G., Smith M.A. Mitochondria: a therapeutic target in neurodegeneration. Biochim. Biophys. Acta. 2010;1802:212–220. doi: 10.1016/j.bbadis.2009.10.007. [DOI] [PMC free article] [PubMed] [Google Scholar]
- Mortibouys H., Aasly J., Bandmann O. Ursocholanic acid rescues mitochondrial function in common forms of familial Parkinson's disease. Brain. 2013;136:3038–3050. doi: 10.1093/brain/awt224. [DOI] [PubMed] [Google Scholar]
- Nadanaciva S., Murray J., Wilson C., Gebhard D.F., Will Y. High-throughput assays for assessing mitochondrial dysfunction caused by compounds that impair mtDNA- encoded protein levels in eukaryotic cells. Curr. Protoc. Toxicol. 2011 doi: 10.1002/0471140856.tx0311s48. Chapter 3, Unit 3. 11. [DOI] [PubMed] [Google Scholar]
- Nicholls D.G. Mitochondrial membrane potential and aging. Aging Cell. 2004;3:35–40. doi: 10.1111/j.1474-9728.2003.00079.x. [DOI] [PubMed] [Google Scholar]
- Nilsen J., Irwin R.W., Gallaher T.K., Brinton R.D. Estradiol in vivo regulation of brain mitochondrial proteome. J. Neurosci. 2007;27:14069–14077. doi: 10.1523/JNEUROSCI.4391-07.2007. [DOI] [PMC free article] [PubMed] [Google Scholar]
- Perez Ortiz J.M., Swerdlow R.H. Mitochondrial dysfunction in Alzheimer's disease: role in pathogenesis and novel therapeutic opportunities. Br. J. Pharmacol. 2019 doi: 10.1111/bph.14585. [DOI] [PMC free article] [PubMed] [Google Scholar]
- Perry S.W., Norman J.P., Barbieri J., Brown E.B., Gelbard H.A. Mitochondrial membrane potential probes and the proton gradient: a practical usage guide. Biotechniques. 2011;50:98–115. doi: 10.2144/000113610. [DOI] [PMC free article] [PubMed] [Google Scholar]
- Psarra A.M., Sekeris C.E. Steroid and thyroid hormone receptors in mitochondria. IUBMB Life. 2008;60:210–223. doi: 10.1002/iub.37. [DOI] [PubMed] [Google Scholar]
- Rogers G.W., Brand M.D., Petrosyan S., Ashok D., Elorza A.A., Ferrick D.A., Murphy A.N. High throughput microplate respiratory measurements using minimal quantities of isolated mitochondria. PLoS One. 2011;6:e21746. doi: 10.1371/journal.pone.0021746. [DOI] [PMC free article] [PubMed] [Google Scholar]
- Salabei J.K., Gibb A.A., Hill B.G. Comprehensive measurement of respiratory activity in permeabilized cells using extracellular flux analysis. Nat. Protoc. 2014;9:421–438. doi: 10.1038/nprot.2014.018. [DOI] [PMC free article] [PubMed] [Google Scholar]
- Simpkins J.W., Yang S.H., Sarkar S.N., Pearce V. Estrogen actions on mitochondria––physiological and pathological implications. Mol. Cell. Endocrinol. 2008;290:51–59. doi: 10.1016/j.mce.2008.04.013. [DOI] [PMC free article] [PubMed] [Google Scholar]
- Sims N.R., Anderson M.F. Isolation of mitochondria from rat brain using Percoll density gradient centrifugation. Nat. Protoc. 2008;3:1228–1239. doi: 10.1038/nprot.2008.105. [DOI] [PubMed] [Google Scholar]
- Sherman S.P., Bang A.G. High-throughput screen for compounds that modulate neurite growth of human induced pluripotent stem cell-derived neurons. Dis. Model. Mech. 2018 doi: 10.1242/dmm.031906. [DOI] [PMC free article] [PubMed] [Google Scholar]
- Tsvetkov A.S., Miller J., Arrasate M., Wong J.S., Pleiss M.A., Finkbeiner S. A small-molecule scaffold induces autophagy in primary neurons and protects against toxicity in a Huntington disease model. Proc. Natl. Acad. Sci. U S A. 2010;107:16982–16987. doi: 10.1073/pnas.1004498107. [DOI] [PMC free article] [PubMed] [Google Scholar]
- Vafai S.B., Mootha V.K. Mitochondrial disorders as windows into an ancient organelle. Nature. 2012;491:374–383. doi: 10.1038/nature11707. [DOI] [PubMed] [Google Scholar]
- Voccoli V., Colombaioni L. Mitochondrial remodeling in differentiating neuroblasts. Brain Res. 2009;1252:15–29. doi: 10.1016/j.brainres.2008.11.026. [DOI] [PubMed] [Google Scholar]
- Varkuti B.H., Kepiro M., Liu Z., Vick K., Avchalumov Y., Pacifico R., McMullen C.M., Kamenecka T.M., Puthanveettil S.V., Davis R.L. Neuron-based high-content assay and screen for CNS active mitotherapeutics. Sci. Adv. 2020;6:eaaw8702. doi: 10.1126/sciadv.aaw8702. [DOI] [PMC free article] [PubMed] [Google Scholar]
- Wagner B.K., Kitami T., Gilbert T.J., Peck D., Ramanathan A., Schreiber S.L., Golub T.R., Mootha V.K. Large-scale chemical dissection of mitochondrial function. Nat. Biotechnol. 2008;26:343–351. doi: 10.1038/nbt1387. [DOI] [PMC free article] [PubMed] [Google Scholar]
- Wang X., Su B., Lee H., Li X., Perry G., Smith M.A., Zhu X. Impaired balance of mitochondria fission and fusion in Alzheimer disease. J. Neurosci. 2009;29:9090–9103. doi: 10.1523/JNEUROSCI.1357-09.2009. [DOI] [PMC free article] [PubMed] [Google Scholar]
- Zorov D.B., Juhaszova M., Sollott S.J. Mitochondrial reactive oxygen species (ROS) and ROS-induced ROS release. Physiol. Rev. 2014;94:909–950. doi: 10.1152/physrev.00026.2013. [DOI] [PMC free article] [PubMed] [Google Scholar]
- Zorova L.D., Popkov V.A., Plotnikov E.Y., Silachev D.N., Pevzner I.B., Jankauskas S.S., Babenko V.A., Zorov S.D., Balakireva A.V., Juhaszova M. Mitochondrial membrane potential. Anal. Biochem. 2018;552:50–59. doi: 10.1016/j.ab.2017.07.009. [DOI] [PMC free article] [PubMed] [Google Scholar]
Associated Data
This section collects any data citations, data availability statements, or supplementary materials included in this article.