

Abstract
BACKGROUND:
Nonhuman primate (NHP) models are commonly used to advance our understanding of brain function and organization. However, to date, they have offered few insights into individual differences among NHPs. In large part, this is due to the logistical challenges of NHP research, which limit most studies to 5 subjects or fewer.
METHODS:
We leveraged the availability of a large-scale open NHP imaging resource to provide an initial examination of individual differences in the functional organization of the NHP brain. Specifically, we selected one awake functional magnetic resonance imaging dataset (Newcastle University: n = 10) and two anesthetized functional magnetic resonance imaging datasets (Oxford University: n = 19; University of California, Davis: n = 19) to examine individual differences in functional connectivity characteristics across the cortex as well as potential state dependencies.
RESULTS:
We noted significant individual variations of functional connectivity across the macaque cortex. Similar to the findings in humans, during the awake state, the primary sensory and motor cortices showed lower variability than the high-order association regions. This variability pattern was significantly correlated with T1-weighted and T2-weighted mapping and degree of long-distance connectivity, but not short-distance connectivity. The interindividual variability under anesthesia exhibited a very distinct pattern, with lower variability in medial frontal cortex, precuneus, and somatomotor regions and higher variability in the lateral ventral frontal and insular cortices.
CONCLUSIONS:
This work has implications for our understanding of the evolutionary origins of individual variation in the human brain and methodological implications that must be considered in any pursuit to study individual variation in NHP models.
Keywords: Anesthesia, Awake, fMRI, Functional connectivity, Interindividual variation, Nonhuman primate
Our understanding of the human brain has been greatly advanced by continuous interactions between scientists studying the human brain and scientists using animal models, which allow for more precise, invasive interrogation of neural circuits. In many cases, our knowledge of the rodent and nonhuman primate (NHP) is more advanced than that of the human owing to the vast array of tools available. However, with rare exception (1), one aspect in which human neuroscience research has outpaced animal research is in the study of individual differences in brain structure and function and how such differences relate to behavior.
Spurred on by the increased popularity of connectomics research, individual differences in functional connectivity (FC) have gained particular attention in the human literature (2–6). A heterogeneous picture has emerged in full brain studies, with interindividual variations being lesser in early sensory and motor cortices and greater in heteromodal association regions, which are characterized by greater long-range connectivity and are commonly implicated in higher-order cognitive function (2,3). Putting the pieces together, several investigators have suggested that the increases in functional variation from the primary sensorimotor to unimodal to heteromodal cortex in humans appear to follow the hierarchy of cortical processing, which has been related to gradients of gene expression profiles as well (7–9). Importantly, recent studies examining the ratio of T1-weighted (T1w) to T2-weighted (T2w) structural magnetic resonance imaging (MRI) and its links to the cortical hierarchy have suggested a high degree of similarity between the two species (9,10). As such, one might expect a high degree of correspondence in patterns of interindividual variation.
The present study takes a first step in addressing the critical gap in knowledge regarding individual differences in brain organization in NHPs. Specifically, we ask the following three questions: 1) How does interindividual variation in FC vary throughout the macaque cortex? 2) How does the pattern of interindividual variation in FC relate to the connectivity distance, T1w/T2w mapping, and the variation of structural properties? 3) How does the pattern of interindividual variation in FC differ between awake and anesthetized states? The last question is a particularly important one in bridging the gap between the study of individual differences between humans and NHPs, as macaque imaging data are commonly collected in the anesthetized state. This is understandable, as it is often more tolerable for the monkey and allows for longer scan times and higher-quality data. Nonetheless, differences in FC between awake and anesthetized states have been described (11–14), raising the possibility that patterns of individual variation may also differ as a function of scan state.
To accomplish our goals, we leveraged previously collected functional MRI (fMRI) datasets made available through the PRIMatE Data Exchange (PRIME-DE) (15). Specifically, we used three independent data collections: Oxford University (anesthetized), University of California, Davis (UC-Davis) (anesthetized), and Newcastle University (awake). To facilitate comparison with existing findings in humans, which can provide novel insights into the evolutionary roots of interindividual differences, our examination followed the framework for evaluation of individual variation previously established by Mueller et al. (2). Specifically, we 1) examined the spatial distribution of intersubject variability in FC while controlling for intrasubject variance, technique noise, and cortical structural profiles; 2) compared intersubject variation maps with maps for cortical structural variation (cortical thickness, curvature, sulcal depth, surface area) and T1w and T2w maps; and 3) compared intersubject variation maps with short-range and long-range FC.
None of the three datasets included in PRIME-DE contained both awake and anesthetized data in the same subjects. Nonetheless, we attempted to provide initial insights into the potential impact of anesthesia. We accomplished this by identifying findings obtained using the awake dataset (Newcastle) that differed from findings of both of the anesthetized datasets (Oxford, UC-Davis). Additionally, we took advantage of the availability of a small sample of macaques scanned both awake and anesthetized at the Nathan Kline Institute (NKI) to corroborate findings suggested by the comparison of data across sites differing with respect to anesthesia state.
METHODS AND MATERIALS
We used the MRI data from the recently formed NHP data sharing consortium PRIME-DE [http://fcon_1000.projects.nitrc.org/indi/indiPRIME.html (15)]. Three cohorts of macaque monkeys were included in the present study.
Oxford Data (Anesthetized)
The full dataset consisted of 20 rhesus macaque monkeys (Macaca mulatta) scanned on a 3T scanner with four-channel coil. The data were collected while the animals were anesthetized without the contrast agent. Nineteen macaques were included (all males, age 4.01 ± 0.98 years, weight 6.61 ± 2.04 kg); each had a 53.33-minute (1600 volumes) scan. One macaque was excluded owing to the failure of surface reconstruction of its structural image.
UC-Davis Data (Anesthetized)
The dataset consisted of 19 rhesus macaque monkeys (M. mulatta) scanned on a Siemens MAGNETOM Skyra 3T scanner (Siemens Healthcare, Erlangen, Germany) with four-channel clamshell coil. The macaques were scanned under anesthesia without the contrast agent. Nineteen macaques were included (all female, age 20.38 ± 0.93 years, weight 9.70 ± 1.58 kg). One resting-state scan (6.67 minutes, 250 volumes) was included per animal.
Newcastle Data (Awake)
The full dataset consisted of 14 rhesus macaque monkeys (M. mulatta) scanned on a Bruker 4.7T vertical primate scanner (Bruker, Billerica, MA). We restricted our analysis to 10 animals (8 males, age 8.28 ± 2.33 years, weight 11.76 ± 3.38 kg) for whom two awake fMRI scans (8.3 minutes, 250 volumes per scan) were required. The details of the data acquisition and procedures were described in previous studies (16–22). No contrast agent was used during the scans.
NKI Data (Awake and Anesthetized)
The NKI data consisted of 2 rhesus monkeys (M. mulatta) (1 male, age 6 years, weight 6.4 kg, marked as NKI-R; 1 female, age 7 years, weight 4.5 kg, marked as NKI-W). They were scanned on a 3.0T Siemens TIM Trio scanner (Siemens Healthcare) with an eight-channel surface coil. This dataset was not used for variation analysis but as a complementary dataset, which consists of a large amount of awake and anesthetized data within the same monkey. The data had been preprocessed and used in our previous work (12). Specifically, we included seven sessions (awake: 224 minutes; anesthetized: 196.7 minutes) for monkey-W and four sessions (awake: 86 minutes; anesthetized: 108 minutes) for monkey-R. All the included data from the NKI site were collected with the contrast agent ferumoxytol, a monocrystalline iron oxide nanoparticle. The details of the acquisition parameters were described in Xu et al. (12).
MRI Data Preprocessing for NHP Datasets
The structural MRI data were processed using the customized Human Connectome Project (HCP)–like pipeline from DAF’s laboratory, and the functional data were preprocessed as described previously (12,23). Details of the data protocols and preprocessing are provided in Supplemental Methods.
Human Data (Awake) and Processing
We replicated prior human findings here by using resting-state fMRI data from an HCP dataset (177 unrelated participants, 79 male, age 29.03 ± 3.45 years) (23,24). The minimal preprocessing HCP data were temporal filtered (0.01–0.1 Hz), smoothed (full width at half maximum = 6 mm), and down-sampled to 10k (10,242 vertices) midcortical surface.
FC Profile
To account for the intrasubject variance while estimating the intersubject variability, we first split the data into several subsets for each animal. Specifically, for Oxford data, we split the entire session into five subsets (320 volumes per subset). For UC-Davis data, which has fewer time points, we split the data into two subsets (125 volumes per subset). For the Newcastle data, two scans were originally recorded per animal (250 volumes per scan). To limit the intrasubject variation within the scan, we also split each scan into two subsets (125 volumes × 2 subsets × 2 scans). For the human HCP data, we kept the original four resting-state fMRI scans as four subsets (1200 volumes per subset).
Similar to earlier human studies (25), we first defined the FC profiles at each vertex as a vector of Pearson’s correlations between its time series and the time series of all the regions of interest (ROIs). The ROIs were uniformly sampled from a coarse sphere surface (624 vertices per hemisphere) and mapped back onto the 10k sphere in Yerkes19 macaque space (26); each ROI includes one resampled vertex and its one-step neighboring vertices, whereas the ROIs that fell in the medial wall were removed from the analysis (Figure 1B). In total, there were 1114 ROIs for two hemispheres. For a given vertex v, let the connectivity profile denote as a vector FCv (subject, subset). FCv is a 1 × 1114 vector representing the FC for a given vertex v to 1114 ROIs. A similar procedure was applied to the human HCP data to create a connectivity profile (a 1 × 1114 FC vector) at each vertex v.
Figure 1.
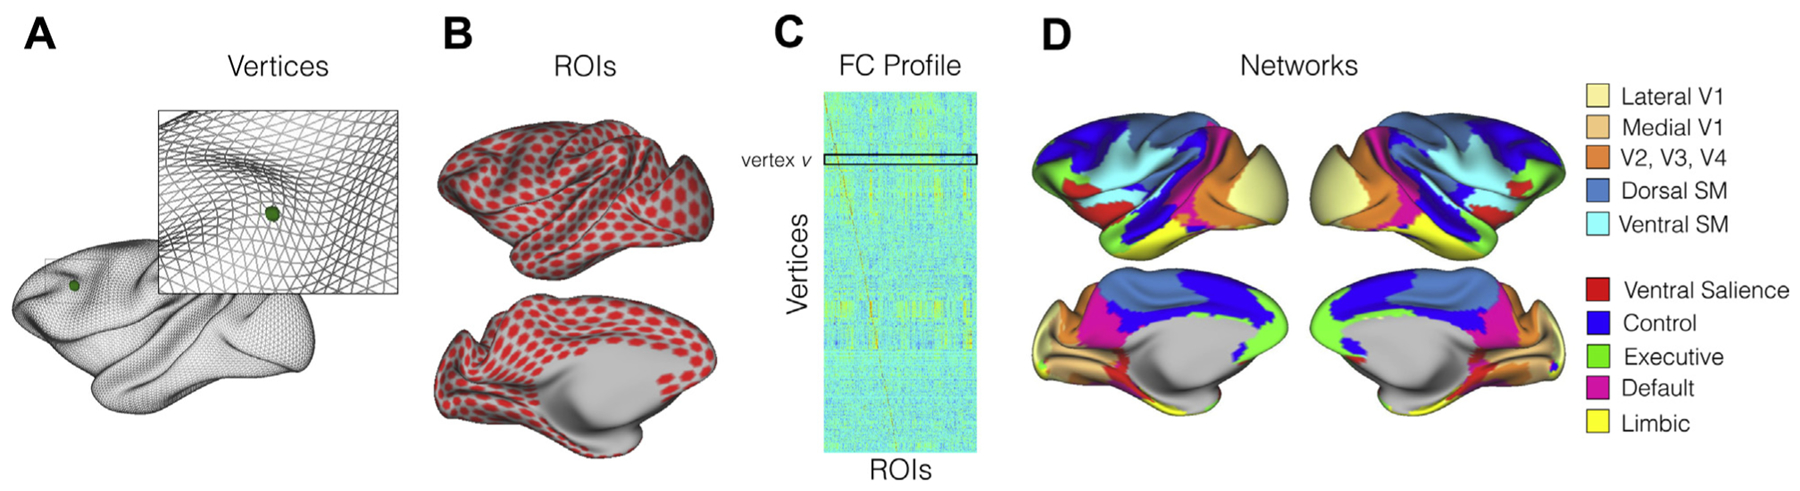
The functional connectivity (FC) profile and functional networks of the macaque brain. (A) Inflated macaque surface mesh (10,242 vertices). (B) Uniformly sampled regions of interest (ROIs) on the 10k (10,242 vertices) macaque surface (1114 ROIs within the cortex mask for two hemispheres). (C) Example of the FC profile. Each row is a vector of FC profile calculated as the correlation between the time series at vertex v and 1114 ROIs. (D) Large-scale functional networks based on the clustering approach. SM, somatomotor.
Intersubject Variability of FC Profile
Following the same analysis framework in prior studies (2), the distance of functional profile FCv between any subsets and subjects was calculated by 1 − Pearson’s correlation at each vertex. The intrasubject variability was quantified by averaging the distance of FCv (subject, subset) across subjects as follows: Vv(intra) = 1 − E(corr[FCv(subject, i), FCv(subject, j)]), where i and j indicate scanning subsets for the same subject. The intersubject variability was initially estimated as Vv(inter_unadjusted) = 1 − E(corr[FCv(p, subset), FCv(q, subset)]), where p and q indicate different subjects.
Of note, the intersubject variability was adjusted by regressing out the intrasubject variability, the technical noise (temporal signal-to-noise ratio), and the group-averaged cortical structural profile using the general linear model. Four commonly examined cortical measures were included in the model (i.e., thickness, sulcus depth, surface area, and curvature). The adjusted intersubject variability was estimated as follows:
Intersubject variability of cortical structure was measured by calculating the standard variation and scaling the averaged measurement and its square term in general linear model at each vertex (see equation in Supplemental Methods).
Removing Geometrical Artificial Effects
When mapping the data from the volume to the surface, the connectivity between surface vertices with a certain range of geodesic distance might be artificially increased. To remove such artificial connectivity, we explicitly removed the local connectivity (the geodesic distance between vertex v and ROIs <6 mm on the surface) from the FCv (subject, subset) vector for each vertex (see Supplemental Methods and Supplemental Figure S1).
Functional Network and Parcellation
To quantify the variation at network level, we performed a clustering approach to identify large-scale networks in macaque monkeys. The main goal in the current study is not to delineate optimal clusters, but rather to summarize the functional variation in a suitable set of networks that is presumably comparable to the human networks in prior studies (2,25). Therefore, we conducted the same clustering approach used in the study by Yeo et al. (25) and opted to use the Oxford data, which contain the largest sample size and the most extensive data (53.33 minutes per animal). The details of the clustering method were described in Yeo et al. (25). Briefly, we used the FC profiles based on 1114 ROIs that sampled uniformly on the surface across two hemispheres. The same clustering algorithm was applied to the group averaged 17,749 × 1114 (vertices × ROIs) correlation matrix. To determine the number of clusters that is comparable with Yeo’s seven networks in humans, we tested the number of clusters a priori from 7 to 12. The resultant visual and somatomotor networks in macaques were divided into small clusters in a very early stage when seven networks were chosen. Specifically, the somatomotor network was divided into ventral and dorsal units and stabilized as two clusters from seven to 12 networks. Similarly, the visual network was divided into lateral V1, V2–V4, and medial V1 clusters and stabilized as three clusters from nine to 12 networks. In Yeo’s seven networks, five networks were identified for heteromodal cortex besides the visual and somatomotor networks. To make the number of heteromodal clusters the same as in humans, 10 clusters were chosen for the final demonstration — 5 unimodal networks capture the primary sensory and motor areas (i.e., medial V1, lateral V1, V2–V4, ventral somatomotor, and dorsal somatomotor networks), and 5 heteromodal networks characterize the association cortex (Figure 1D). They resemble the executive network (green), control network (blue), ventral salience network (red), default mode network (magenta), and limbic network (yellow).
Short-Distance and Long-Distance FC
To measure the short-distance FC, we thresholded for each vertex at the top 10% percentile of connectivity strengths and counted the percentage of the connections whose geodesic distance are within 12 mm. Similarly, the long-distance FC was defined as the percentage of the connections whose geodesic distance is greater than 20 mm in the top 10% of all connectivity. As mentioned above, to avoid the geometrical artificial effects, the FC (geodesic distance <6 mm) was removed when we calculated the local FC here. Of note, given that the head motion may induce artificial connections, in addition to the scrubbing procedure in preprocessing step, we adopted more strict thresholds and calculated the short-distance and long-distance FC (Supplemental Figure S2) to replicate the analysis.
RESULTS
Interindividual Variation of FC
For each data collection selected from PRIME-DE (Newcastle, Oxford, UC-Davis), we estimated interindividual functional variation at each vertex (Supplemental Figure S1A), while controlling for intraindividual variation, technical noise, and cortical structural properties (Supplemental Figure S1B–D). In each of the datasets, intersubject variability of FC exhibited a heterogeneous spatial distribution across the macaque cortex.
We first replicated the prior human findings based on the HCP data (Figure 2A). The heteromodal association cortex particular frontoparietal network showed higher interindividual variation than the visual and somatomotor networks. Intriguingly, the interindividual variation was specifically high in the association network borders. For the macaque data, focusing on the findings from the awake sample first (Newcastle) (Figure 2B), the heteromodal association cortex showed a higher degree of individual differences, whereas the unimodal regions (i.e., visual and somatomotor area) were relatively low. This topographic distribution is consistent with prior findings in awake human imaging, which showed higher variation in the association cortices and lower variation in visual and somatomotor areas (Figure 2A). To quantify the functional variation at the network level, the vertexwise variation maps were averaged within each network (Figure 1D). Figure 3 shows the network boundaries overlaid with the averaged variation based on published parcellation (27). For the awake condition (Figure 3B), the visual, in particular the medial V1, showed the least individual difference, followed by the lateral V1 and secondary visual area (V2–V4). Among the heteromodal networks, executive (green) and control network (blue) exhibited the highest variation in FC. The ventral salience (red) and default mode network (magenta) showed a moderate degree of variation, which is lower than executive and control networks, but higher than that of the limbic network across five heteromodal networks. This hierarchy of the functional variation across networks in the macaque is consistent with the prior human work (2), in which the highest level of functional variability was observed in frontoparietal control network, followed by the attention, default mode, and limbic networks, with a moderate degree of variation; the sensorimotor and visual networks showed the least variation. Intriguingly, in contrast to the human findings with a steep increase of interindividual variation from unimodal to heteromodal networks, the variation across networks was relatively mild in the macaque (Figure 3A, B).
Figure 2.
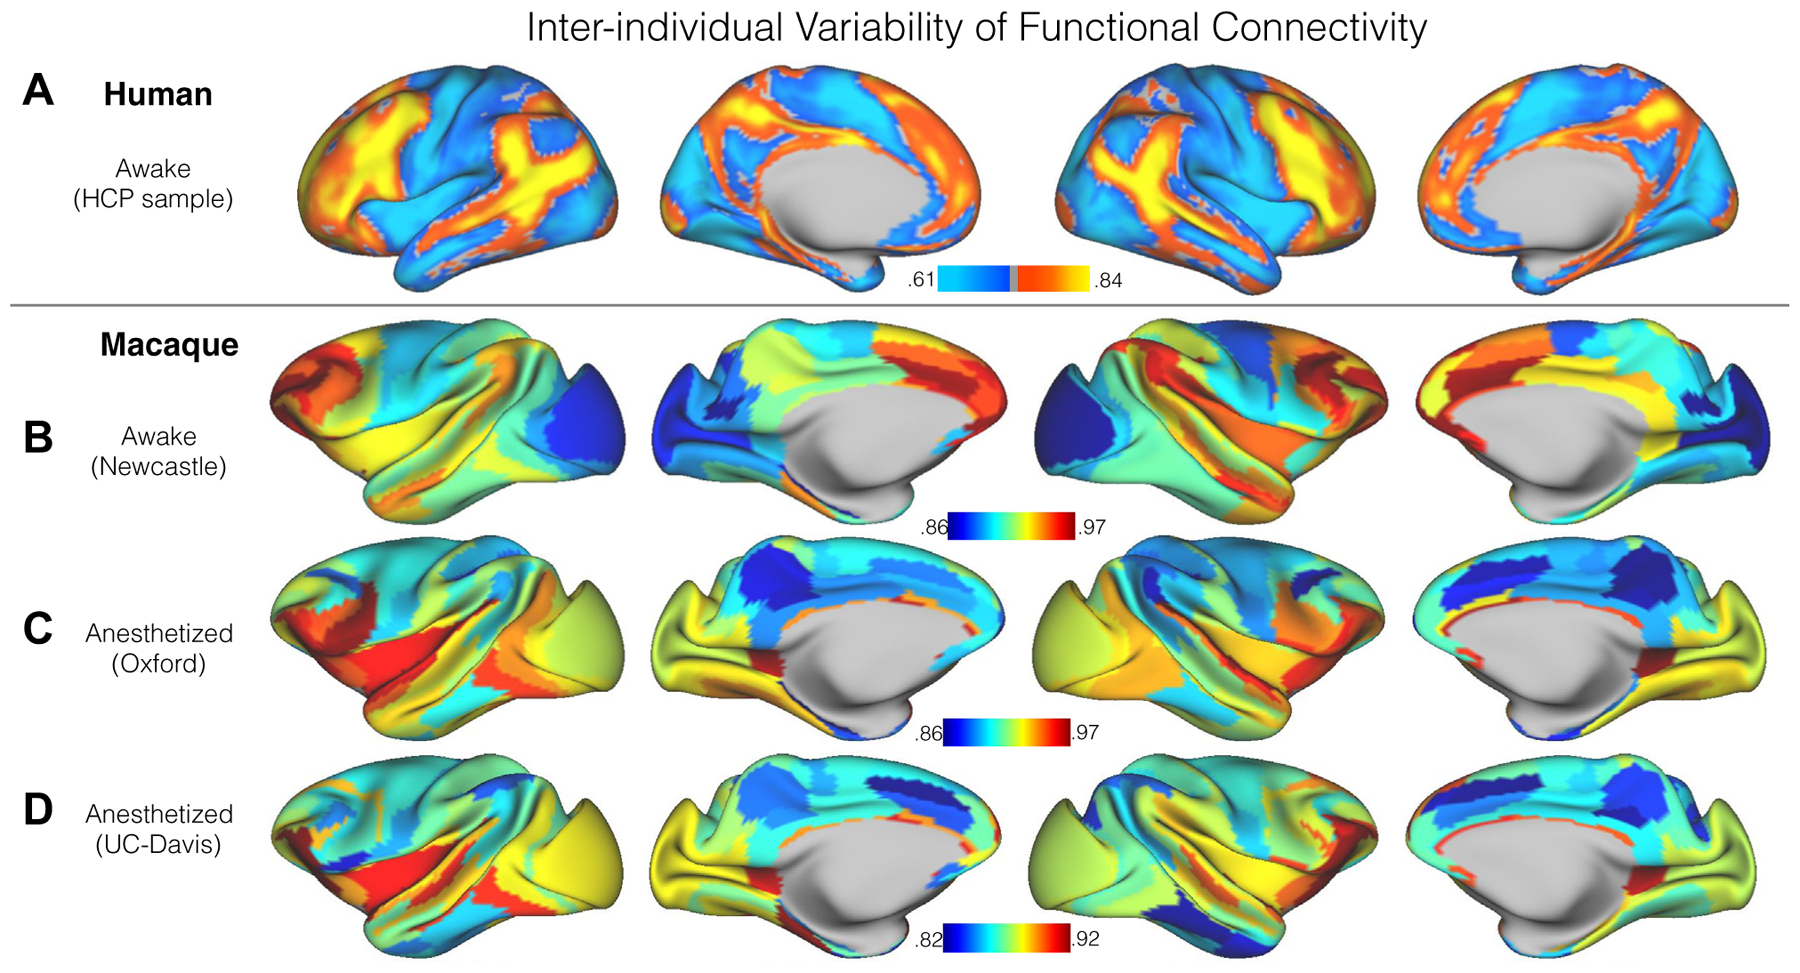
Interindividual variation of functional connectivity in the human sample from the Human Connectome Project (HCP) (A), awake macaque sample from Newcastle University dataset (B), and anesthetized macaque samples from Oxford University dataset (C) and University of California, Davis (UC-Davis) dataset (D). To emphasize the overall regional differences and improve the signal-to-noise ratio for macaque samples, we visualized the interindividual variation using the architectonic areas from published atlases (27,62). The vertexwise maps are demonstrated in Supplemental Figure S1A.
Figure 3.
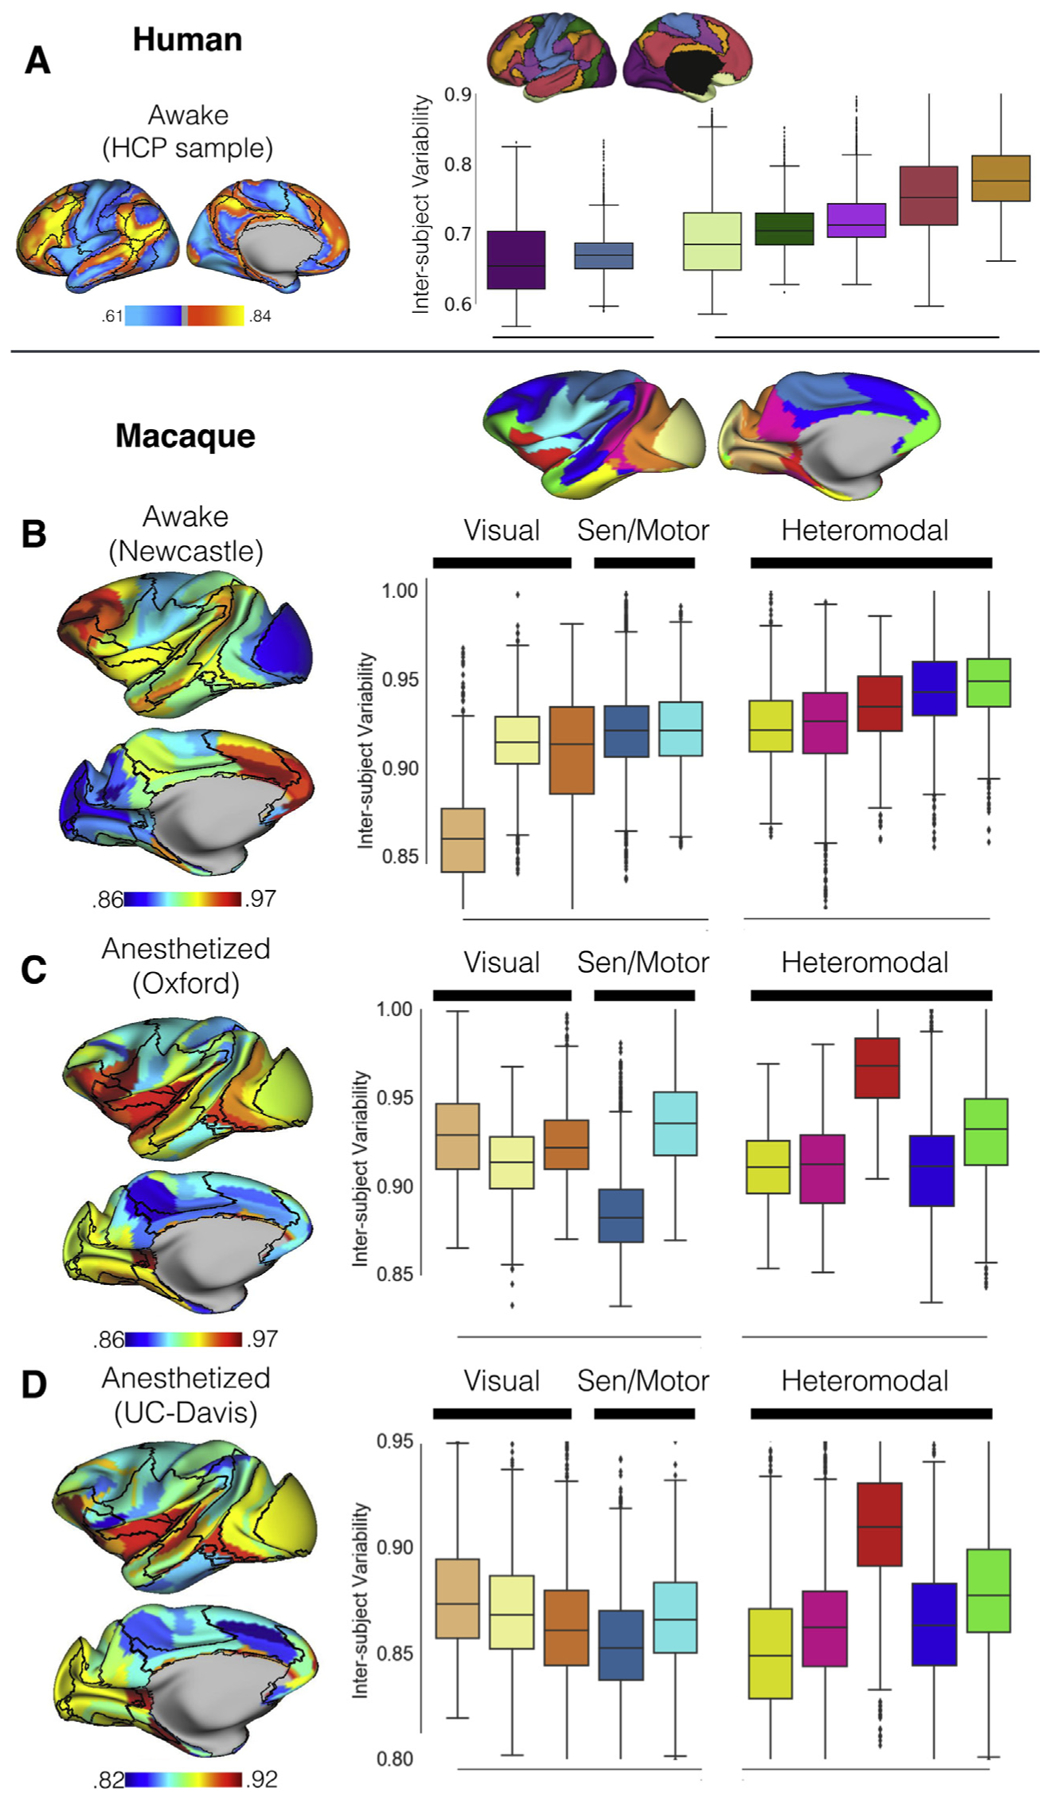
Interindividual variation of functional connectivity at the network level in the awake human sample from the Human Connectome Project (HCP) (A), awake macaque sample from Newcastle University dataset (B), and anesthetized macaque samples from Oxford University dataset (C) and University of California, Davis (UC-Davis) dataset (D). The boxplot quantified the vertexwise interindividual variations using Yeo 7 networks (26) for the human sample and the macaque 10 networks (Figure 1D) for the macaque samples (B-D). Sen, sensory.
Next, we looked at the interindividual variation in each of the collections obtained during the anesthetized state (Figure 2C, D). Notably, the pattern of functional variation observed throughout the cortex was highly similar across the two sites (r = .43, p < .001), despite the relatively smaller amount of data for the UC-Davis sample (3.3 minutes × 2 subsets per animal) with respect to the Oxford sample (10.6 minutes × 5 subsets per animal). In contrast, findings from the two anesthetized samples appeared to be relatively distinct from findings obtained during the awake state in the Newcastle sample as well as those previously reported from humans. Specifically, individual differences obtained in the anesthetized samples exhibited notably greater functional variation in FC patterns across individuals in visual cortex and remarkably less in cingulate cortex, precuneus, and area 7m (Figure 2C, D). At the network level, the ventral salience network (i.e., Brodmann area F5, promotor area, gustatory cortex, orbital proisocortex, and insula) showed the highest degree of variation in the anesthetized state and dorsal somatomotor cortex the lowest, whereas in the awake samples, the executive function network exhibited the highest degree of variation and medial primary V1 the least.
Functional Variation and Short-Distance and Long-Distance Connectivity
Next, for each data collection, we assessed the short-range (i.e., local) and long-range (i.e., distant) FC at each vertex tested for associations with interindividual variation in FC. Focusing on the awake sample (Newcastle) (Figure 4A), long-range FC was most prominent in the lateral and medial frontal cortices as well as the posterior cingulate cortex and inferior temporal cortex. The spatial pattern of long-range FC showed a strong positive association with the individual variations (r = .56, pcorrected < .001) across the macaque cortex. When we looked at the short-range FC pattern, a nonsignificant correlation was obtained (r = −.10, pcorrected = .87) with interindividual variation. The overall patterns of association between interindividual variation and short-range and long-range FC followed patterns observed in human literature but were more modest for short-range FC in the macaque (r = −.10 vs. r = −.33) in Mueller et al. (2).
Figure 4.
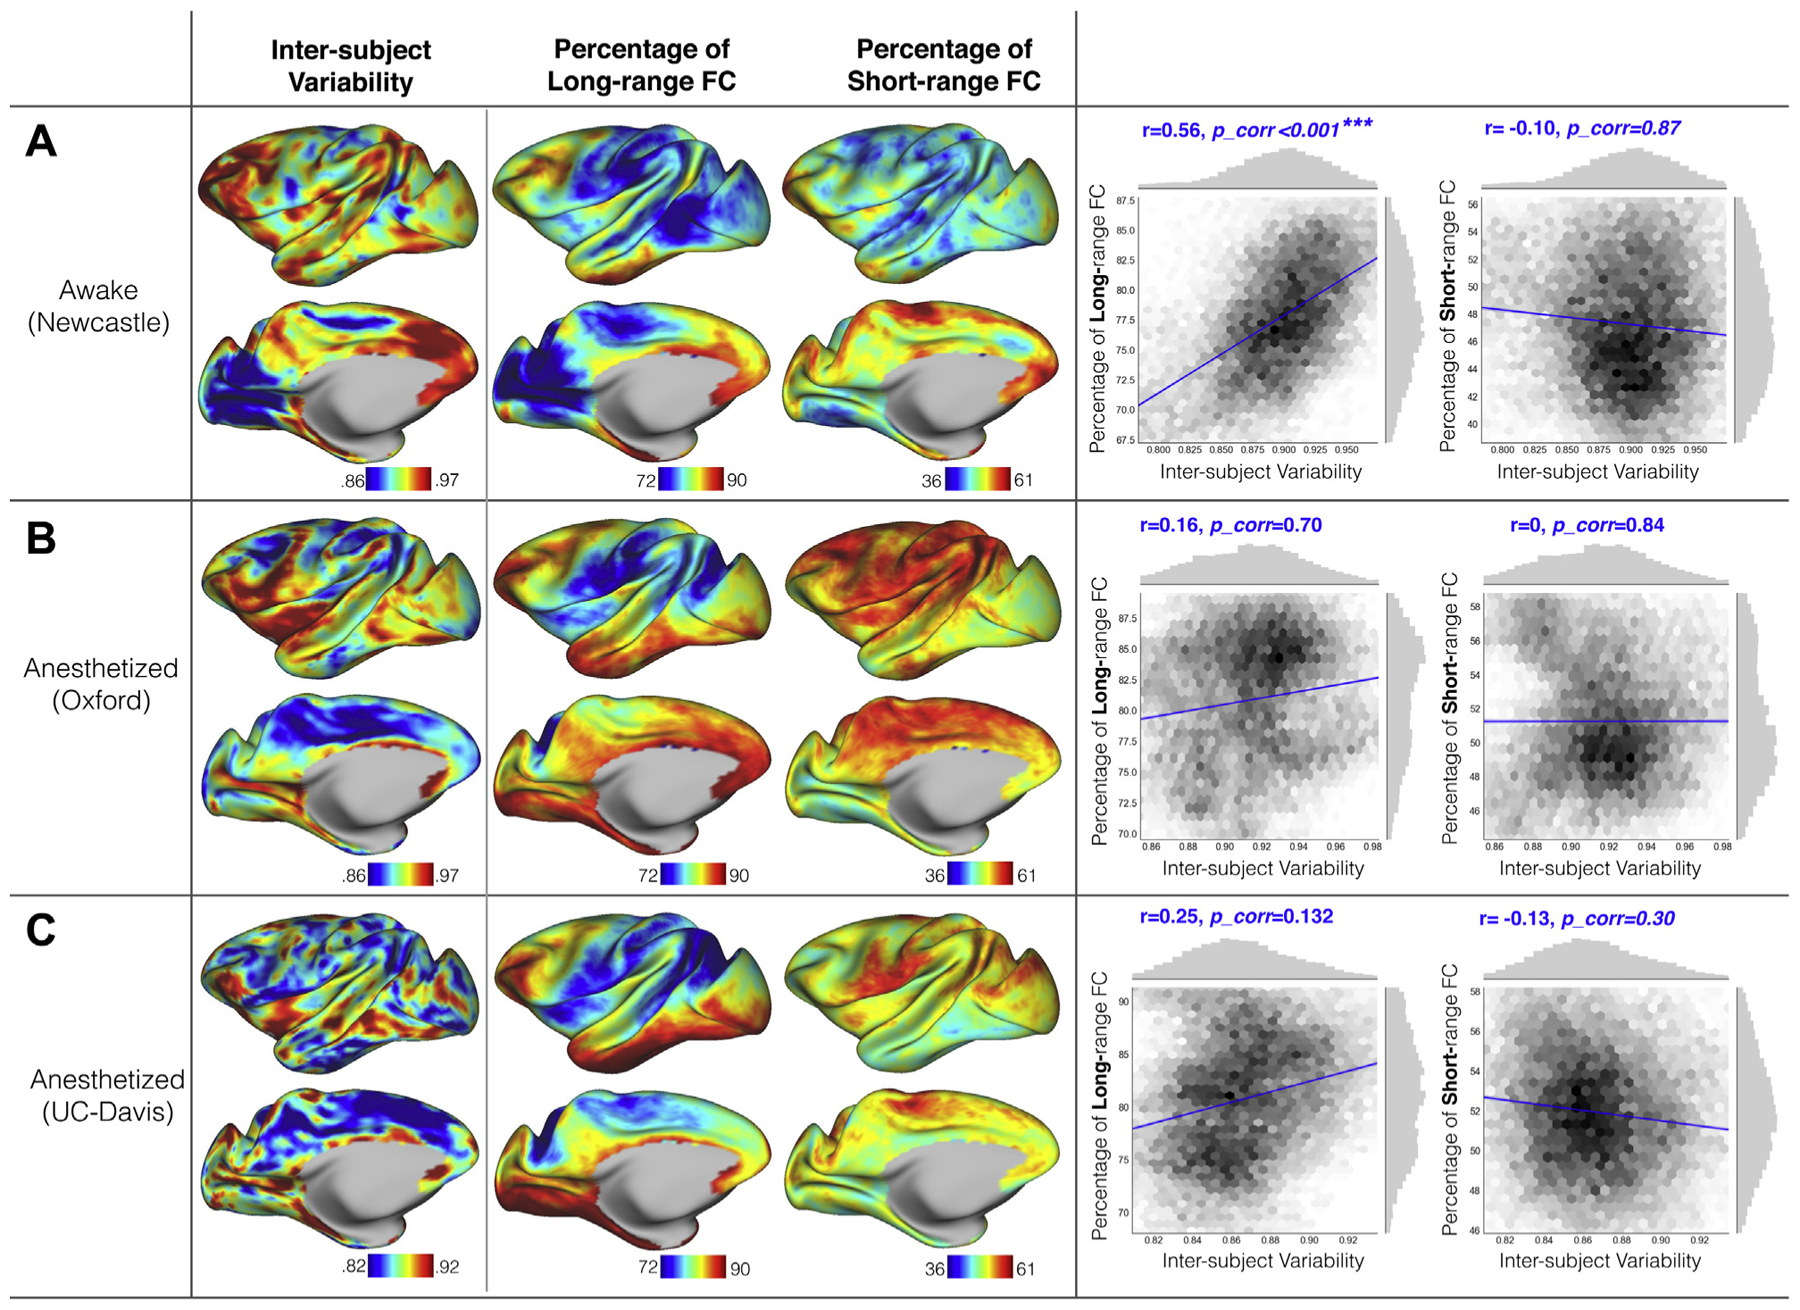
Interindividual variation of functional connectivity (FC) and percentage of long-range and short-range connectivity in the awake macaque sample from Newcastle University dataset (A) and two anesthetized samples from Oxford University dataset (B) and University of California, Davis (UC-Davis) dataset (C). The vertexwise maps are shown on the left; the scatter plots and spatial correlations with corrected p values are shown on the right. The randomization test for correcting the p values is described in Supplemental Methods.
In the anesthetized samples (i.e., UC-Davis, Oxford), no similar positive correlations between either long-range or short-range FC and interindividual variation were found in either Oxford (long-range: r = .25, pcorrected = .132; short-range: r = 0, pcorrected = −84) and UC-Davis (long-range: r = .16, pcorrected = .7; short-range: r = −.13, pcorrected = .3) data (Figure 4B, C). Of note, to avoid the geometrical artificial effects as mentioned in Methods and Materials, the FC at geodesic distance <6 mm was not counted in the short-range FC calculation, which may mitigate the correlation between interindividual variation and short-range FC.
Functional Variation and Structural Variation
Human studies have reported associations between interindividual variations in FC and structure, particularly with respect to cortical folding pattern (i.e., sulcal depth). In this study, we investigated the extent to which such correlations may exist in the macaque, focusing on four commonly examined measures (i.e., curvature, sulcus depth, surface area, cortical thickness). We did not find any significant correlations between FC interindividual variation and variation in the structural indices examined, regardless of sites (all pcorrected > .217).
Functional Variation and T1w and T2w Topography
T1w and T2w mapping has been suggested to index myelin content and, at a minimum, appears related to the anatomical hierarchy in both humans and macaques (7,10,28,29). We assessed the relationship of interindividual variation, short-range FC, and long-range FC with T1w and T2w mapping measured from a new population average macaque atlas referred to as “Yerkes19” (26). A moderate-to-strong correlation between T1w and T2w mapping and the intersubject functional variability (r = −.466, pcorrected = .001) was observed in the awake sample (Figure 5), though no correlations were found in either of the anesthetized samples. Similarly, we found that T1w and T2w mapping was negatively associated with long-range FC in the awake sample (r = −.491, pcorrected = .006) (Figure 5), whereas such correlations were not significant in the anesthetized samples (Oxford: r = −.251, pcorrected = .107; UC-Davis: r = −.163, pcorrected = .555). When correlating T1w and T2w mapping with short-distance FC, the awake sample showed a relatively low correlation with a marginal significance (Newcastle: r = −.20, pcorrected = .058), whereas no significant correlations were obtained in anesthetized samples (Oxford: r = −.056, pcorrected = .906; UC-Davis: r = −.131, pcorrected = .807).
Figure 5.
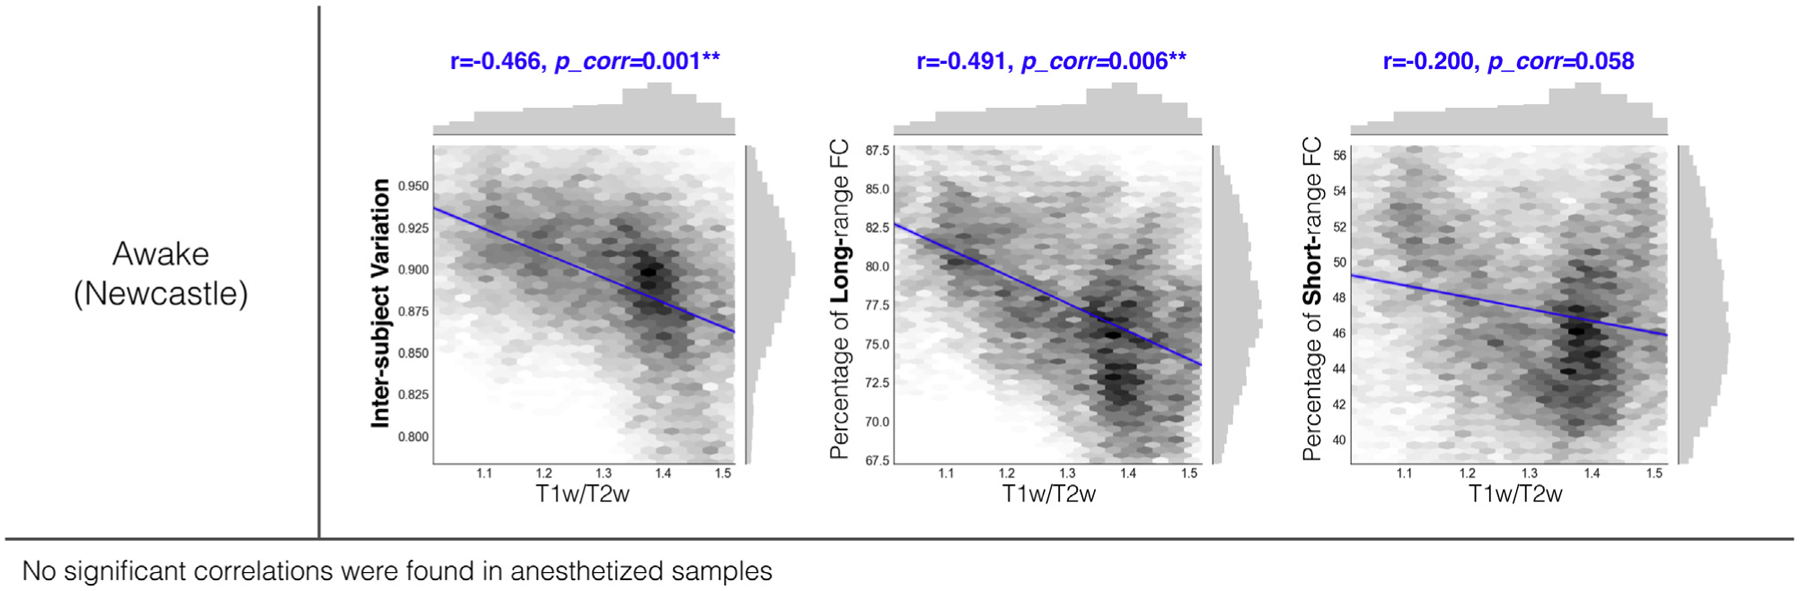
Scatter plots and spatial correlations between T1-weighted and T2-weighted (T1w/T2w) topography with interindividual variation of functional connectivity (FC), short-range connectivity, and long-range connectivity in the awake macaque sample (Newcastle University dataset).
Quantifying Awake Versus Anesthetized State Differences at the Group Level
Our findings for interindividual variation pointed to the importance of state-related differences. Though it was not a primary focus of the present study, we examined the impact of state on group-level findings as well. To gain further insight into the state-related functional differences, we examined the similarity of FC profiles derived from awake and anesthetized samples. The similarity was quantified by Pearson’s correlation of FC profiles at each vertex (Figure 6). Two specific comparisons were used for the assessment of similarity: 1) the first session from Newcastle (awake) and Oxford (anesthetized) data and 2) the second session from Newcastle (awake) and UC-Davis (anesthetized) data. As the site effect confounded with the state differences here, we made such comparisons to test whether the state similarity could be replicable in independent samples (Figure 6A, B).The similarity from these two comparisons showed highly similar patterns (r = .59, pcorrected < .001). FC profiles in unimodal regions (i.e., visual, somatomotor networks) were more similar (Figure 6A, B) between awake and anesthetized samples. The heteromodal networks in general showed higher dissimilarity than unimodal regions. Specifically, the limbic (yellow) network exhibited highest dissimilarity, followed by the ventral salience (red) and default mode networks (magenta); the executive network exhibited lowest dissimilarity among heteromodal networks between awake and anesthetized samples (Figure 6A, B), though still higher than the unimodal networks.
Figure 6.
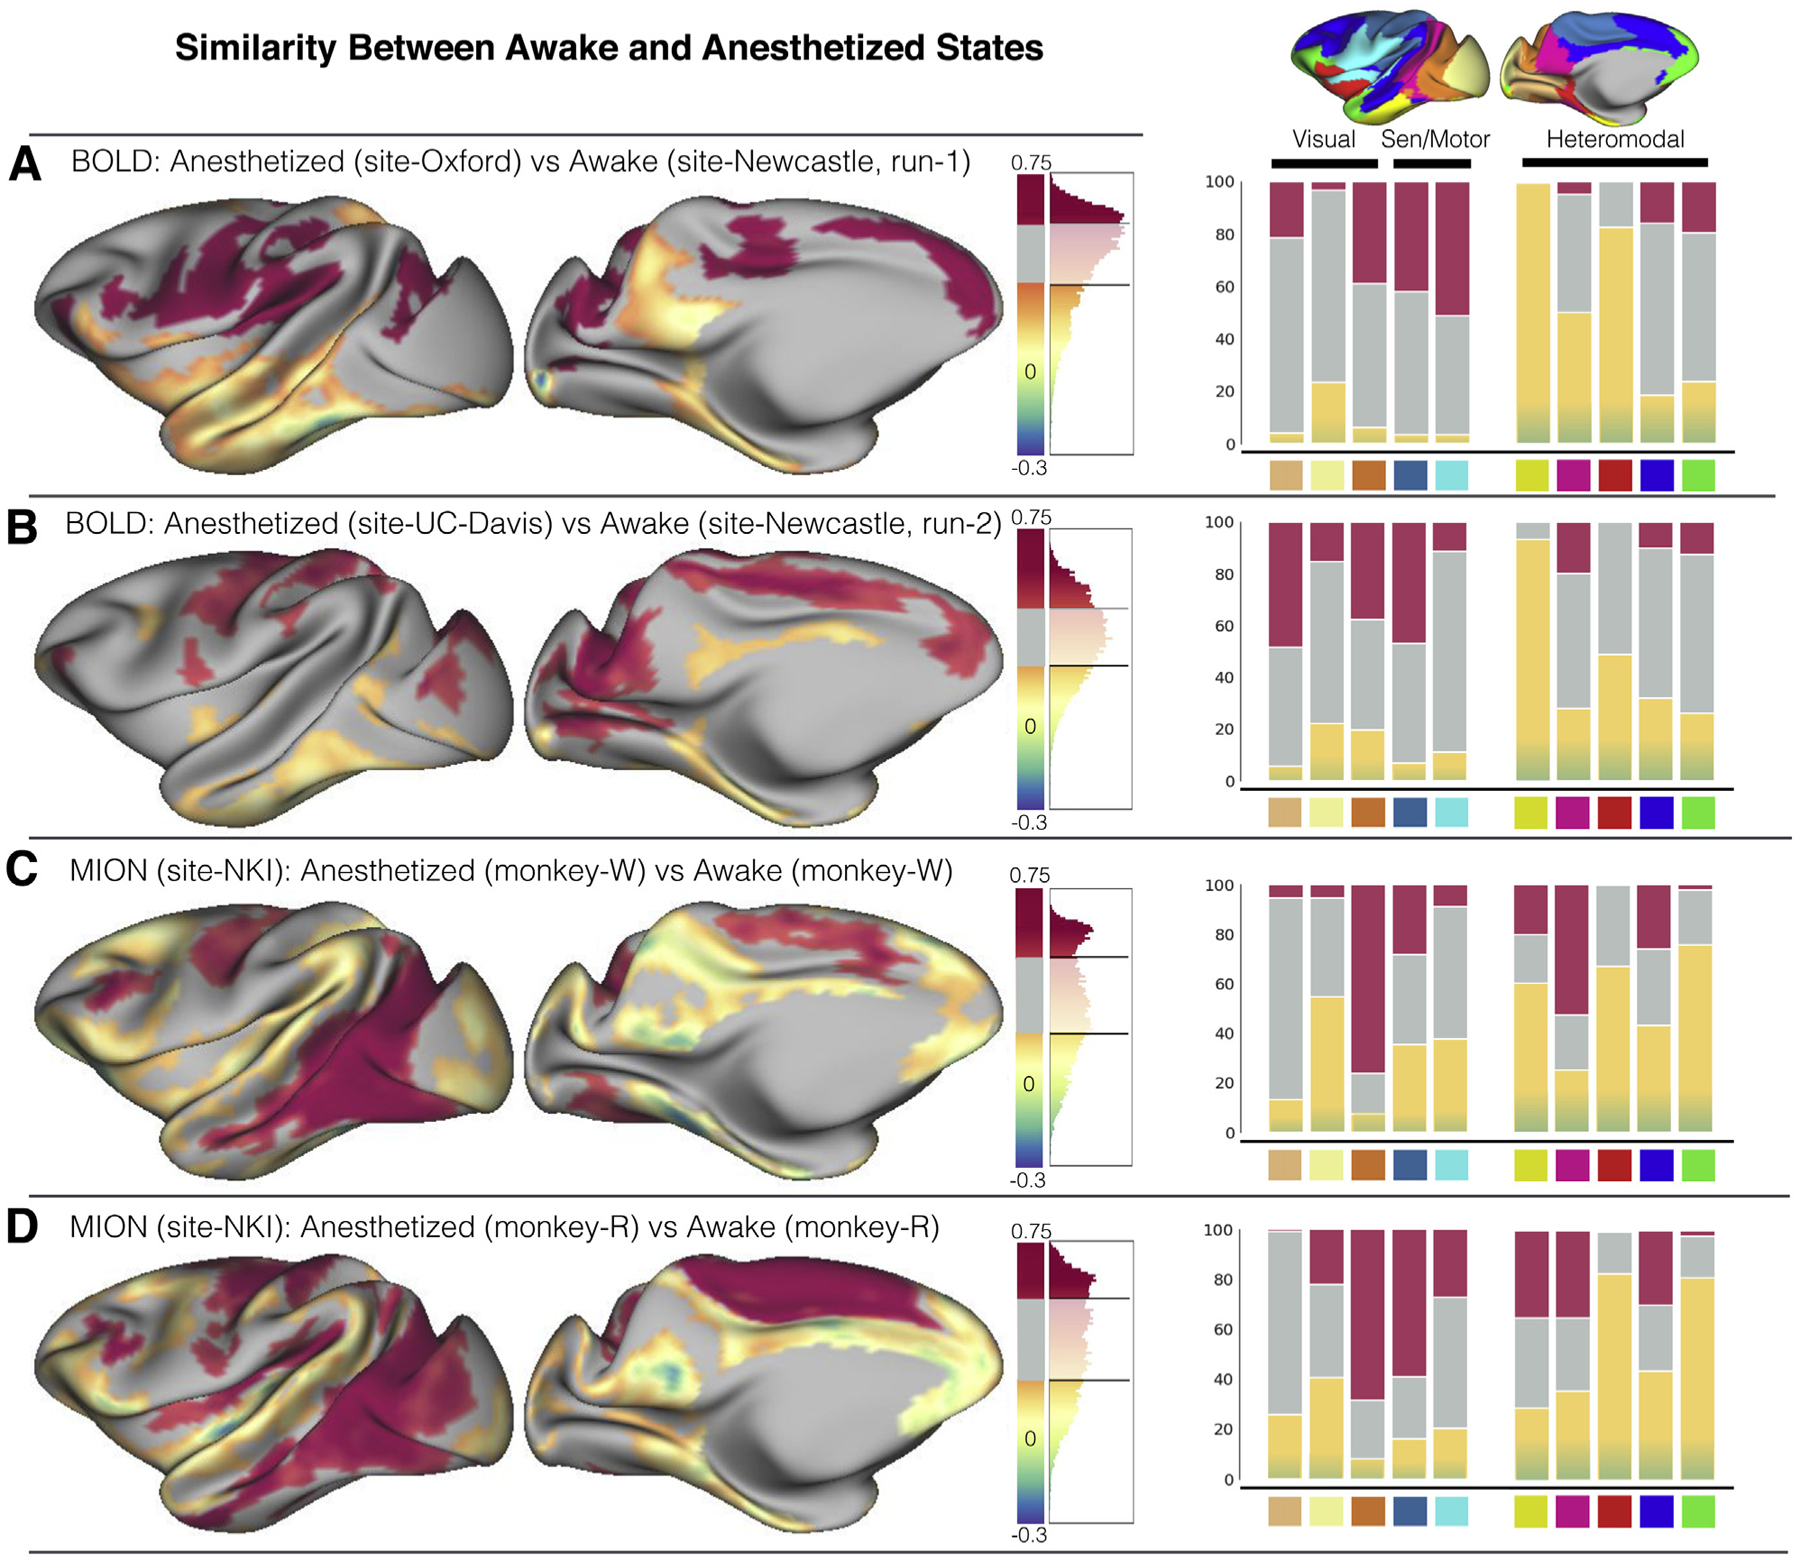
State-related dissimilarity at the group level. The averaged similarity between awake and anesthetized samples measured as the Pearson correlation of functional connectivity profile at each vertex. The distribution of the r values is visualized beside the surface map for four comparisons: (A) anesthetized sample from the Oxford University dataset vs. awake sample from the first scan of Newcastle University dataset (both Oxford and Newcastle data were blood oxygen level–dependent [BOLD] functional magnetic resonance imaging scans without the contrast agent); (B) anesthetized sample from University of California, Davis (UC-Davis) dataset vs. awake sample from the second scan from Newcastle dataset (both Oxford and Newcastle data were BOLD functional magnetic resonance imaging scans without contrast agent); (C) anesthetized vs. awake within one macaque from the Nathan Kline Institute (NKI) dataset (monkey-W), which was scanned with the contrast agent ferumoxytol (monocrystalline iron oxide nanoparticle [MION]); (D) anesthetized vs. awake within one macaque from NKI dataset (monkey-R), which was scanned with contrast agent ferumoxytol (MION). The negative r value indicates the opposite pattern of functional connectivity profile between awake and anesthetized samples. We mapped the top 25% of positive r values (the most similar) in red and bottom 25% of positive r values in yellow and all the negative r values (the most dissimilar) in blue. The right panel shows the proportion of most similar (red) and dissimilar vertices (yellow to blue) lying within each functional network. Sen, sensory.
To provide further corroborating evidence for state differences, we also quantified state similarity within the same animal using data from two macaque subjects collected at NKI. Though the gross awake versus anesthetized similarity maps for monkey-W (Figure 6C) and monkey-R (Figure 6D) were not significantly related to those for the comparisons of Newcastle versus Oxford/UC-Davis (r = .11–.23, pcorrected = .533–.063), the heteromodal networks appeared to be more dissimilar relative to unimodal regions (Figure 6C, D). Of note, the NKI awake data were collected under a naturalistic viewing task and presumably had visual network activation (12), whereas the Newcastle awake data were mainly focused on the auditory paradigm (16,19). In addition, the NKI data were collected with the contrast agent (ferumoxytol), which has been demonstrated to be a significant factor that can cause differences in FC (see Supplemental Results) (12,30–32).
DISCUSSION
Echoing prior reports from human studies (2), the present study suggests that the macaque cortex is similarly heterogeneous with respect to individual differences. Consistencies between prior findings in the human and findings in the macaque awake imaging sample (Newcastle) examined here were multifold. First, heteromodal association areas were characterized by relatively higher levels of interindividual variation in FC patterns, whereas lower-order regions, including primary sensory and motor areas, were characterized by lower levels of variation in the awake brain. Areas within the lateral prefrontal cortex showed the highest interindividual variability consistently across the macaque and human (Figure 2A, B). Second, regional differences in individual variation were highly correlated with the presence of long-range FC and T1w and T2w mapping. No significant correlations were observed with the various structural indices, though a modest correlation with sulcal depth variation was observed in humans (2). Overall, these findings suggest a conservation of patterns of individual differences across species. Of note, our preliminary examination of the impact of anesthesia on individual variation found differences in insular and lateral inferior frontal cortices, suggesting the potential importance of considering state when attempting to translate imaging findings across states and species.
From an evolutionary perspective, the present findings are informative. The consistency of findings with those of prior human studies suggests that the functional organization of lower-order areas (i.e., primary sensorimotor, unimodal areas) was relatively conserved across individuals, and heteromodal association cortices were more variable (2,3,33). In considering overall patterns of regional differences in the present study, it is worth noting their relationships to phylogenetic ordering, with heteromodal association areas emerging later in the evolutionary process (34–37). Leading hypotheses (e.g., the tethering hypothesis) emphasize the contributions of environmental factors (e.g., molecular gradients), and their interactions with genetically determined processes, to the cortical expansions that led to the development of heteromodal association areas (38). Similar factors may very well contribute to the higher degree of individual differences observed in these areas, which are characterized by a more prolonged developmental course (2,39).
Both human and macaque awake samples suggested that the unimodal-heteromodal hierarchy was negatively related to an index of anatomical hierarchy—T1w and T2w mapping (2,10,28,29). The latter has been suggested as an in vivo measure of myelin content, which has been shown to be remarkably correlated with the hierarchical gradients in gene expression profiles that are related to synaptic physiology, cell-type specificity, and cortical cytoarchitecture (7). Additionally, consistent with the findings in humans, the interindividual variability of FC was positively correlated with the long-distance FC. These long-distance connections are prevalent in hub regions that underlie attention, memory, and other higher cognitive functions in humans (2,40–42). Such strong correlation in macaques and humans suggests that long-range FC is critical to the individual differences both within and across species. Taken together, the relationship with connectivity distance, cortical gradients of potential myelin content (i.e., T1w and T2w mapping), and related gene expression profile (7) provides hints at the biological underpinnings of variability of FC.
While anesthetized imaging is the most practical approach in NHP imaging owing to the greater ease of handling and tolerability, state-related sensitivities have been reported in both humans and NHPs (43–47). The present study was not optimally designed to analyze anesthesia effects; however, the findings do suggest that patterns of individual difference may be impacted by the use of anesthesia. First, in both of the anesthetized samples employed, we found the limbic and default mode networks to be less variable than unimodal regions, whereas the orbitofrontal cortex and insular cortex were highly variable—the latter of which is commonly linked to the salience network and consciousness in the literature (43,48,49). Second, associations between individual variation and long-range connectivity were detectable in only the awake sample. These findings suggest that anesthesia may impair our ability to detect variations in long-range functional architecture—a finding that is consistent with prior work that reported decreased network complexity (13,50,51). This may explain observations of decreased variation for posterior portions of the default network.
The high degree of similarity in the findings for the two anesthetized samples was particularly notable given that different anesthesia and imaging protocols were employed. At a minimum, the present study raises cautions for the study of individual differences under the anesthetized state and necessitates future work to clarify anesthesia effects more definitively (52). This clarification is especially important given prior work emphasizing the presence of changes in the functional architecture associated with sleep and anesthesia using a range of modalities (e.g., fMRI, electroencephalography, positron emission tomography, transcranial magnetic stimulation) (11–14,44,45,47). As NHP imaging researchers move beyond initial demonstrations of similarity in the gross network architecture to more nuanced comparative anatomy questions related to within-species and cross-species variation, state-related differences will become an increasing concern for NHP studies (53–55); if substantive enough, they may necessitate awake imaging, depending on the region being examined. An understanding of state-related differences will also be helpful in explaining variations in findings that will likely emerge across studies over time.
There are a number of notable limitations of the present study. First, although larger than what is included in most studies and comparable to that employed by Mueller et al. (2), the awake sample employed was still relatively modest in size. As such, while we are relatively confident of the gross patterns detected, which replicated well the patterns previously documented in humans, more finely grained details were likely beyond detectability. Second, the methods and protocols used across sites were determined independently of one another, increasing the likelihood of finding differences among samples. Despite this, a strength of our findings was that the two anesthetized samples yielded highly similar results, and the awake sample replicated the prior human findings. Third, the awake and anesthetized comparisons were carried out across samples; ideally, the same subjects would be used for any comparison of states. We did include the two subjects from NKI, each of which was scanned under both states, finding corroborating evidence for the between-sample comparison. Finally, while our findings are largely consistent with those previously obtained in humans, we were not able to carry out direct statistical comparisons of findings across species. Future work would benefit from protocol harmonization (as possible) and more rigorous cross-species alignment to provide more fine-grained comparisons (37,56,57).
In summary, the present study demonstrates the presence of individual differences in the functional organization of the macaque cortex that are highly reminiscent of what is observed in the human. Similar to the findings in human literature, the present study draws particular attention to differences in the regional properties of the cortical hierarchy, which appear to play out in a growing number of neuroscientific findings (7,29,58–61). Finally, it raises cautions about the study of individual differences in the anesthetized state and the need for further attention toward determining which properties are and are not stable across states as scientists work to put together the pieces across studies and species.
Supplementary Material
ACKNOWLEDGMENTS AND DISCLOSURES
This work was supported by gifts from Joseph P. Healey, Phyllis Green, and Randolph Cowen to the Child Mind Institute and the National Institutes of Health (Brain Research through Advancing Innovative Neurotechnologies Initiative Grant Nos. R01-MH111439 [to CES and MPM], P50MH109429 [to CES], R01-MH107508 [to DAF], and P60-AA010760, R01-MH115357, R01-MH096773, and P50-MH100029 [to DAF]), National Institutes of Health (Grant No. P01AG026423), and Yerkes National Primate Research Center Office of Research Infrastructure Programs (Grant No. OD P51OD11132).
We thank the investigative teams from Newcastle University (J. Nacef, C.I. Petkov, F. Balezeau, T.D. Griffiths, C. Poirier, A. Thiele, M. Ortiz, M. Schmid, D. Hunter), Oxford University (J. Sallet, R.B. Mars, M.F.S. Rush-worth), and University of California, Davis (M.G. Baxter, P.L. Croxson, J.H. Morrison) and the funding agencies that made their work possible (University of California, Davis: National Institute on Aging; Newcastle: National Center for 3Rs, National Institutes of Health, Wellcome Trust, UK Biotechnology Biological Sciences Research Council; Oxford University: Wellcome Trust, Royal Society, Medical Research Council, UK Biotechnology, and Biological Sciences Research Council).
The authors report no biomedical financial interests or potential conflicts of interest.
Footnotes
Supplementary material cited in this article is available online at https://doi.org/10.1016/j.bpsc.2019.02.005.
REFERENCES
- 1.Croxson PL, Forkel SJ, Cerliani L, de Schotten MT (2017): Structural variability across the primate brain: A cross-species comparison. Cereb Cortex 28:3829–3841. [DOI] [PMC free article] [PubMed] [Google Scholar]
- 2.Mueller S, Wang D, Fox MD, Thomas Yeo BT, Sepulcre J, Sabuncu MR, et al. (2013): Individual variability in functional connectivity architecture of the human brain. Neuron 77:586–595. [DOI] [PMC free article] [PubMed] [Google Scholar]
- 3.Chamberland M, Girard G, Bernier M, Fortin D, Descoteaux M, Whittingstall K (2017): On the origin of individual functional connectivity variability: The role of white matter architecture. Brain Connect 7:491–503. [DOI] [PubMed] [Google Scholar]
- 4.Gratton C, Laumann TO, Nielsen AN, Greene DJ, Gordon EM, Gilmore AW, et al. (2018): Functional brain networks are dominated by stable group and individual factors, not cognitive or daily variation. Neuron 98:439–452.e5. [DOI] [PMC free article] [PubMed] [Google Scholar]
- 5.Barch DM, Burgess GC, Harms MP, Petersen SE, Schlaggar BL, Corbetta M, et al. (2013): Function in the human connectome: Task-fMRI and individual differences in behavior. Neuroimage 80:169–189. [DOI] [PMC free article] [PubMed] [Google Scholar]
- 6.Gordon EM, Laumann TO, Adeyemo B, Petersen SE (2017): Individual variability of the system-level organization of the human brain. Cereb Cortex 27:386–399. [DOI] [PMC free article] [PubMed] [Google Scholar]
- 7.Burt JB, Demirtas M, Eckner WJ, Navejar NM, Ji JL, Martin WJ, et al. (2018): Hierarchy of transcriptomic specialization across human cortex captured by structural neuroimaging topography. Nat Neurosci 21:1251–1259. [DOI] [PMC free article] [PubMed] [Google Scholar]
- 8.Felleman DJ, Van Essen DC (1991): Distributed hierarchical processing in the primate cerebral cortex. Cereb Cortex 1:1–47. [DOI] [PubMed] [Google Scholar]
- 9.Markov NT, Vezoli J, Chameau P, Falchier A, Quilodran R, Huissoud C, et al. (2014): Anatomy of hierarchy: feedforward and feedback pathways in macaque visual cortex. J Comp Neurol 522:225–259. [DOI] [PMC free article] [PubMed] [Google Scholar]
- 10.Huntenburg JM, Bazin P-L, Goulas A, Tardif CL, Villringer A, Margulies DS (2017): A systematic relationship between functional connectivity and intracortical myelin in the human cerebral cortex. Cereb Cortex 27:981–997. [DOI] [PMC free article] [PubMed] [Google Scholar]
- 11.Hutchison RM, Culham JC, Randall Flanagan J, Everling S, Gallivan JP (2015): Functional subdivisions of medial parieto-occipital cortex in humans and nonhuman primates using resting-state fMRI. Neuroimage 116:10–29. [DOI] [PubMed] [Google Scholar]
- 12.Xu T, Falchier A, Sullivan EL, Linn G, Ramirez JSB, Ross D, et al. (2018): Delineating the macroscale areal organization of the macaque cortex in vivo. Cell Rep 23:429–441. [DOI] [PMC free article] [PubMed] [Google Scholar]
- 13.Barttfeld P, Uhrig L, Sitt JD, Sigman M, Jarraya B, Dehaene S (2015): Signature of consciousness in the dynamics of resting-state brain activity. Proc Natl Acad Sci U S A 112:887–892. [DOI] [PMC free article] [PubMed] [Google Scholar]
- 14.Ferrarelli F, Massimini M, Sarasso S, Casali A, Riedner BA, Angelini G,et al. (2010): Breakdown in cortical effective connectivity during midazolam-induced loss of consciousness. Proc Natl Acad SciUSA 107:2681–2686. [DOI] [PMC free article] [PubMed] [Google Scholar]
- 15.Milham MP, Ai L, Koo B, Xu T, Amiez C, Balezeau F, et al. (2018): An open resource for non-human primate imaging. Neuron 100:61–74.e2. [DOI] [PMC free article] [PubMed] [Google Scholar]
- 16.Rinne T, Muers RS, Salo E, Slater H, Petkov CI (2017): Functional imaging of audio-visual selective attention in monkeys and humans: How do lapses in monkey performance affect cross-species correspondences? Cereb Cortex 27:3471–3484. [DOI] [PMC free article] [PubMed] [Google Scholar]
- 17.Poirier C, Baumann S, Dheerendra P, Joly O, Hunter D, Balezeau F, et al. (2017): Auditory motion-specific mechanisms in the primate brain. PLoS Biol 15:e2001379. [DOI] [PMC free article] [PubMed] [Google Scholar]
- 18.Slater H, Milne AE, Wilson B, Muers RS, Balezeau F, Hunter D, et al. (2016): Individually customisable non-invasive head immobilisation system for non-human primates with an option for voluntary engagement. J Neurosci Methods 269:46–60. [DOI] [PMC free article] [PubMed] [Google Scholar]
- 19.Wilson B, Kikuchi Y, Sun L, Hunter D, Dick F, Smith K, et al. (2015): Auditory sequence processing reveals evolutionarily conserved regions of frontal cortex in macaques and humans. Nat Commun 6:8901. [DOI] [PMC free article] [PubMed] [Google Scholar]
- 20.Baumann S, Joly O, Rees A, Petkov CI, Sun L, Thiele A, Griffiths TD (2015): The topography of frequency and time representation in primate auditory cortices. Elife 4. [DOI] [PMC free article] [PubMed] [Google Scholar]
- 21.Schönwiesner M, Dechent P, Voit D, Petkov CI, Krumbholz K (2015): Parcellation of human and monkey core auditory cortex with fMRI pattern classification and objective detection of tonotopic gradient reversals. Cereb Cortex 25:3278–3289. [DOI] [PMC free article] [PubMed] [Google Scholar]
- 22.Baumann S, Griffiths TD, Sun L, Petkov CI, Thiele A, Rees A (2011): Orthogonal representation of sound dimensions in the primate midbrain. Nat Neurosci 14:423–425. [DOI] [PMC free article] [PubMed] [Google Scholar]
- 23.Glasser MF, Sotiropoulos SN, Wilson JA, Coalson TS, Fischl B, Andersson JL, et al. (2013): The minimal preprocessing pipelines for the Human Connectome Project. Neuroimage 80:105–124. [DOI] [PMC free article] [PubMed] [Google Scholar]
- 24.Marcus DS, Harms MP, Snyder AZ, Jenkinson M, Wilson JA, Glasser MF, et al. (2013): Human Connectome Project informatics: Quality control, database services, and data visualization. Neuroimage 80:202–219. [DOI] [PMC free article] [PubMed] [Google Scholar]
- 25.Yeo BT, Krienen FM, Sepulcre J, Sabuncu MR, Lashkari D, Hollinshead M, et al. (2011): The organization of the human cerebral cortex estimated by intrinsic functional connectivity. J Neurophysiol 106:1125–1165. [DOI] [PMC free article] [PubMed] [Google Scholar]
- 26.Donahue CJ, Sotiropoulos SN, Jbabdi S, Hernandez-Fernandez M, Behrens TE, Dyrby TB, et al. (2016): Using diffusion tractography to predict cortical connection strength and distance: A quantitative comparison with tracers in the monkey. J Neurosci 36:6758–6770. [DOI] [PMC free article] [PubMed] [Google Scholar]
- 27.Markov NT, Ercsey-Ravasz MM, Ribeiro Gomes AR, Lamy C, Magrou L, Vezoli J, et al. (2014): A weighted and directed interareal connectivity matrix for macaque cerebral cortex. Cereb Cortex 24:17–36. [DOI] [PMC free article] [PubMed] [Google Scholar]
- 28.Glasser MF, Van Essen DC (2011): Mapping human cortical areas in vivo based on myelin content as revealed by T1- and T2-weighted MRI. J Neurosci 31:11597–11616. [DOI] [PMC free article] [PubMed] [Google Scholar]
- 29.Margulies DS, Ghosh SS, Goulas A, Falkiewicz M, Huntenburg JM, Langs G, et al. (2016): Situating the default-mode network along a principal gradient of macroscale cortical organization. Proc Natl Acad SciUSA 113:12574–12579. [DOI] [PMC free article] [PubMed] [Google Scholar]
- 30.Gautama T, Mandic DP, Van Hulle MM (2003): Signal nonlinearity in fMRI: A comparison between BOLD and MION. IEEE Trans Med Imaging 22:636–644. [DOI] [PubMed] [Google Scholar]
- 31.Grayson DS, Bliss-Moreau E, Machado CJ, Bennett J, Shen K, Grant KA, et al. (2016): The Rhesus monkey connectome predicts disrupted functional networks resulting from pharmacogenetic inactivation of the amygdala. Neuron 91:453–466. [DOI] [PMC free article] [PubMed] [Google Scholar]
- 32.Leite FP, Tsao D, Vanduffel W, Fize D, Sasaki Y, Wald LL, et al. (2002): Repeated fMRI using iron oxide contrast agent in awake, behaving macaques at 3 Tesla. Neuroimage 16:283–294. [DOI] [PubMed] [Google Scholar]
- 33.Reid AT, Lewis J, Bezgin G, Khundrakpam B, Eickhoff SB, McIntosh AR, et al. (2016): A cross-modal, cross-species comparison of connectivity measures in the primate brain. Neuroimage 125:311–331. [DOI] [PubMed] [Google Scholar]
- 34.Rakic P (2009): Evolution of the neocortex: A perspective from developmental biology. Nat Rev Neurosci 10:724–735. [DOI] [PMC free article] [PubMed] [Google Scholar]
- 35.Hofman MA, Falk D (2012): Evolution of the Primate Brain, vol. 195 From Neuron to Behavior. Amsterdam: Elsevier. [Google Scholar]
- 36.Bruner E (2018): Human paleoneurology and the evolution of the parietal cortex. Brain Behav Evol 91:136–147. [DOI] [PubMed] [Google Scholar]
- 37.Van Essen DC, Donahue CJ, Glasser MF (2018): Development and evolution ofcerebral and cerebellarcortex. Brain Behav Evol 91:158–169. [DOI] [PMC free article] [PubMed] [Google Scholar]
- 38.Buckner RL, Krienen FM (2013): The evolution of distributed association networks in the human brain. Trends Cogn Sci 17:648–665. [DOI] [PubMed] [Google Scholar]
- 39.Carlisle A, Selwood L, Hinds LA, Saunders N, Habgood M, Mardon K, Weisbecker V (2017): Testing hypotheses of developmental constraints on mammalian brain partition evolution, using marsupials. Sci Rep 7:4241. [DOI] [PMC free article] [PubMed] [Google Scholar]
- 40.Sepulcre J, Liu H, Talukdar T, Martincorena I, Yeo BTT, Buckner RL (2010): The organization of local and distant functional connectivity in the human brain. PLoS Comput Biol 6:e1000808. [DOI] [PMC free article] [PubMed] [Google Scholar]
- 41.Liao XH, Xia MR, Xu T, Dai ZJ, Cao XY, Niu HJ, et al. (2013): Functional brain hubs and their test-retest reliability: A multiband resting-state functional MRI study. Neuroimage 83:969–982. [DOI] [PubMed] [Google Scholar]
- 42.Jung J, Cloutman LL, Binney RJ, Lambon Ralph MA (2017): The structural connectivity of higher order association cortices reflects human functional brain networks. Cortex 97:221–239. [DOI] [PMC free article] [PubMed] [Google Scholar]
- 43.Crick FC, Koch C (2005): What is the function of the claustrum? Philos Trans R Soc Lond B Biol Sci 360:1271–1279. [DOI] [PMC free article] [PubMed] [Google Scholar]
- 44.Duong TQ (2007): Cerebral blood flow and BOLD fMRI responses to hypoxia in awake and anesthetized rats. Brain Res 1135:186–194. [DOI] [PMC free article] [PubMed] [Google Scholar]
- 45.Crook J, Lovick T (2016): Urodynamic function during sleep-like brain states in urethane anesthetized rats. Neuroscience 313:73–82. [DOI] [PMC free article] [PubMed] [Google Scholar]
- 46.Sarasso S, Rosanova M, Casali AG, Casarotto S, Fecchio M, Boly M, et al. (2014): Quantifying cortical EEG responses to TMS in (un)consciousness. Clin EEG Neurosci 45:40–49. [DOI] [PubMed] [Google Scholar]
- 47.Chang C, Leopold DA, Schölvinck ML, Mandelkow H, Picchioni D, Liu X, et al. (2016): Tracking brain arousal fluctuations with fMRI. Proc Natl Acad Sci U SA 113:4518–523. [DOI] [PMC free article] [PubMed] [Google Scholar]
- 48.Koubeissi MZ, Bartolomei F, Beltagy A, Picard F (2014): Electrical stimulation of a small brain area reversibly disrupts consciousness. Epilepsy Behav 37:32–35. [DOI] [PubMed] [Google Scholar]
- 49.Critchley H, Seth A (2012): Will studies of macaque insula reveal the neural mechanisms of self-awareness? Neuron 74:423–426. [DOI] [PubMed] [Google Scholar]
- 50.Hutchison RM, Womelsdorf T, Gati JS, Everling S, Menon RS (2013): Resting-state networks show dynamic functional connectivity in awake humans and anesthetized macaques. Hum Brain Mapp 34:2154–2177. [DOI] [PMC free article] [PubMed] [Google Scholar]
- 51.Alkire MT, Hudetz AG, Tononi G (2008): Consciousness and anesthesia. Science 322:876–880. [DOI] [PMC free article] [PubMed] [Google Scholar]
- 52.Hutchison RM, Everling S (2012): Monkey in the middle: Why nonhuman primates are needed to bridge the gap in resting-state investigations. Front Neuroanat 6:29. [DOI] [PMC free article] [PubMed] [Google Scholar]
- 53.Wu TL, Mishra A, Wang F, Yang PF, Gore JC, Chen LM (2016): Effects of isoflurane anesthesia on resting-state fMRI signals and functional connectivity within primary somatosensory cortex of monkeys. Brain Behav 6:e00591. [DOI] [PMC free article] [PubMed] [Google Scholar]
- 54.Smith JB, Liang Z, Watson GDR, Alloway KD, Zhang N (2017): Inter-hemispheric resting-state functional connectivity of the claustrum in the awake and anesthetized states. Brain Struct Funct 222:2041–2058. [DOI] [PMC free article] [PubMed] [Google Scholar]
- 55.Liu JV, Hirano Y, Nascimento GC, Stefanovic B, Leopold DA, Silva AC (2013): fMRI in the awake marmoset: Somatosensory-evoked responses, functional connectivity, and comparison with propofol anesthesia. Neuroimage 78:186–195. [DOI] [PMC free article] [PubMed] [Google Scholar]
- 56.Van Essen DC (2004): Surface-based approaches to spatial localization and registration in primate cerebral cortex. Neuroimage 23(Suppl 1):S97–S107. [DOI] [PubMed] [Google Scholar]
- 57.Mars RB, Sotiropoulos SN, Passingham RE, Sallet J, Verhagen L, Khrapitchev AA, et al. (2018): Whole brain comparative anatomy using connectivity blueprints. Elife 7. [DOI] [PMC free article] [PubMed] [Google Scholar]
- 58.Huntenburg JM, Bazin P-L, Margulies DS (2018): Large-scale gradients in human cortical organization. Trends Cogn Sci 22:21–31. [DOI] [PubMed] [Google Scholar]
- 59.Chanes L, Barrett LF (2016): Redefining the role of limbic areas in cortical processing. Trends Cogn Sci 20:96–106. [DOI] [PMC free article] [PubMed] [Google Scholar]
- 60.Mesulam M (1998): From sensation to cognition. Brain 121:1013–1052. [DOI] [PubMed] [Google Scholar]
- 61.Mesulam M (2012): The evolving landscape of human cortical connectivity: Facts and inferences. Neuroimage 62:2182–2189. [DOI] [PMC free article] [PubMed] [Google Scholar]
- 62.Van Essen DC, Glasser MF, Dierker DL, Harwell J (2012): Cortical parcellations of the macaque monkey analyzed on surface-based atlases. Cereb Cortex 22:2227–2240. [DOI] [PMC free article] [PubMed] [Google Scholar]
Associated Data
This section collects any data citations, data availability statements, or supplementary materials included in this article.