



Abstract
Protein conformational changes are frequently essential for enzyme catalysis, and in several cases, shown to be the limiting factor for overall catalytic speed. However, a structural understanding of corresponding transition states, needed to rationalize the kinetics, remains obscure due to their fleeting nature. Here, we determine the transition-state ensemble of the rate-limiting conformational transition in the enzyme adenylate kinase, by a synergistic approach between experimental high-pressure NMR relaxation during catalysis and molecular dynamics simulations. By comparing homologous kinases evolved under ambient or high pressure in the deep-sea, we detail transition state ensembles that differ in solvation as directly measured by the pressure dependence of catalysis. Capturing transition-state ensembles begins to complete the catalytic energy landscape that is generally characterized by structures of all intermediates and frequencies of transitions among them.
Introduction
Enzymes exhibit conformational changes over a wide range of timescales and magnitudes for catalysis. Modern structural biology, driven by X-ray crystallography, electron microscopy and nuclear magnetic resonance (NMR), has revolutionized our understanding of how ground-state structures provide a framework for function. Furthermore, the relevance of protein dynamics, notably the interconversion between ground states, has emerged as fundamental for catalysis, drug binding and allosteric regulation1–4. However, capturing the structures of transition-state ensembles (TSEs), where free energy reaches a maximum, has been stymied due to their intrinsic brevity. Structural information coupled with kinetic isotope experiments have shown prowess in providing atomic detail for TSEs of reactions limited by the transformation of covalent bonds5. However, the nature of TSEs for protein motions have precluded experimental observation, despite their importance in defining movement within protein energy landscapes. Such knowledge is central for understanding enzymes since the fundamental principle of catalysis is to reduce the necessary free energy for passage between reactants and products6.
Here, we develop a synergistic computational/experimental approach exploiting the kinetic dependence of protein motion with hydrostatic pressure for structural characterization of the TSE during the rate-limiting transition of adenylate kinase (Adk) during catalysis. Using homologs of Adk from mesophilic (mesoAdk) and piezophilic (piezoAdk) organisms, the pressure dependency of Adk’s conformational change was studied in parallel with pressure variable enzyme turnover and NMR relaxation dispersion experiments. MesoAdk and piezoAdk each possessed markedly different pressure dependencies for the conformational changes and their volumetric differences were rationalized as differential solvation in their TSEs. This finding allowed us to explore the structural basis for each homology’s pressure dependence by targeted molecular dynamic simulations. Strikingly, the location of the TSE along Adk’s conformational transition was found at the onset of its lid-opening process and was experimentally validated by transferring the pressure dependence of piezoAdk into mesoAdk via three amino acid substitutions.
Results
Pressure Variable Enzyme Turnover of mesoAdk and piezoAdk.
The use of hydrostatic pressure in combination with kinetic experiments has emerged as a productive tool for studying TSEs of protein folding7–9. Under pressure, protein thermodynamics and kinetics are modulated by each conformer’s partial molar volume (PMV), which describes the summed volume of enzyme and solvent [reviewed in (10)]. Transitions between states become dependent on differences in PMVs, which manifest structurally through cavity formation/collapse and side-chain solvation11. By studying the pressure dependence of enzyme kinetics, a structural description of the TSE can be extracted from its PMV.
While the effects of pressure are simple in theory, deconvoluting the relationship between PMV and structure is complicated by the complexity of biomolecules. Large transitions, such as protein folding, often entail relatively small PMV differences due to competing effects12. Without additional information, dissecting the structural interactions culminating in the PMV represents a nearly impossible task13. To overcome this obstacle, we performed our experiments on two homologous enzymes of the Adk family which may have divergent effects under pressure, E. coli’s mesophilic Adk (mesoAdk) and P. profundum SS9’s piezophilic Adk (piezoAdk), found naturally at an ocean depth of 2.5 km (25 MPa)14. Adk is an essential enzyme in all kingdoms of life, reversibly catalyzing the bimolecular interconversion between ATP/AMP and two ADP molecules to maintain relative nucleotide concentrations in the cell15. Rate limited by a structural transition from closed to open ensembles, it appears an excellent system to probe TSEs of a conformational change in enzyme catalysis (Fig. 1a).
Figure 1 |. Pressure dependence of turnover for mesoAdk vs. piezoAdk to gain insight into transition states.
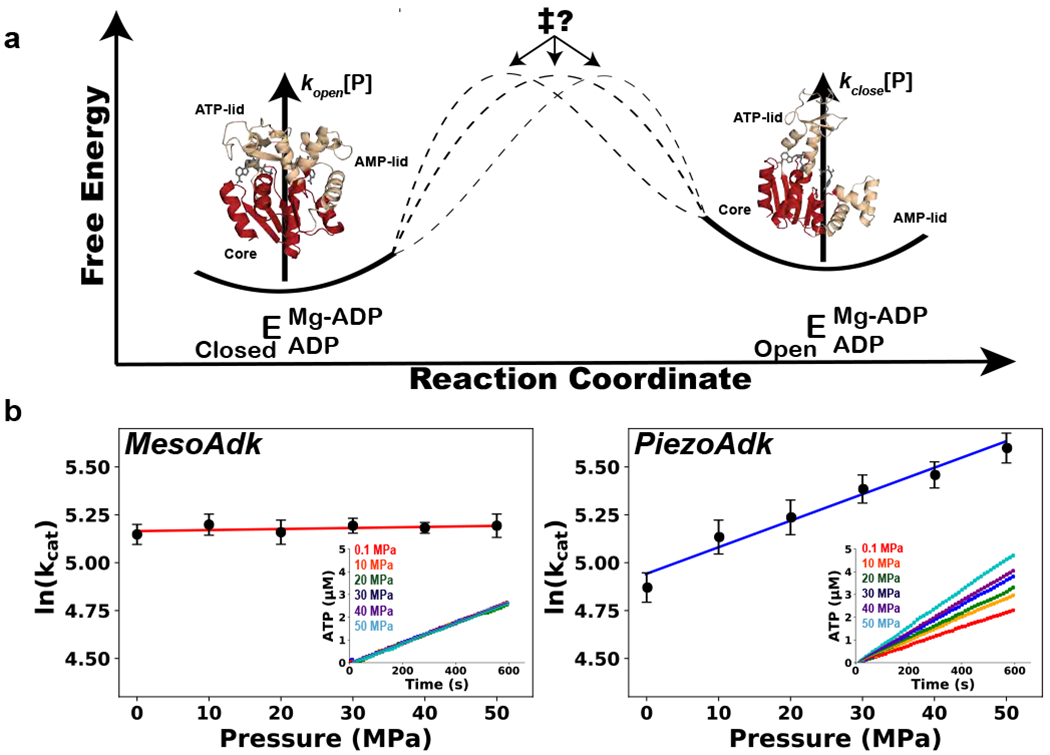
(a) Simplified Adk free-energy landscape showing only the rate-limiting step of lid-opening. The ground states (open and closed conformations of mesoAdk; core is shown in red, ATP- and AMP-lids in gold and nucleotides in grey) and pressure-dependent rates of opening and closing (kopen[P], kclose[P]) can be determined experimentally, but not the nature of the TSE (indicated by ‡). Dotted lines depict possible transition pathways with arrows indicting the possible TSE locations along the reaction coordinate. (b) MesoAdk and piezoAdk enzyme activity as a function of pressure measured using a coupled assay, described in methods, under saturating nucleotide concentrations at 20 °C. Insert shows the time traces of ATP production. Uncertainties of each point were calculated from the standard deviation of triplicate measurements. Enzymatic rates were fitted only to a first order pressure function (Eq. 1, red and blue lines) as the ln (kcat) as the quadratic term was not significant (p < 0.01) as determined by F-test.
We first compare the catalytic activity (kcat) of mesoAdk and piezoAdk as a function of pressure. Pressure is a known denaturant with typical unfolding pressures of 100 MPa or higher12,16. To circumvent trivial inactivation, enzymatic assays were performed at mild pressures between 0.1-50 MPa with a coupled continuous spectroscopic assay (Fig. 1b; Supplementary Fig. 1). While an organism’s enzymes are not necessarily imbued with adaptation to the surrounding pressure17,18, the pressure dependence for piezoAdk and mesoAdk parallels their organisms’ native environment. Catalytic turnover was virtually independent of pressure for mesoAdk, yielding an activation volume (ΔV‡) of −0.9 ± 1.0 mL/mol. In contrast, piezoAdk experienced a doubling of kcat from 0.1 to 50 MPa, translating into a ΔV‡ of −31.8 ± 3.0 mL/mol.
Lid-opening by Pressure Variable by NMR Relaxation.
Crucially, both enzymes exhibited comparable rates of catalysis at ambient pressure, indicating the differences ΔV‡ were not likely due to disparities in the principal mechanism of catalysis. However, to unequivocally determine that kcat describes the lid-opening process for both enzymes and at all pressures sampled, we measured lid-opening directly by 15N-TROSY CPMG relaxation dispersion NMR from 0.1-50 MPa (Fig. 2a). At saturating Mg2+-nucleotide concentrations (hence turnover under kcat conditions), CPMG relaxation techniques measure: (i) the lid-opening rate constant (kopen), (ii) the lid-closing rate constant (kclose) and (iii) the difference in chemical shifts between states (Δδ)19. The pressure dependences of kopen and kclose yield the three PMV values between the TSE and closed or open conformations and between closed and open ground states (ΔV‡-closed, ΔV‡-open, ΔVclosed-open)9.
Figure 2 |. Dynamic and structural differences of Adk under pressure.
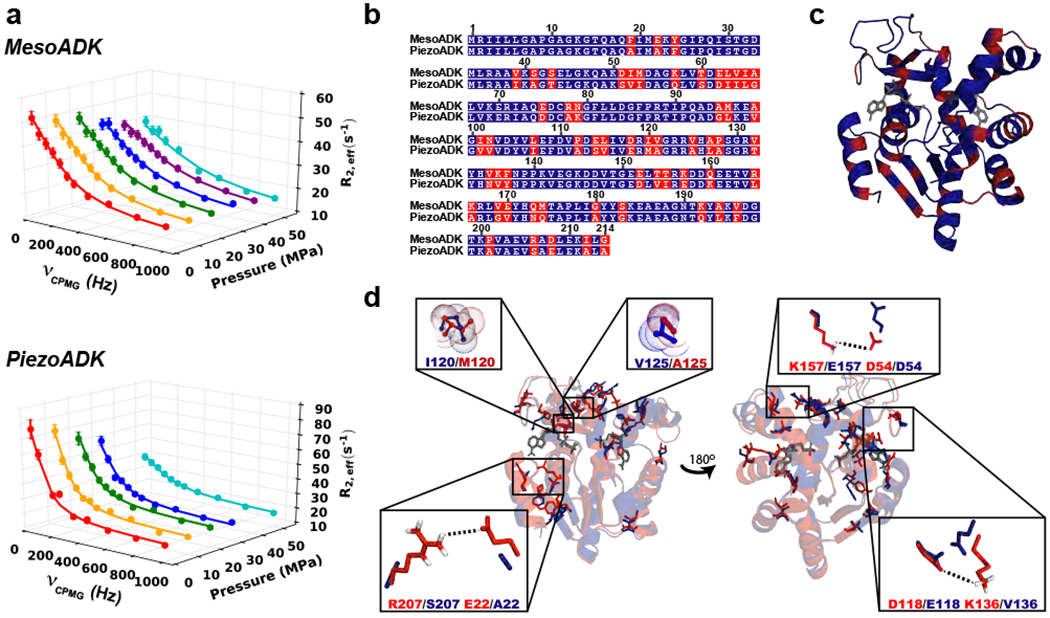
(a) 15N-TROSY CPMG relaxation dispersion NMR experiments at 20 °C for mesoAdk and piezoAdk saturated with Mg2+/ADP between 0.1-50 MPa. Representative residues for both enzymes are shown, each having a clear pressure dependence that results in a reduced exchange contribution with pressure. Residues shown are V196 and A176 for mesoAdk and piezoAdk, respectively. Uncertainties in R2,eff were estimated from the variance in intensity of non-exchanging residues. (b) Sequence alignment of mesoAdk and piezoAdk (identity in blue, differences in red). (c) Sequence differences colored onto piezoAdk structure (4K46; identity in blue, non-identity in red, nucleotides in gray). (d) Structural alignment of mesoAdk (red) and piezoAdk (blue) performed using THESEUS36. Residues that may induce ΔV‡ are depicted in stick representation with several examples enlarged.
To obtain volume and kinetic parameters from the dispersion profiles, exchanging residues were globally fit over all pressures (see Methods) (Fig. 2a; Table 1; Supplementary Fig. 2). Both mesoAdk and piezoAdk displayed dynamic hotspots similarly dispersed over the entire protein and chemical shift differences of similar magnitude (Supplementary Fig. 3). The pressure dependences of chemical shifts were also relatively small, indicating no alternative unfolding processes were occurring (Supplementary Figs. 4 and 5). For both enzymes, the extracted ΔV‡-closed were strikingly similar to the ΔV‡ values determined from the turnover experiments (Table 1). The agreement between these two terms (ΔV‡-closed and ΔV‡) confirms that the opening transition is rate-limiting for enzyme turnover at all sampled pressures for mesoAdk and piezoAdk. Notably, the closing rate (kclose), which does not influence kcat, exhibited a large pressure dependence (ΔV‡-open) for both enzymes.
Table 1 |. Comparison of partial molar volume changes from enzyme turnover and NMR relaxation experiments.
The uncertainty in enzyme turnover ΔV‡ was determined from the standard error of the linear fit (see Methods). Uncertainties in NMR relaxation dispersion global fit parameters were calculated from the covariance matrix.
| Enzyme Turnover | NMR Relaxation Dispersion | |||||
|---|---|---|---|---|---|---|
| kcat, 0.1 MPa (s−1) | ΔV‡ (mL/mol) | kopen, 0.1 MPa (s−1) | ΔV‡-closed (mL/mol) | ΔV‡-open (mL/mol) | ΔVclosed-open (mL/mol) | |
| MesoAdk | 172 ± 9 | −0.9 ± 1.0 | 297 ± 75 | −0.5 ± 0.6 | −24.9 ± 2.3 | −24.4 ± 2.4 |
| PiezoAdk | 131 ± 10 | −31.8 ± 3.0 | 100 ± 12 | −35.3 ± 14.7 | −41.6 ± 3.6 | −6.3 ± 15.1 |
| K157E/Q160K mesoAdk | 209 ± 4 | −8.6 ± 0.4 | 200 ± 8 | −8.7 ± 6.1 | −21.9 ± 1.4 | −13.2 ± 6.3 |
While the pressure dependence of opening determined by NMR relaxation dispersion (ΔV‡-closed) and enzyme turnover (ΔV‡) were equivalent, the observed rate constants, kcat and kopen, were not (Table 1). This apparent discrepancy arises from each method’s experimental conditions. Relaxation dispersion experiments are performed at equilibrium where the observed opening rate constant is a population-weighted average from both ATP/AMP and ADP/ADP enzyme states. In contrast, ADP is the sole nucleotide substrate in the coupled assay and, therefore, only opening from the ATP/AMP state is observed15. Despite this dissimilarity, the PMV of lid opening appears to be independent of the encapsulated nucleotides, leading to equivalent ΔV‡ and ΔV‡-closed.
X-Ray Crystallography of mesoAdk and piezoAdk.
The comparison of two homologous enzymes provides an opportunity for distilling detailed structural information about the TSE via structure-guided mutations. Ideally, a subset of piezoAdk’s residues could be swapped into mesoAdk to induce pressure-driven activation. With only 73% sequence identity (Fig. 2b), blind mutagenesis seems fruitless, especially considering combinations. Therefore, we first solved the unknown structure of piezoAdk bound with AMP and ADP (Fig. 2c; Supplementary Table 1). PiezoAdk’s large negative ΔV‡ likely originates from hydration of either charged residues or cavities in the TSE relative to the closed conformation seen in the X-ray structure. Comparing the 57 amino acid differences between the closed structures of mesoAdk and piezoAdk yielded 17 putative candidates which fit our criteria for potentially generating a negative ΔV‡ in piezoAdk (Fig. 2d; Supplementary Table 2).
Targeted Molecular Dynamics Simulations of Adk Opening.
To gain mechanistic insight into the nature of opening and to narrow down our list of 17 candidates further, we performed fully atomistic targeted molecular dynamic simulations (TMD) for mesoAdk and piezoAdk in explicit solvent. Starting from the closed, nucleotide-bound ternary complex (2ECK20/4K46), the opening trajectory involved separation of the ATP- and AMP-lids by gradual movements towards the open conformation (4AKE21) (Fig. 3a; Supplementary Fig. 6) It is worth noting that TMDs are biased simulations, and thus do not deliver free-energy landscapes22. Consequently, it is not possible to extract the position of the transition state along the pathway. However, we reasoned that at specific points along the reaction coordinate, the opening pathways for piezoAdk and mesoAdk may differ in either their cavities or side-chain hydration, providing a means to understand the atomic cause underlying the experimentally different ΔV‡.
Figure 3 |. Putative transition-state ensemble identified from differential solvation in TMD simulations.
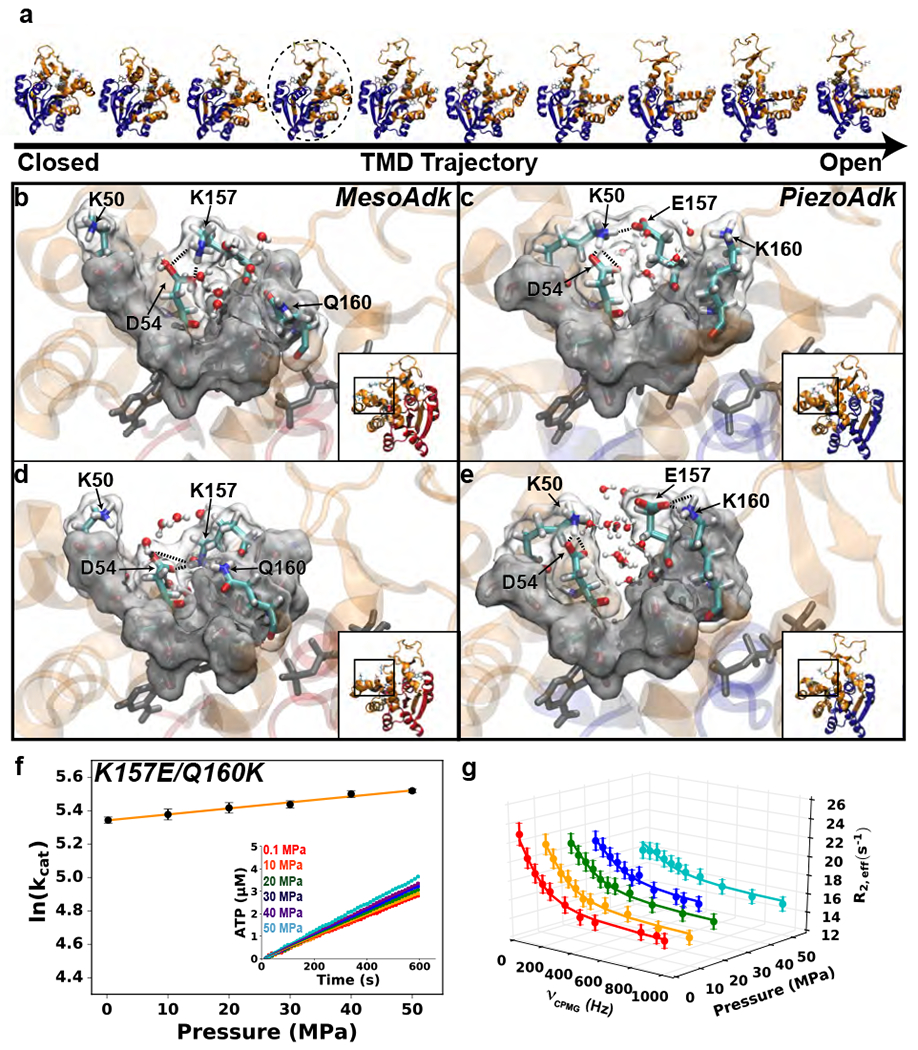
(a) Snapshots taken along the piezoAdk’s TMD trajectory from closed to open states. The dotted circle indicates where along the trajectory notable solvation differences are observed for mesoAdk and piezoAdk. (b-c) Close-up showing the lid-interface for mesoAdk (b) and piezoAdk (c) at onset of the TMD trajectories. Relevant side chains are labeled, water molecules are shown in red and white, and surface representation is used to show the boundary of solvent and protein. Insets of whole Adk are shown to illustrate the domain topology and salt-bridge location at each snapshot. (d-e) Close-up showing the difference in solvation for mesoAdk (d) and piezoAdk (e) upon initial lid-opening (dotted circle in a). For piezoAdk, an influx of water is observed due to separation of E157 and K50, whereas for mesoAdk, a direct salt bridge between K157 and D54 prevents hydration. (f) Double mutant K157E/Q160K mesoAdk enzyme activity as a function of pressure (same conditions and error analysis as in Fig. 1B). (g) Representative profiles (D61) for 15N TROSY-CPMG relaxation dispersion of K157E/Q160K mesoAdk saturated with Mg2+/ADP between 0.1-50 MPa. Corresponding ΔV‡-closed calculated for lidopening from a global fit (Table 1) matches the ΔV‡ observed from enzyme turnover (f). Errors calculated as described in Fig 2.
As expected with homologs, the opening trajectories were nearly equivalent (Fig 3a; Supplementary Fig. 6). Interestingly, early in the opening process, a significant difference in water molecules was observed at the lid-interface resulting from differences in salt bridges between the homologs. For both enzymes, the closed forms prevent the exchange of water molecules between the internal nucleotide cavity and bulk solvent by a tight interaction between the ATP- and AMP-lids (Fig. 3b,c)15. Predictably, the open form is completely solvent exposed. Therefore, the timing of solvation along this interface presents an opportunity for pressure activation, if prior to or at the TSE. In mesoAdk, K157 spans the interface to form a salt bridge with D54 (Fig. 3b,d), while in piezoAdk, a charge swap to glutamate forces El57 to bond with the more distant K50 (Fig. 3c). Almost immediately upon AMP-lid movement, the increased distance in piezoAdk leads to dissociation of the E157-K50 charged interaction. Once separated, E157 forms an intra-helix charged interaction with K160, preventing obstruction of the interface to solvent. Consequently, water molecules surge into the lid interface early in the open process for the piezophile, solvating several charged residues (Fig. 3c, Supplementary Video 1).
Validation of TSE by site-Directed Mutagenesis of mesoAdk.
From our TMD findings, it is tempting to conclude that the large, negative ΔV‡ observed for piezoAdk originates from lid-interface hydration occurring before or coinciding with the TSE. If correct, mesoAdk’s pressure independence arises from the D54-K157 salt bridge preventing lid-interface solvation in the TSE (Fig. 3d). To test this hypothesis, we disrupted this salt bridge by introducing the analogous residues from piezoAdk (K157E/Q160K). The double mutant indeed turned mesoAdk into a pressure-dependent enzyme with a ΔV‡ of −8.6 ± 0.4 mL/mol (Fig. 3f). Furthermore, relaxation dispersion experiments between pressures of 0.1-50 MPa were fit to a ΔV‡-closed of −8.7 ± 6.1 mL/mol (Fig. 3g; Table 1; Supplementary 2 and 3), within experimental error of ΔV‡ from the enzyme turnover. The agreement between volumetric terms found from enzyme turnover and relaxation dispersion experiments verifies that the measured ΔV‡ correctly reports only on lid-opening (Table 1). Additionally, comparison of 1H-15N TROSY HSQC spectra confirmed that this double mutation resulted only in local structural changes (Supplementary Figs. 5 and 7).
The double mutant, while delivering a substantial negative change in ΔV‡ provides only 25% of the full ΔV‡ effect seen for piezoAdk. The measured ΔV‡ of −8.6 mL/mol corresponds approximately to the solvation of a single buried residue or several partially solvated residues23. Therefore, we conjectured that additional residues along the interface contribute to piezoAdk’s pressure effect. Further down the interface of mesoAdk, the core domain residue E170 forms dual charged interactions between the backbone amide of L58 and the sidechain of K57, both in the AMP-lid (Fig. 4a,c). Similar to D54-K157, the piezophile has a disrupted electrostatic network with a E170/V170 substitution, resulting in interface solvation directly upon the separation of the core domain and AMP-lid (Fig. 4b,d). Remarkably, adding this third swap mutation into mesoAdk (K157E/Q160K/K170V) converts the mesophile into a pressure-dependent enzyme with ΔV‡ values comparable to piezoAdk (ΔV‡ = −23.5 ± 3.3 mL/mol, Fig. 4e).
Figure 4 |. Triple mutation induces full pressure activation in mesoAdk.
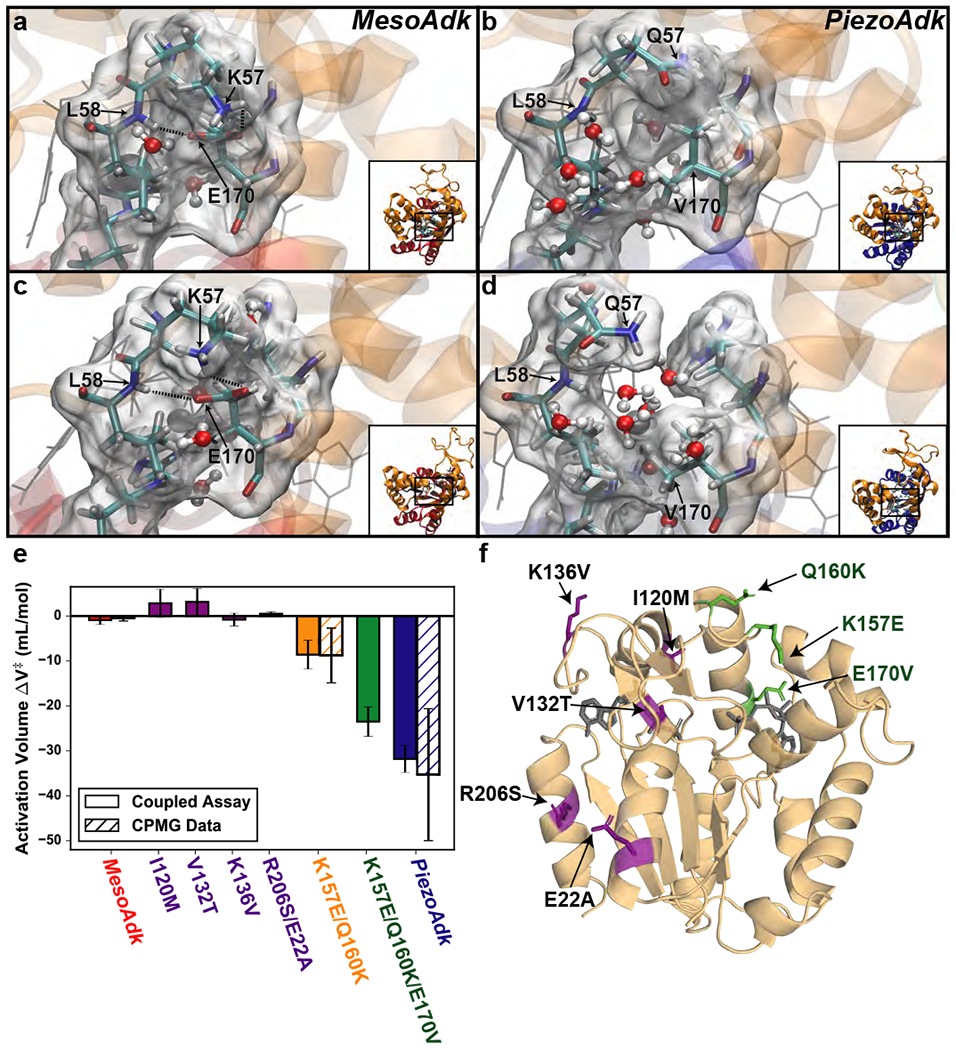
(a-b) Close-up showing the Core/AMP-lid interface for mesoAdk (a) and piezoAdk (b) at start of TMD trajectories (same snapshot setup as Fig. 3). (c-d) Close-up illustrating the difference in solvation for mesoAdk (c) and piezoAdk (d) caused by a disrupted salt bridge in piezoAdk. In mesoAdk, E170 maintains dual interactions between the backbone of L58 and the charged group of K57. In contrast, piezoAdk’s V170 possesses neither interaction. Consequently, water molecules spill into the interface earlier in the opening trajectory. (e) Comparison of ΔV‡ measured by enzyme turnover and NMR dynamics for mesoAdk, piezoAdk, and mutant forms of mesoAdk. Uncertainties were calculated as described in the legend of Table 1. (f) Residues mutated in mesoAdk variants are plotted onto the crystal structure (2ECK20). Lid-interface mutations (green) increase the activation volume, while control mutants away from the interface (purple) had no effect. Nucleotides are shown in gray.
As important controls, we designed and experimentally tested a series of mutations in mesoAdk (Fig. 4f) from the list of 17 candidates that could in principle provide changes in PMV (see criteria described above), but are not involved in the differential solvation of our putative TSE. Mutating these residues in mesoAdk would serve as additional validation for our postulated structural description of the TSE if they did not induce a change in activation volume. Significantly, none of these mutants invoked a substantial change in activation volume (Fig. 4e).
Statistical and Structural Analysis of the TSE.
In summary, through only three point mutations selected based on our high-pressure enzymatic and NMR relaxation dispersion experiments, combined with X-ray structures of the ground states and TMD simulations, we conferred upon mesoAdk nearly the complete pressure activation seen in piezoAdk. Additionally, a TMD simulation of the triple mutant mesoAdk possessed nearly identical solvation events as seen in piezoAdk, strongly validating that the TSE occurs after piezoAdk hydration and before the respective events in mesoAdk (Supplementary Fig. 8). To bracket the TSE more precisely, a series of TMD simulations for piezoAdk (n = 71) and mesoAdk (n = 71) were performed to quantify the TSE probability along the opening pathway (see Methods; Supplementary Fig. 9). To define the orientation of both lids separately, we measured the AMP- and ATP-lid angles during each trajectory24 (Supplementary Fig. 9a, see Methods for lid angle descriptions). The location of hydration events on these time-independent axes was identified and used to bracket the TSE along ATP-lid/AMP-lid opening (Supplementary Fig. 9b,c). Strikingly, confined by the set of hydration events in piezoAdk and mesoAdk, the TSE appears to occur at the onset of AMP-lid movement (Supplementary Fig. 9d–f). In contrast, the ATP-lid movement does not appear to be significantly correlated with the TSE.
Having defined the location of the TSE, the final question remains: what represents the energy barrier for opening? Firstly, the movement of the AMP-lid involves a dissociation of multiple Van der Waals and electrostatic contacts, which break in a correlated, rigid body fashion (Supplementary Fig. 10c,d). Additionally, we observe consistent phi/psi angle changes in the hinge regions of Adk occurring within the bracketed TSE (Supplementary Fig. 10e,f). While reading into the individual details of atomic movement in a TMD is unreliable due to the imposed bias, the collective angular and contact changes likely sum into an energy barrier that limits Adk’s conformational change.
Discussion
Our finding is particularly consequential given the extensive computational literature on the adenylate kinase conformational landscape. Multiple computational studies using more sophisticated simulation methods than TMD have resulted in widely different transition states along the opening pathway for Adk. Many of these reports are not in line with ΔV‡ we report here, with observed TSEs having half or nearly fully open AMP-lids24–28. The general pathways of opening are, however, quite similar between these studies, and largely comparable to the pathways in our TMD simulations. This is most likely due to the diffusive nature of the opening, which results from several hinge motions. Our results underscore the power of the synergistic experimental/computational approach applied here to provide reliable, experimentally determined metrics for defining the intrinsically brief TSE. Our experimental data helps address the controversy from the computational studies.
Hydrostatic pressure has appeared a powerful biophysical perturbant for probing the thermodynamic, kinetic and structural nature of protein energy landscapes29,30. Early recognition that elevated pressure unfolds proteins led to extensive experimental studies to understand the principle energetic forces responsible for protein folding through their volumetric changes23. Extending the use of pressure as a tool to study folded enzymes has provided uniquely valuable information on the mechanisms of catalysis31–33. Here we apply these concepts to characterize the free-energy landscape within the folded state progressing through the catalytic cycle, leading to structural insights about the TSE of protein motion. While ADK’s rate-limiting conformational change was investigated here, enzyme function involves a variety of structural transitions, many of which are not associated with the largest kinetic barrier of overall turnover. Importantly, the approach of pressure dependent NMR relaxation, demonstrated here, opens the door for obtaining information about TSE of any conformational transition, irrespective whether they are rate-limiting or not. Moreover, this method is not limited to enzymes, but is directly applicable to other systems with biologically relevant conformational changes. The nature of the conformational transition and the methods applied here are reminiscent of elegant studies in protein folding TSE34,35. While volumetric terms yielded from pressure experiments appear to be of low resolution, results obtained for folding and here for enzyme catalysis illustrate how pressure can bridge kinetic results to structures of the TSE, capturing fleeting states that dictate the speed limit of protein conformational change.
Methods:
Protein Expression and Purification.
MesoAdk was grown and purified as described in 37. For piezoAdk, the P. profundum genomic DNA was a generous gift of Dr. Douglass Bartlett’s laboratory. The piezoAdk gene from P. profundum was cloned by PCR and ligated into a T7 pET-17b vector with ampicillin resistance. PiezoAdk was expressed in pACYC cells in the presence of ampicillin and kanamycin antibiotics. pACYC cells were grown to optical density (OD600) of 0.6-0.8 at 37 °C and induced with 0.5 mM isopropyl β-D-1-thiogalactopyranoside (IPTG) overnight at 17 °C. Cells were harvested after ~12 h and purified with the same procedure as mesoAdk.
High-Pressure Enzyme Turnover.
High pressure was applied in the steel High Pressure Cell System (HP Cell) purchased from ISS Inc. Reactions were performed in a 6x6 mm square cuvette capped with a Teflon cap purchased from ISS with filtered ethanol as a pressurization fluid. Catalytic activity for all Adks were measured spectroscopically using a coupled assay. Briefly, the coupling enzymes (hexokinase and glucose-6-phosphate dehydrogenase) were preincubated with the nucleotide mixture (5 mM ADP and 5 mM MgCl2) and coupling enzymes’ substrates (glucose and NAD+) for ~5 min. The steady-state reaction was then initiated by the addition of Adk (250 pM) and mixing thoroughly. Pressure was then applied and absorbance change monitored by redirecting the incident light from a Cary 50 spectrophotometer through a Varian Fiber Optics Coupler Assemble and a fiber optic cable to the HP Cell. The change in absorbance was measured by an external detector attached to the opposing side of the HP Cell window. Reaction conditions were 20 °C in a buffer consisting of 50 mM Tris, 50 mM NaCl, 2 mM TCEP, 0.3 mg/mL bovine serum albumin, pH 7.0. Turnover was measured between 0.1-100 MPa and data between 0.1-50 MPa was used for fitting the pressure dependence of turnover. Each sample was only measured at a single pressure. Measured kcat values were fit to a first order pressure equation:
| (Eq. 1) |
High-Pressure NMR.
High-pressure NMR data was acquired on an Agilent Unity Inova 600 MHz four-channel spectrometer equipped with a triple-resonance room-temperature probe-head. Experiments were performed in the specialized Static Pressure NMR Cell (SP NMR) purchased from Daedalus Innovations LLC. NMR protein samples were 1-2 mM Adk, 20 mM MgCl2 20 mM ADP, 50 mM Tris, 50 mM NaCl, 2 mM TCEP, pH 7.0 in a total volume of 350 μL, measured at 20 °C. After addition of sample to the bottom of the SP NMR tube, light mineral oil was added to fill the remaining volume. Samples were pressurized from 0.1-100 MPa by the Xtreme-60 Syringe Pump also purchased from Daedalus Innovations LLC, and pressure was maintained automatically by the syringe pump during data collection38. Light mineral oil was used as the pressurization fluid.
15N TROSY CPMG relaxation experiments19 were measured with a 40 ms constant-time relaxation period, two second relaxation delay between transients, and refocusing field strengths between 50-1000 Hz collected in an interleaved fashion at pressures between 0.1-100 MPa. Additionally, to better separate population and chemical shift parameters, 15N TROSY CPMG relaxation dispersion experiments were also performed on a Bruker Avance 800 MHz at ambient pressure (0.1 MPa). Data was processed with the NMRPipe/NMRDraw software39 and analyzed with CcpNmr40. Peak intensities were fitted with PINT41 and globally fit at pressures between 0.1-50 MPa and both ambient pressure field strengths via a modified Carver-Richards equation for two-site exchange42 with in-house Python scripts using Lmfit43. Forward and backwards rate constants were modified to include a linear-pressure dependency (forward equation shown):
| (Eq. 2) |
The chemical shift difference between both states was also modified to include a linear pressure dependency:
| (Eq. 3) |
The exchange independent relaxation term (R2, inf) was fit separately for each pressure and field. Residues were chosen for global fitting only if they possessed a |Δδ| of > 0.15 ppm at ambient pressures. Both fields and all pressures were globally fit simultaneously. An alternative quadratic pressure dependence was also tested, but found not to be significant by F-test (p < 0.01).
For fitting the pressure dependence of proton and nitrogen chemical shift, the general equation for the pressure dependence on chemical shift was used. The quadratic term (C2) was found to be insignificant.
| (Eq. 4) |
X-Ray Crystallography.
Crystals of piezoAdk were grown by vapor diffusion and hanging drop. For experimental setup, a 1 μL of solution of 20 mg/mL piezoAdk in 20 mM MgADP, 50 mM Tris, 5 mM NaCl, 2 mM TCEP, pH 7.0 was mixed with 1 μL of 2.3 M ammonium sulfate, 100 mM imidazole, pH 7.9. Crystals were grown at 18 °C and flash-frozen in liquid nitrogen without cryo-protectant. Diffraction was collected at 100 K at the Advanced Light Source beamline 5.0.2 (Berkeley, CA, USA). Data was processed and scaled with Mosflm and Scala44,45. Phasing was performed in Phaser46 by molecular replacement using the mesoAdk structure, 2ECK20, as the starting model. Refinement and model building was accomplished with Phenix47 and Coot48, respectively.
Targeted Molecular Dynamics simulations.
All simulation were prepared and performed with GROMACS version 2016.449 and the PLUMED 2.4.150 plugin. Crystal structures of the closed enzyme for mesoAdk and piezoAdk (2ECK20 and 4K46, respectively) as well as the open structure for mesoAdk (4AKE21) were used for setting up start and end points. Due to the lack of an open crystal structure for piezoAdk, the end point was modeled using SWISS-MODEL51. Both closed crystal structures were solved with ADP in the ATP-site, but had AMP bound in the AMP-site; therefore, during structure preparation, ADP was modeled instead of AMP to reflect the active form of the enzyme (ADP:ADP). Before each TMD, all structures were parametrized using the CHARMM3652 force field, placed in a dodecahedron box with a minimal distance of 1.2 nm to the box edge and energy-minimized after solvation by explicit solvent (TIP3P)53 with the built-in GROMACS function ‘solvate’. Protonation states for ionizable residues and ADP as well as histidine tautomers were generated with the pdb2gmx command included in Gromacs 2016.449 (ADP molecules are fully deprotonated, His134 and His172 are in the Nε2 tautomer for both mesoAdk and piezoAdk. His126 is in Nδ2 tautomer for mesoAdk Nε2 tautomer for piezoAdk. Asp/Glu/Lys/Arg groups were all in charged protonation states). Periodic boundary conditions were applied for all systems. To ensure net-neutrality of the system, eight and ten Na+ ions were added to the mesoAdk and piezoAdk systems, respectively. After heating of the system over 5 ns in the NVT ensemble, followed by 5 ns in the NPT ensemble, each structure was equilibrated for 10 ns in an unconstrained MD-run. For all unconstrained MD-runs as well as the TMDs, the Nose-Hoover thermostat54,55 was used with a coupling constant of 0.6 ps and reference temperature of 298 K. To maintain constant pressure, the Parrinello-Rahman barostat56 was used with a coupling constant of 1.0 ps and a reference pressure of 0.1 MPa. To sample multiple start and end structures, 30 snapshots within the last 2.5 ns of the equilibration run were selected for each of the closed and open structures. Start and end equilibrated structures for all Adks tested are included as a Supplementary Data 1–6. TMDs for mesoAdk and piezoAdk were started by linearly increasing the force constant to 2000 kJ/mol or 4000 kJ/mol over 1 ns. After 1 ns, the RMSD between the end structure and the current structure was minimized over varying times (60 replicas of 5 ns, 2 replicas of 10 ns, 2 replicas of 20 ns, and 7 replicas at 50 ns length). Structures were aligned using backbone atoms of residues 1-8, 79-108 and 184-197 after which the RMSD for the total protein was calculated. For the triple mutant (K157E/Q160K/E170V), the three mutations were added to the mesoAdk crystal structure (2ECK20), and then the same procedure as above was performed. Videos of MD simulations were rendered by averaging over 125 ps per frame to present smooth motion for the protein and water molecules.
Hydration Event Determination, TSE Bracketing and Analyzes.
Protein trajectories were visualized with VMD57. Residues involved in lid hydration were determined manually by observing the movement of water molecules along the interface of the AMP-lid. Initial determination of hydration events was performed by manual inspection, correlating the movements of key residues (54, 57, 58, 157, and 170) with interface solvation. While residue movement was not completely correlated with hydration, solvation always occurred once these key contacts had dissociated by more than 5.5 Å. Therefore, using this generous cutoff, three hydration events (157-54, 170-57, and 170-58) could be calculated for each trajectory by determining the point when each contact had separated by more than 5.5 Å with no re-association lasting longer than 50 ps.
To bracket the location of the TSE, hydration events were first determined for all 142 TMDs. To compare trajectories on time-independent axes, two angular collective variables, AMP-lid and ATP-lid angles, were calculated for each trajectory. The ATP-lid angle defines the change of center of mass orientations of the ATP-lid (a.a. 123-155), hinge (a.a. 161-165), and core domain (a.a. 1-8, 79-85, 104-110, 190-198) (i.e. angle between hinge-ATP and hinge-core), whereas the AMP-lid angle is formed by the AMP-lid (a.a. 50-59), core domain (a.a 1-8, 79-85, 104-110, 190-198), and hinge (a.a. 161-165) (i.e. angle between core-AMP and core-hinge)24. To bracket the TSE probability along each collective variable, the timing of each hydration event was correlated with the respective collective variable. The mesoAdk TSE probability was then calculated with equation 5:
| (Eq 5.) |
where x is the collective variable of interest, Hi is the respective collective variable value at the time when all hydration events had occurred, and n is the number of TMD simulations (n = 71 for both). To calculate the TSE probability for piezoAdk, TSEPiezo, we used Eq. 5 with the inequalities reversed. We then calculate the total likelihood of at any collective variable value corresponding to the TSE as the joint likelihood, TSEMeso x TSEPiezo.
To access the structural changes which may describe the energy barrier of the TSE, phi/psi angles were calculated for each residue. For each TMD, the angles over the course of the trajectory were binned with a set of Gaussian distributions (1, 2, 3, …). The BIC score was used to determine the number of Gaussian distributions required to best fit the data. Angular transitions were then considered to occur when a phi/psi angle shifted from being in one distribution to another. The TSE probability, based upon AMP-lid angle, was considered at the time of each transition and the phi/psi change was then stored if the TSE probability was above 75%. Finally, phi/psi angle changes were considered significant if they occurred in over 25% of the simulations.
An analogous procedure was performed to determine what contacts dissociate during the TSE. Briefly, all contacts which were less than 4.5 Å in the closed state were assessed over the course of each trajectory. Contact dissociation was considered to occur once residues had separated by more than 4.5 Å without re-association for over 50 ps. The TSE probability at the time of contact dissociation was then considered and stored if the TSE probability was in the top 25th percentile. Significant dissociations occurred in over 25% of the trajectories.
Data Availability.
Structure factors and refined model of piezoAdk has been deposited in the PDB under the accession code 4K46. The data that support the plots within this paper and other findings of this study are available from the corresponding author upon reasonable request.
Code availability.
In-house python scripts available from the corresponding author on request (dkern@brandeis.edu).
Supplementary Material
Acknowledgments
We are grateful for D.V. Pachov’s preliminary TMD simulations on mesoAdk and piezoAdk and discussions, F. Pontiggia with guidance for the TMD simulations, and thank J. Wand and R. Peterson for the initial exploratory pressure NMR experiments. Finally, we thank D. Bartlett for generously gifting P. profundom genomic DNA. This work was supported by the Howard Hughes Medical Institute, the Office of Basic Energy Sciences, Catalysis Science Program, U.S. Dept. of Energy, award DE-FG02-05ER15699 to D.K. and NIH (GM100966) to M.F.H and D.K. R.O. was supported as an HHMI fellow of the Damon Runyon Cancer Research Foundation (DRG-2114-12). Computational resources were provided by NSF XSEDE computing resources (MCB090163) and the Brandeis HPCC which is partially supported by DMR-1420382. We thank the Advanced Light Source (ALS), Berkeley, CA, USA for beamline use. The Berkeley Center for Structural Biology is supported in part by the National Institutes of Health, National Institute of General Medical Sciences, and the HHMI. The ALS is supported by the director, Office of Science, Office of Basic Energy Sciences, of the U.S. Department of Energy under contract DE-AC02-05CH11231.
Footnotes
Competing Interests
The authors declare no competing interests.
References:
- 1.Boehr DD, McElheny D, Dyson HJ & Wright PE The dynamic energy landscape of dihydrofolate reductase catalysis. Science 313, 1638–1642, (2006). [DOI] [PubMed] [Google Scholar]
- 2.Sekhar A & Kay LE NMR paves the way for atomic level descriptions of sparsely populated, transiently formed biomolecular conformers. Proc. Natl Acad. Sci. USA 110, 12867–12874, (2013). [DOI] [PMC free article] [PubMed] [Google Scholar]
- 3.Kornev AP & Taylor SS Dynamics-Driven Allostery in Protein Kinases. Trends Biochem. Sci 40, 628–647, (2015). [DOI] [PMC free article] [PubMed] [Google Scholar]
- 4.Baldwin AJ & Kay LE NMR spectroscopy brings invisible protein states into focus. Nat. Chem. Biol 5, 808–814, (2009). [DOI] [PubMed] [Google Scholar]
- 5.Schramm VL Enzymatic transition states, transition-state analogs, dynamics, thermodynamics, and lifetimes. Annu. Rev. Biochem 80, 703–732, (2011). [DOI] [PMC free article] [PubMed] [Google Scholar]
- 6.Laidler KJ & King MC The Development of Transition-State Theory. J. Phys. Chem 87, 2657–2664, (1983). [Google Scholar]
- 7.Royer CA The nature of the transition state ensemble and the mechanisms of protein folding: a review. Arch. Biochem. Biophys 469, 34–45, (2008). [DOI] [PubMed] [Google Scholar]
- 8.Zhang Y et al. High Pressure ZZ-Exchange NMR Reveals Key Features of Protein Folding Transition States. J. Am. Chem. Soc 138, 15260–15266, (2016). [DOI] [PubMed] [Google Scholar]
- 9.Korzhnev DM et al. Probing the transition state ensemble of a protein folding reaction by pressure-dependent NMR relaxation dispersion. J. Am. Chem. Soc 128, 5262–5269, (2006). [DOI] [PubMed] [Google Scholar]
- 10.Akasaka K Probing conformational fluctuation of proteins by pressure perturbation. Chem. Rev 106, 1814–1835, (2006). [DOI] [PubMed] [Google Scholar]
- 11.Roche J et al. Effect of internal cavities on folding rates and routes revealed by real-time pressure-jump NMR spectroscopy. J. Am. Chem. Soc 135, 14610–14618, (2013). [DOI] [PubMed] [Google Scholar]
- 12.Royer CA Revisiting volume changes in pressure-induced protein unfolding. Biochim. Biophys. Acta 1595, 201–209, (2002). [DOI] [PubMed] [Google Scholar]
- 13.Mitra L, Smolin N, Ravindra R, Royer C & Winter R Pressure perturbation calorimetric studies of the solvation properties and the thermal unfolding of proteins in solution--experiments and theoretical interpretation. Phys. Chem. Chem. Phys 8, 12490–1265, (2006). [DOI] [PubMed] [Google Scholar]
- 14.Vezzi A et al. Life at depth: Photobacterium profundum genome sequence and expression analysis. Science 307, 1459–1461, (2005). [DOI] [PubMed] [Google Scholar]
- 15.Kerns SJ et al. The energy landscape of adenylate kinase during catalysis. Nat. Struct. Mol. Biol 22, 124–131, (2015). [DOI] [PMC free article] [PubMed] [Google Scholar]
- 16.Masson P & Balny C Linear and non-linear pressure dependence of enzyme catalytic parameters. Biochim. Biophys. Acta. Gen. Subj 1724, 440–450, (2005). [DOI] [PubMed] [Google Scholar]
- 17.Hay S et al. Are the Catalytic Properties of Enzymes from Piezophilic Organisms Pressure Adapted? Chembiochem 10, 2348–2353, (2009). [DOI] [PubMed] [Google Scholar]
- 18.Hay S, Sutcliffe MJ & Scrutton NS Promoting motions in enzyme catalysis probed by pressure studies of kinetic isotope effects. Proc. Natl Acad. Sci. USA 104, 507–512, (2007). [DOI] [PMC free article] [PubMed] [Google Scholar]
- 19.Loria JP, Rance M & Palmer AG 3rd. A TROSY CPMG sequence for characterizing chemical exchange in large proteins. J. Biomol. NMR 15, 151–155, (1999). [DOI] [PubMed] [Google Scholar]
- 20.Berry MB, Bae E, Bilderback TR, Glaser M & Phillips GN Jr. Crystal structure of ADP/AMP complex of Escherichia coli adenylate kinase. Proteins 62, 555–556, (2006). [DOI] [PubMed] [Google Scholar]
- 21.Muller CW & Schulz GE Structure of the Complex between Adenylate Kinase from Escherichia-Coli and the Inhibitor Ap5a Refined at 1.9 a Resolution - a Model for a Catalytic Transition-State. J. Mol. Biol 224, 159–177, (1992). [DOI] [PubMed] [Google Scholar]
- 22.Schlitter J, Engels M & Kruger P Targeted molecular dynamics: a new approach for searching pathways of conformational transitions. J Mol Graph 12, 84–89, (1994). [DOI] [PubMed] [Google Scholar]
- 23.Dill KA Dominant forces in protein folding. Biochemistry 29, 7133–7155, (1990). [DOI] [PubMed] [Google Scholar]
- 24.Li D, Liu MS & Ji B Mapping the Dynamics Landscape of Conformational Transitions in Enzyme: The Adenylate Kinase Case. Biophys J 109, 647–660, (2015). [DOI] [PMC free article] [PubMed] [Google Scholar]
- 25.Arora K & Brooks CL 3rd. Large-scale allosteric conformational transitions of adenylate kinase appear to involve a population-shift mechanism. Proc Natl Acad Sci U S A 104, 18496–18501, (2007). [DOI] [PMC free article] [PubMed] [Google Scholar]
- 26.Lee J, Joo K, Brooks BR & Lee J The Atomistic Mechanism of Conformational Transition of Adenylate Kinase Investigated by Lorentzian Structure-Based Potential. J Chem Theory Comput 11, 3211–3224, (2015). [DOI] [PubMed] [Google Scholar]
- 27.Unan H, Yildirim A & Tekpinar M Opening mechanism of adenylate kinase can vary according to selected molecular dynamics force field. J Comput Aided Mol Des 29, 655–665, (2015). [DOI] [PubMed] [Google Scholar]
- 28.Wang Y, Gan L, Wang E & Wang J Exploring the Dynamic Functional Landscape of Adenylate Kinase Modulated by Substrates. J. Chem. Theory Comput 9, 84–95, (2013). [DOI] [PubMed] [Google Scholar]
- 29.Charlier C et al. Study of protein folding under native conditions by rapidly switching the hydrostatic pressure inside an NMR sample cell. Proc. Natl Acad. Sci. USA 115, E4169–E4178, (2018). [DOI] [PMC free article] [PubMed] [Google Scholar]
- 30.Kremer W et al. Pulsed pressure perturbations, an extra dimension in NMR spectroscopy of proteins. J. Am. Chem. Soc 133, 13646–13651, (2011). [DOI] [PubMed] [Google Scholar]
- 31.Hay S, Johannissen LO, Hothi P, Sutcliffe MJ & Scrutton NS Pressure Effects on Enzyme-Catalyzed Quantum Tunneling Events Arise from Protein-Specific Structural and Dynamic Changes. J. Am. Chem. Soc 134, 9749–9754, (2012). [DOI] [PubMed] [Google Scholar]
- 32.Pudney CR et al. Parallel Pathways and Free-Energy Landscapes for Enzymatic Hydride Transfer Probed by Hydrostatic Pressure. Chembiochem 10, 1379–1384, (2009). [DOI] [PubMed] [Google Scholar]
- 33.Kalbitzer HR et al. Intrinsic Allosteric Inhibition of Signaling Proteins by Targeting Rare Interaction States Detected by High-Pressure NMR Spectroscopy. Angew. Chem. Int. Ed 52, 14242–14246, (2013). [DOI] [PubMed] [Google Scholar]
- 34.Fersht AR, Matouschek A & Serrano L The folding of an enzyme. I. Theory of protein engineering analysis of stability and pathway of protein folding. J. Mol. Biol 224, 771–782, (1992). [DOI] [PubMed] [Google Scholar]
- 35.Mitra L et al. V(i)-value analysis: a pressure-based method for mapping the folding transition state ensemble of proteins. J. Am. Chem. Soc 129, 14108–14109, (2007). [DOI] [PubMed] [Google Scholar]
- 36.Theobald DL & Wuttke DS Accurate structural correlations from maximum likelihood superpositions. PLoS Comput. Biol 4, e43, (2008). [DOI] [PMC free article] [PubMed] [Google Scholar]
- 37.Wolf-Watz M et al. Linkage between dynamics and catalysis in a thermophilic mesophilic enzyme pair. Nat. Struct. Mol. Biol 11, 945–949, (2004). [DOI] [PubMed] [Google Scholar]
- 38.Peterson RW & Wand AJ Self contained high pressure cell, apparatus and procedure for the preparation of encapsulated proteins dissolved in low viscosity fluids for NMR spectroscopy. Rev Sci Instrum 76, 1–7, (2005). [DOI] [PMC free article] [PubMed] [Google Scholar]
- 39.Delaglio F et al. NMRPipe: a multidimensional spectral processing system based on UNIX pipes. J. Biomol. NMR 6, 277–293, (1995). [DOI] [PubMed] [Google Scholar]
- 40.Vranken WF et al. The CCPN data model for NMR spectroscopy: development of a software pipeline. Proteins 59, 687–696, (2005). [DOI] [PubMed] [Google Scholar]
- 41.Ahlner A, Carlsson M, Jonsson BH & Lundstrom P PINT: a software for integration of peak volumes and extraction of relaxation rates. J. Biomol. NMR 56, 191–202, (2013). [DOI] [PubMed] [Google Scholar]
- 42.Carver JP & Richards RE General 2-Site Solution for Chemical Exchange Produced Dependence of T2 Upon Carr-Purcell Pulse Separation. J. Magn. Reson 6, 89-&, (1972). [Google Scholar]
- 43.Newville M, Stensitzki T, Allen DB & Ingargiola AA LMFIT: Non-Linear Least-Square Minimization and Curve-Fitting for Python, <http:/lmfit.github.io/lmfit-py> (2014). [Google Scholar]
- 44.Battye TGG, Kontogiannis L, Johnson O, Powell HR & Leslie AGW iMOSFLM: a new graphical interface for diffraction-image processing with MOSFLM. Acta Cryst. D 67, 271–281, (2011). [DOI] [PMC free article] [PubMed] [Google Scholar]
- 45.Winn MD et al. Overview of the CCP4 suite and current developments. Acta Cryst. D 67, 235–242, (2011). [DOI] [PMC free article] [PubMed] [Google Scholar]
- 46.Mccoy AJ et al. Phaser crystallographic software. J. Appl. Crystallogr 40, 658–674, (2007). [DOI] [PMC free article] [PubMed] [Google Scholar]
- 47.Adams PD et al. PHENIX: a comprehensive Python-based system for macromolecular structure solution. Acta Cryst. D 66, 213–221, (2010). [DOI] [PMC free article] [PubMed] [Google Scholar]
- 48.Emsley P, Lohkamp B, Scott WG & Cowtan K Features and development of Coot. Acta Cryst. D 66, 486–501, (2010). [DOI] [PMC free article] [PubMed] [Google Scholar]
- 49.Abraham MJ et al. GROMACS: High performance molecular simulations through multi-level parallelism from laptops to supercomputers. SoftwareX 1, 19–25, (2015). [Google Scholar]
- 50.Tribello GA, Bonomi M, Branduardi D, Camilloni C & Bussi G PLUMED 2: New feathers for an old bird. Comput Phys Commun 185, 604–613, (2014). [Google Scholar]
- 51.Biasini M et al. SWISS-MODEL: modelling protein tertiary and quaternary structure using evolutionary information. Nucleic Acids Res. 42, W252–W258, (2014). [DOI] [PMC free article] [PubMed] [Google Scholar]
- 52.Best RB et al. Optimization of the Additive CHARMM All-Atom Protein Force Field Targeting Improved Sampling of the Backbone phi, psi and Side-Chain chi(1) and chi(2) Dihedral Angles. J Chem Theory Comput 8, 3257–3273, (2012). [DOI] [PMC free article] [PubMed] [Google Scholar]
- 53.Jorgensen WL, Chandrasekhar J, Madura JD, Impey RW & Klein ML Comparison of Simple Potential Functions for Simulating Liquid Water. J Chem Phys 79, 926–935, (1983). [Google Scholar]
- 54.Nosé S A molecular dynamics method for simulations in the canonical ensemble. Mol. Phys 52, 255–268, (2006). [Google Scholar]
- 55.Hoover WG Canonical dynamics: Equilibrium phase-space distributions. Phys Rev A Gen Phys 31, 1695–1697, (1985). [DOI] [PubMed] [Google Scholar]
- 56.Parrinello M & Rahman A Polymorphic transitions in single crystals: A new molecular dynamics method. J Appl Phys 52, 7182–7190, (1981). [Google Scholar]
- 57.Humphrey W, Dalke A & Schulten K VMD: visual molecular dynamics. J. Mol. Graph 14, 33–38, 27–38, (1996). [DOI] [PubMed] [Google Scholar]
Associated Data
This section collects any data citations, data availability statements, or supplementary materials included in this article.
Supplementary Materials
Data Availability Statement
Structure factors and refined model of piezoAdk has been deposited in the PDB under the accession code 4K46. The data that support the plots within this paper and other findings of this study are available from the corresponding author upon reasonable request.