Supplemental Digital Content is available in the text.
Keywords: biomarkers, longitudinal analysis, mortality, mortality risk profiles, sepsis
Objectives:
To determine if a set of time-varying biological indicators can be used to: 1) predict the sepsis mortality risk over time and 2) generate mortality risk profiles.
Design:
Prospective observational study.
Setting:
Nine Canadian ICUs.
Subjects:
Three-hundred fifty-six septic patients.
Interventions:
None.
Measurements and Main Results:
Clinical data and plasma levels of biomarkers were collected longitudinally. We used a complementary log-log model to account for the daily mortality risk of each patient until death in ICU/hospital, discharge, or 28 days after admission. The model, which is a versatile version of the Cox model for gaining longitudinal insights, created a composite indicator (the daily hazard of dying) from the “day 1” and “change” variables of six time-varying biological indicators (cell-free DNA, protein C, platelet count, creatinine, Glasgow Coma Scale score, and lactate) and a set of contextual variables (age, presence of chronic lung disease or previous brain injury, and duration of stay), achieving a high predictive power (conventional area under the curve, 0.90; 95% CI, 0.86–0.94). Including change variables avoided misleading inferences about the effects of day 1 variables, signifying the importance of the longitudinal approach. We then generated mortality risk profiles that highlight the relative contributions among the time-varying biological indicators to overall mortality risk. The tool was validated in 28 nonseptic patients from the same ICUs who became septic later and was subject to 10-fold cross-validation, achieving similarly high area under the curve.
Conclusions:
Using a novel version of the Cox model, we created a prognostic tool for septic patients that yields not only a predicted probability of dying but also a mortality risk profile that reveals how six time-varying biological indicators differentially and longitudinally account for the patient’s overall daily mortality risk.
Sepsis, defined as life-threatening organ dysfunction caused by a dysregulated host response to infection (1), is the leading cause of mortality and critical illness worldwide (2, 3). Patients who survive sepsis often endure long-term cognitive and functional declines (4). Sepsis is the most expensive syndrome treated in the United States, accounting for $20.3 billion (5.2%) of total hospital costs in 2011 (5). Despite supportive strategies such as use of broad-spectrum antibiotics, fluid resuscitation, source control, and mechanical ventilation (6–9), the mortality rate from sepsis remains high (15–30%) (10–12).
Current clinical scoring systems for septic patients such as Acute Physiology and Chronic Health Evaluation (APACHE) II, III, IV, the Multiple Organ Dysfunction Score (MODS), and the Sequential Organ Failure Assessment (SOFA) have been shown to have prognostic utility (13–20). However, limitations of these scores include lack of longitudinal analysis (e.g., APACHE scores are based on status within 24 hr of ICU admission) and lack of insights into how individual components of the scoring systems differentially account for a patient’s overall mortality risk.
We previously showed that high plasma levels of cell-free DNA (cfDNA) and low levels of protein C predicted mortality in sepsis (15). We also demonstrated that combining cfDNA and protein C with the MODS score enhanced the prognostic power of MODS (15). Plasma cfDNA, released from activated neutrophils, aids in pathogen clearance but also exerts collateral damage by promoting blood coagulation and inhibiting fibrinolysis (21). Protein C is a natural anticoagulant that prevents blood clotting in the microcirculation. Increased consumption of protein C is a hallmark of sepsis and may be associated with disseminated intravascular coagulation and multiple organ failure (22–24).
The purpose of this study is to address the limitations of current sepsis prognosis scores by creating a mortality risk profile (MRP) for any patient that reveals the relative importance of a set of time-varying biological indicators (TVBIs) in accounting for the patient’s mortality risk that may change markedly within a few days. Six TVBIs (cfDNA, protein C, platelet count, creatinine, Glasgow Coma Scale [GCS] score, and lactate) and a set of contextual variables (age, the preconditions of chronic lung disease and previous brain injury, and duration of stay) were used. To create the MRPs, we used a complementary log-log (CLOGLOG) model, which is a versatile version of the Cox model for achieving longitudinal insights, after removing the proportional hazards assumption and replacing the maximum partial likelihood method by the maximum likelihood method for estimation.
MATERIALS AND METHODS
Patients and Selection Criteria
Three-hundred ninety-two septic patients were recruited from ICUs in nine Canadian tertiary hospitals between November 2010 and January 2013. The study was approved by the Research Ethics Boards of all participating centers. Eligible patients must have a confirmed or suspected infection, greater than or equal to 1 dysfunctional organ system, greater than or equal to 3 signs of systemic inflammatory response syndrome, and were expected to remain in the ICU for greater than or equal to 72 hours. Blood samples and clinical data were obtained daily for the first week, followed by once a week for the duration of the patients’ stay in the ICU. Details of the inclusion criteria and data collection are described in Supplemental Text 1 (Supplemental Digital Content 1, http://links.lww.com/CCX/A76).
Statistical Analyses
For each patient, we account for the “daily hazards of dying” from day 1 until the patient died in ICU/hospital, was discharged, or 28 days since ICU admission (time of censoring). Using the daily hazard of dying as the dependent variable, the formulation of the CLOGLOG model and the estimation method are presented in Supplemental Text 2 (Supplemental Digital Content 1, http://links.lww.com/CCX/A76).
The choice of the six TVBIs (cfDNA, protein C, platelet count, creatinine, GCS score, and lactate) and contextual variables (age, the preconditions of chronic lung disease and previous brain injury, and duration of stay) was based on 1) our previous pilot study (15), 2) our finding from the removal of the assumption of equal weights that three out of the six components of MODS and SOFA (platelet count, creatinine, and GCS) had a greater predictive power than did MODS as a whole, and 3) assessments of a large number of potentially useful routine clinical indicators and contextual variables.
For each TVBI, three analytical variables are defined as follows: 1) the “day 1 variable,” which assumes the day 1 value through all days; 2) the “current variable,” which assumes the changing daily values; and 3) the “change variable,” which represents the change from day 1 to any day in question. For any daily value of a current variable that is not directly observed, we substituted via imputation (Supplemental Text 2, Supplemental Digital Content 1, http://links.lww.com/CCX/A76). In the CLOGLOG model, two of these three analytical variables are used: the day 1 variable for quantifying the “initial level effect,” and the change variable for quantify the “change effect.” In an effort to enhance the model’s predictive power in a biologically meaningful way with respect to variations in TVBI values, we transformed some of these variables as outlined in Supplemental Text 3 (Supplemental Digital Content 1, http://links.lww.com/CCX/A76). For example, the day 1 variable of platelets is log-transformed because a given difference of, say, 50 × 109/L between two patients could have a greater effect on their mortality risk difference if the sicker patient had a platelet count of 60 × 109/L rather than 150 × 109/L. Since “proportional” change works better than simple change for the change variable of platelets, it is represented by a “change factor.”
With respect to the contextual variables, two dummy variables were used to represent the presence or absence of the preconditions of chronic lung disease and previous brain injury separately. Age was used without being categorized. As justified in Supplemental Text 4 (Supplemental Digital Content 1, http://links.lww.com/CCX/A76), the duration of stay and its natural log were used to quantify the temporal pattern of the hazard.
The CLOGLOG model was applied to 356 patients who did not have missing values after imputation. Together these patients contributed 6,724 observations (person-days) to the input data matrix. Relying on the assumption that explanatory variables make additive contributions to the log of hazard, we introduced a method for assessing relative predictive powers between day 1 and change variables and among the TVBIs as well as for constructing MRPs (Supplemental Text 7, Supplemental Digital Content 1, http://links.lww.com/CCX/A76).
RESULTS
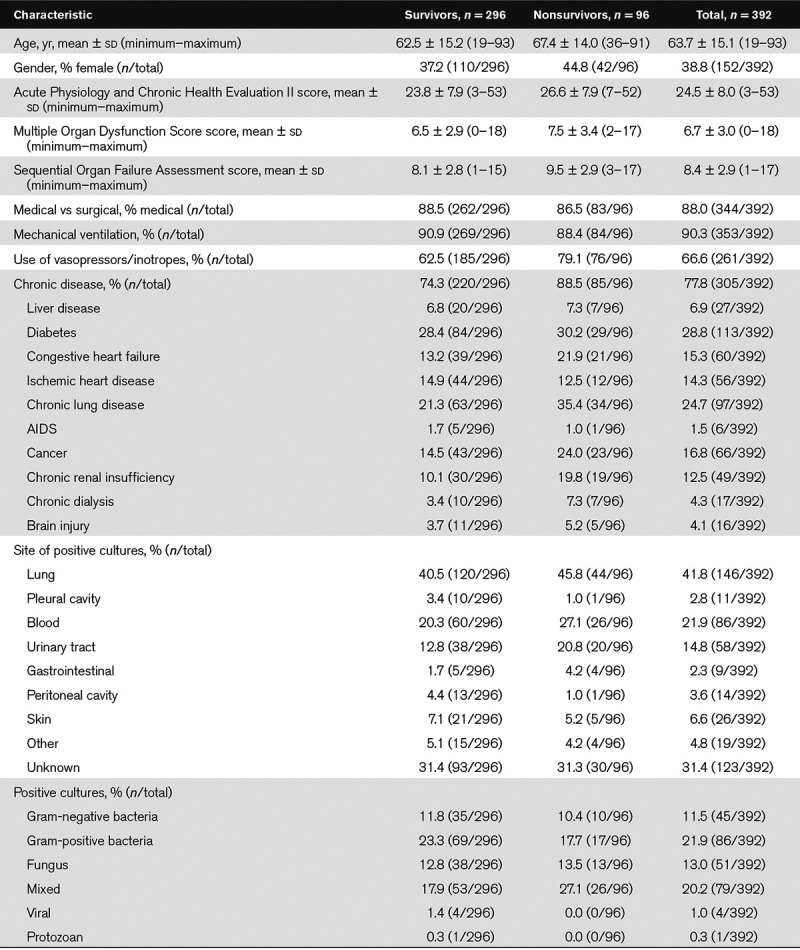
The baseline characteristics of the patients are provided in Table 1. The recruitment numbers for the nine ICUs are shown in Supplemental Table 1 (Supplemental Digital Content 1, http://links.lww.com/CCX/A76). Eighty-eight percent of the admissions were medical, 94% of the patients required mechanical ventilation, and 67% required vasopressors or inotropes. The lung was the main site of infection in the largest proportion of the patients (42%). The 28-day mortality rate was 23.5%.
TABLE 1.
Baseline Characteristics of 392 Septic Patients
Findings From Fitting the CLOGLOG Model to the Data
Table 2 shows the estimation results of the CLOGLOG model. In the best estimation result (Panel 1), the day 1 and/or change variables of three TVBIs (cfDNA, lactate, and creatinine) have positive estimated coefficients, indicating that higher values of these variables are associated with greater hazards of dying. In contrast, the estimated coefficients for the corresponding variables of protein C, platelets, and GCS are negative, indicating the opposite association with the hazard of dying. The estimated coefficients of two preconditions and age were also positive, suggesting that the presence of these preconditions as well as advanced age are associated with higher hazards of dying. Except for the day 1 variable of creatinine, the coefficients of all variables representing the six TVBIs are significantly different from 0 at the significance level of 0.05. The exception resulted from an overlap in explanatory power with other day 1 variables (Supplemental Text 6, Supplemental Digital Content 1, http://links.lww.com/CCX/A76).
TABLE 2.
Estimation Results of the Complementary Log-Log Model for the 6,724 Person-Day Records of 356 Septic Patients
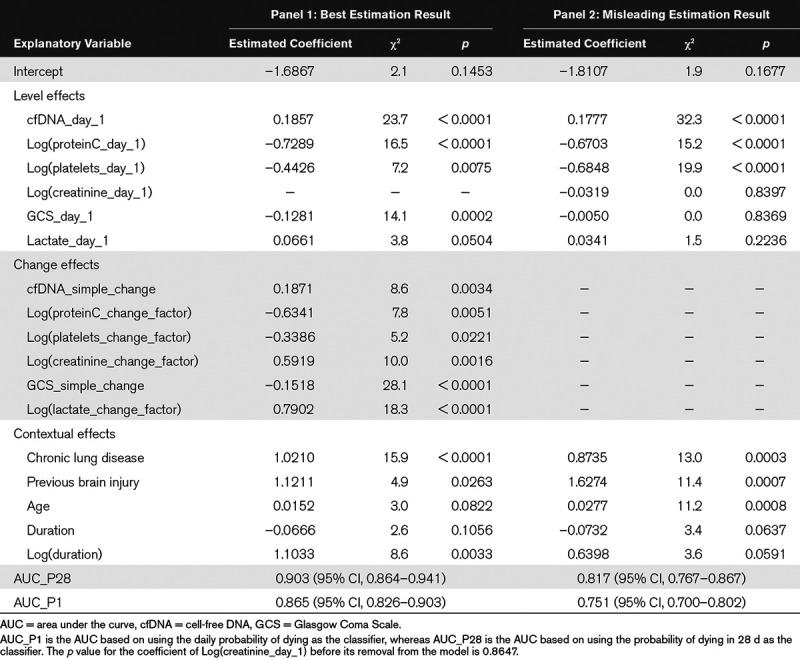
The model’s predictive power is measured by the conventional AUC_P28 (the area under the curve [AUC] from predicting a “single” mortality outcome for each patient in 28 d) and the alternative AUC_P1 (the AUC from predicting all “daily” mortality outcomes), with AUC_P1 being always less than AUC_P28 in face values (Supplemental Text 5, Supplemental Digital Content 1, http://links.lww.com/CCX/A76). Although AUC_P1 is more natural for our CLOGLOG model, AUC_28 should be used for comparison with the studies that did not make predictions on daily basis. With AUC_P28 = 0.903 [95% CI, 0.864–0.941] and AUC_P1 = 0.865 [95% CI, 0.826–0.903] our model achieved a high predictive power.
In Panel 2 of Table 2, some important longitudinal insights are revealed by removing all change variables from the model. First, AUC_P28 dropped from 0.903 (95% CI, 0.864–0.941) to 0.817 (95% CI, 0.767–0.867), implying that changes in the TVBIs within the short interval of 28 days were strongly associated with changes in mortality risks. Second, the magnitude of the coefficient of the day 1 variable of GCS decreased to almost 0 and its associated p value rose sharply from 0.0002 to 0.8369, leading to the misleading inference that GCS was not useful for predicting mortality. An explanation is that the day 1 and change variables of GCS have a strong negative correlation (r = –0.70), which resulted from the fact that a high proportion of patients with low GCS scores on day 1 selectively experienced large improvements so that their originally high mortality risks declined later. The removal of the change variable of GCS covered up this selective process and hence led to the misleading finding. Similarly, the removal of the change variable of lactate also resulted in the misleading conclusion that lactate did not have a predictive effect on mortality.
As shown in Figure 1A, the relative predictive powers between the day 1 and change variables differed markedly among the TVBIs (Supplemental Text 7, Supplemental Digital Content 1, http://links.lww.com/CCX/A76). For example, 88% of the predictive power of lactate was attributable to its change variable, whereas 91% of the predictive power of cfDNA was attributable to its day 1 variable. To gain more insights into this contrast, we examined the temporal patterns of all six TVBIs (Fig. 1B–G). For each TVBI, the septic patients were divided into four quartiles based on the values of its day 1 variable. To avoid the selection bias resulting from the death process that could misleadingly exaggerate improvements as the sickest patients in each group were successively removed, the daily records of all nonsurvivors were removed from the data before the daily averages were calculated. From the differences in predictive powers and temporal patterns, we infer that large and rapid improvements in lactate and GCS were associated with large and rapid improvements in ICU mortality. However, the levels of some TVBIs did not change much over time (e.g., cfDNA, protein C), suggesting that such TVBIs were less powerful for predicting changes in mortality risks. Further details on the temporal profiles of the TVBIs are described in Supplemental Text 8 (Supplemental Digital Content 1, http://links.lww.com/CCX/A76).
Figure 1.
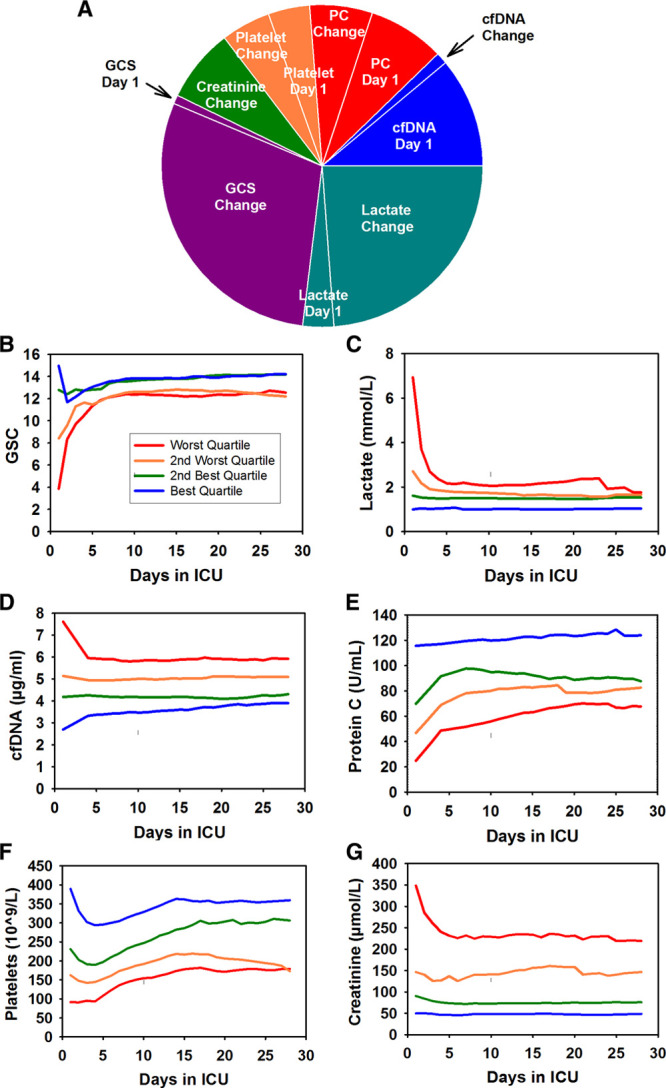
Relative predictive powers and temporal patterns of the time-varying biological indicators (TVBIs). A, The relative contributions of the day 1 and change variables of the six TVBIs to their combined predictive power in 356 septic patients (difference in the log of hazard of dying between nonsurvivors and survivors). The sizes of areas are proportional to their shares of their combined predictive power (shown in Supplemental Table 5, Supplemental Digital Content 1, http://links.lww.com/CCX/A76). B–G, Temporal patterns of the daily averages of Glasgow Coma Scale (GCS) (B), lactate (C), cell-free DNA (cfDNA) (D), protein C (PC) (E), platelet count (F), and creatinine (G). For each TVBI, the septic patients were divided into four quartile groups based on the values of its day 1 variable. Blue line (best quartile group), green line (second best quartile group), brown line (third best quartile group), and red line (worst quartile group). The normal levels in healthy individuals are as follows: 15 for GCS, 0.5 to 1.0 mmol/L for lactate, 2.2 ± 0.6 µg/mL for cfDNA, 61–133 U/mL for PC, 150 to 400 × 109/L for platelets, and less than or equal to 100 µmol/L for creatinine.
To demonstrate how a TVBI and the probability of dying of a patient could change markedly within a few days, Figure 2 shows the trajectories of (Fig. 2A) GCS and (Fig. 2B) the predicted probability of dying in 7 days (P7) for three patients: a survivor discharged on day 8, a survivor censored on day 28, and a nonsurvivor who died on day 5. The first two patients experienced large improvements in GCS and P7 within a few days and survived. In contrast, the third patient experienced worsening in GCS and P7 within a few days and died on day 5.
Figure 2.
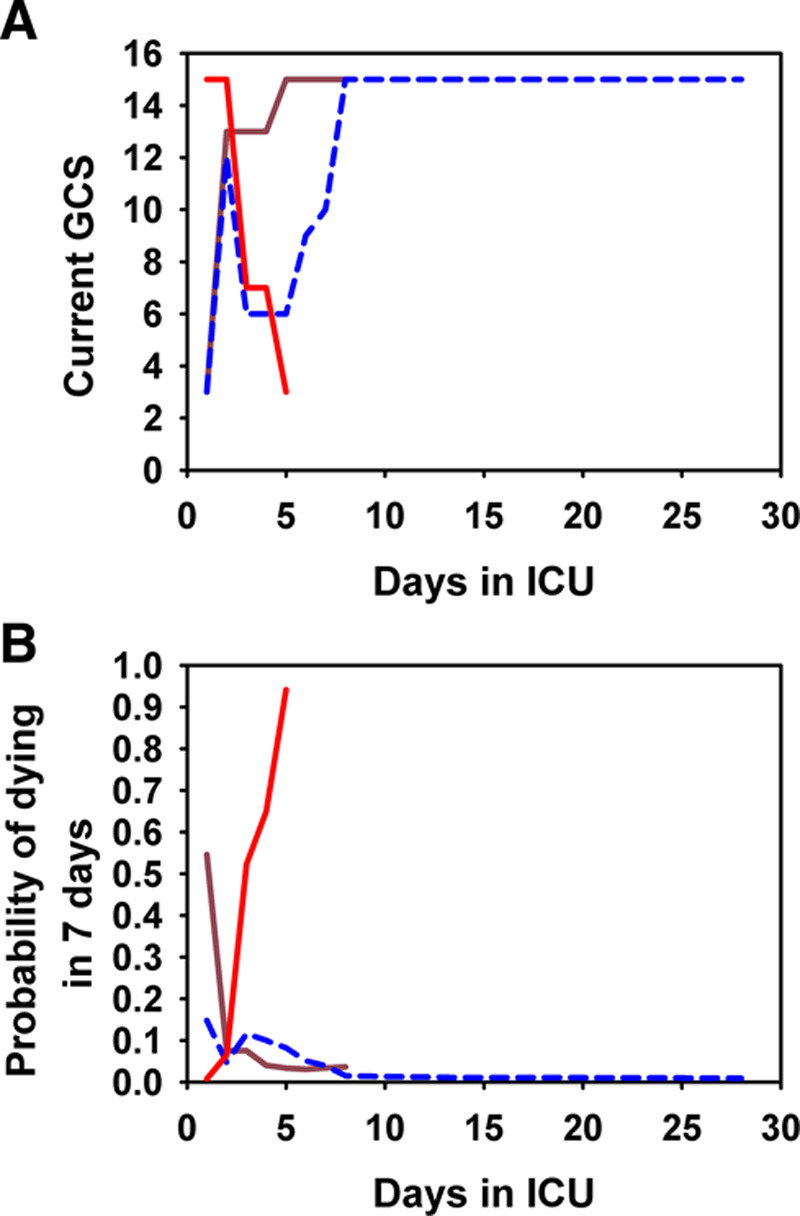
The trajectories of the Glasgow Coma Scale (GCS) levels (A) and the predicted probabilities of dying in 7 d (B) for three patients with large changes in GCS: brown line for a survivor discharged on day 8; blue line for a survivor censored on day 28; and red line for a nonsurvivor who died on day 5.
Application of the Assessment Tool to Individual Patients
In addition to generating a predicted probability of dying for each patient, our tool can generate a MRP that provides information about how different TVBIs accounted for the patient’s risk of dying on any given day, relative to a benchmark representing the best 10th percentile of survivor patients in terms of the predicted hazard of dying as of the last day.
The construction of the MRP for a 66-year-old male patient on day 28 is described in Supplemental Text 9 (Supplemental Digital Content 1, http://links.lww.com/CCX/A76) and shown in Supplemental Tables 6 and 7 (Supplemental Digital Content 1, http://links.lww.com/CCX/A76). Figure 3 shows three ways that the patient’s MRP can be visualized. In terms of his difference in log of hazard from the benchmark, top of Figure 3 shows that the day 1 variables that contributed the most to his elevated overall mortality risk were GCS, protein C, and lactate. The risks attributable to both GCS and lactate decreased markedly and the risk attributable to protein C increased modestly from day 1 to day 28. Middle shows the combined effect of the day 1 and change variables for each TVBI, revealing that persistent deficiency of protein C contributed the most to the patient’s overall mortality risk. After translating the information in Middle into the familiar measures of hazard ratios (HRs) by exponentiation, Bottom shows the HR-1 for each TVBI. Protein C had the highest HR of 2.09.
Figure 3.
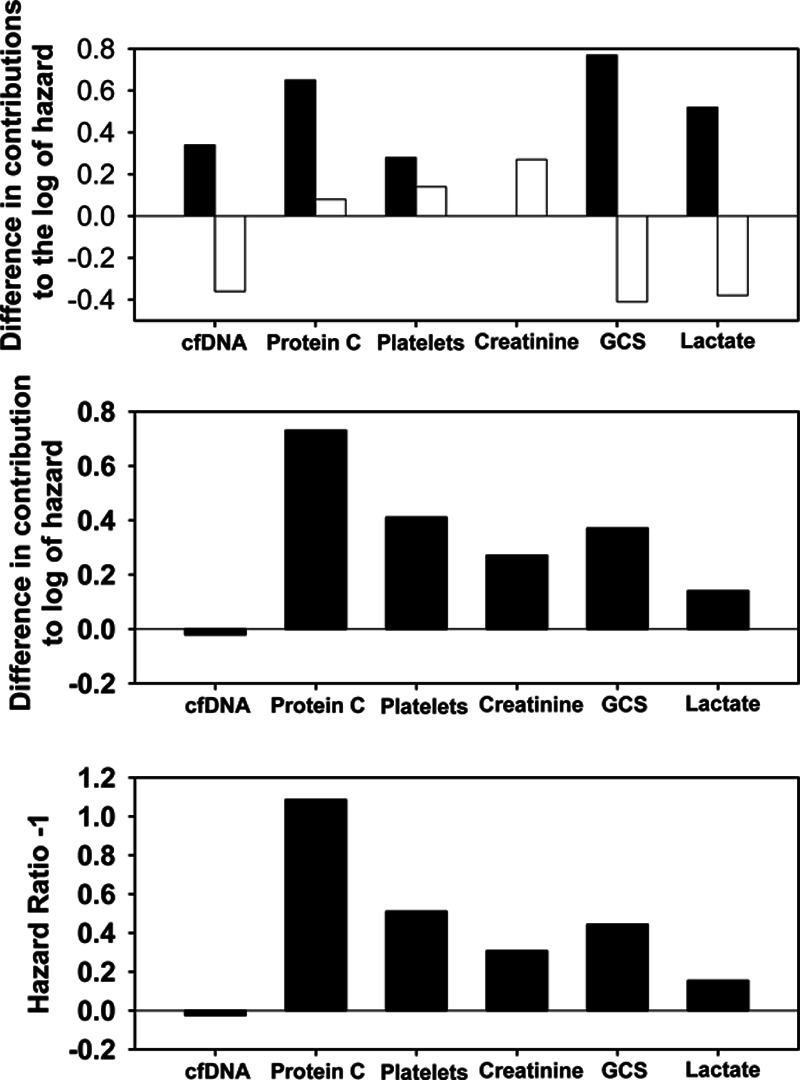
The mortality risk profile that highlights the relative contribution of each time-varying biological indicator (TVBI) to the risk of dying. The top shows the separate effects of day 1 and change variables of each TVBI for a sample patient in terms of his difference in log of hazard from the benchmark, with black bars for day 1 effects and white bars for change effects. Relative to the benchmark, the patient had a higher risk of death that is mainly attributable to unfavorable values of Glasgow Coma Scale (GCS) (contributing 0.77 to the difference), protein C (0.65), lactate (0.52), cell-free DNA (cfDNA) (0.34), and platelets (0.28) on day 1. However, the improvements in GCS, lactate, and cfDNA between day 1 and day 28 helped to reduce the difference in log of hazard markedly by –0.41 for GCS, –0.38 for lactate, and –0.36 for cfDNA, although these were offset by some worsening attributable to changes in creatinine (0.27), platelets (0.14), and protein C (0.08) relative to the benchmark. The middle shows the combined effect of the day 1 and change variables for each TVBI (i.e., the middle is the sum of the “day 1 variable” bar and the “change variable” bar in the top). Since GCS and lactate improved markedly, their combined effects (0.37 and 0.14) became much less than that of protein C (0.73). After translating the information in the middle into the familiar measures of hazard ratios (HRs) by exponentiation, the bottom shows HR-1 for each TVBI, because HR = 1 (no effect) should be represented by a bar of zero length. The three highest HRs between the patient and the benchmark were 2.09 for protein C, 1.51 for platelets, and 1.44 for GCS. The pattern suggests that abnormalities in protein C, platelets, and GCS are the major contributors to this patient’s risk of dying.
In Supplemental Text 9 (Supplemental Digital Content 1, http://links.lww.com/CCX/A76), we also demonstrate with the data of another patient how the knowledge of the dynamic nature of the benchmark is useful in assisting the use of the MRP as a reference.
Validation
For validation, we used two approaches: 1) using our model to predict the mortality outcomes of a validation group and 2) conducting a 10-fold cross-validation with the data of our derivation group (Supplemental Text 10, Supplemental Digital Content 1, http://links.lww.com/CCX/A76).
In the first approach, the validation group consists of 28 nonseptic ICU patients who later became septic in the ICU. These patients were recruited from the same ICUs and during the sample time frame as the septic patients (baseline characteristics in Supplemental Table 11, Supplemental Digital Content 1, http://links.lww.com/CCX/A76). With day 1 being defined as the day of becoming septic in the ICU, our analysis revealed that AUC_P28 = 0.886 (95% CI, 0.746–1.000) and AUC_P1 = 0.863 (95% CI, 0.748–0.979). Despite the rather wide CI as a consequence of the small sample size, the lower limit is much higher than 0.5.
In the second approach, the 10-fold cross-validation revealed that the means of the AUC_P1 were 0.865 (sd = 0.008) for the 10 training sets and 0.854 (sd = 0.073) for the 10 test sets, compared with AUC_P1 = 0.865 (95% CI, 0.826–0.903) for the derivation group of our model.
DISCUSSION
Our analysis leading to the creation of MRPs for individual patients revealed some important insights. First, there were marked changes in the TVBIs and the related mortality risks. This finding explains why tools that do not use the values of TVBIs beyond the first 24 hours tend to have low predictive powers. Second, predictive powers of the MODS and SOFA scores could be improved by replacing the assumption of equal weights for all components by the maximum likelihood method that determines the weights based on the observed data. It is not surprising that our set of six TVBIs was stronger in predictive power (AUC_P28 = 0.90) than not only APACHE II (AUC_P28 = 0.77) but also MODS (AUC_P28 = 0.80) and SOFA (AUC_P28 = 0.86), both of which were also constructed from six TVBIs (Supplemental Text 11, Supplemental Digital Content 1, http://links.lww.com/CCX/A76).
We extensively explored whether adding more TVBIs (e.g., bilirubin, Pao2/Fio2 ratio) or more contextual variables (e.g., site/type of infection) could improve our model (Supplemental Texts 12 and 13, Supplemental Digital Content 1, http://links.lww.com/CCX/A76). Together with the good performance validated by two approaches, this exploration confirmed that with our input data, we have created a robust and concise model.
As shown in Supplemental Text 14 (Supplemental Digital Content 1, http://links.lww.com/CCX/A76), our CLOGLOG model is indeed a versatile version of the Cox model that is better than its two conventional versions for achieving longitudinal insights. For users of logit and probit models, Supplemental Text 15 (Supplemental Digital Content 1, http://links.lww.com/CCX/A76) provides a concrete guide to applying our novel approach to formulating a “longitudinal logit model” or a “longitudinal probit model” for achieving similar longitudinal insights and creating MRPs.
Our findings have the following limitations: 1) the stepwise nature of our variable selection tends to inflate the predictive power; 2) the small sample size of the validation group constrains generalizability; 3) the nonrandom pattern of missing values may distort estimation results; and 4) the exclusion of patients who were expected to die within 72 hours of ICU admission resulted in some loss of valuable information and required the use of a flexible time function to prevent the resulting selection bias from distorting the estimated coefficients. Applying our novel longitudinal modeling to a larger sample, researchers are likely to find a stronger predictive model that includes more preconditions (e.g., congestive heart failure) and more TVBIs (e.g., bilirubin and Pao2/Fio2 ratio).
CONCLUSIONS
Using a novel version of the Cox model, we created a prognostic tool for septic patients that yields not only a predicted probability of dying but also an MRP that reveals how six TVBIs differentially and longitudinally account for the patient’s overall daily mortality risk. This tool is based on a CLOGLOG model that takes advantage of the changing values of cfDNA, protein C, platelet count, creatinine, GCS, and lactate to achieve a high predictive power.
ACKNOWLEDGMENTS
We thank you to all research coordinators for recruiting patients and to Drs. Gerald Lebovic and Kevin Thorpe for reviewing the methodology.
Supplementary Material
Footnotes
Drs. Liaw and Fox-Robichaud are co-first authors.
The Canadian Critical Care Translational Biology Group (CCCTBG) board members not already listed as authors are: Jamie Hutchison, Jane Batt, Emmanuel Charbonney, and Jean-Francois Cailhier. The Canadian Critical Care Trials Group (CCCTG) board members not already listed as authors are: Rob Fowler, Paul Hebert, Kusum Menon, Karen Burns, Shane English, John Drover, Bram Rochwerg, Dominique Piquette, Margaret Herridge, Sylvie Debigare, Srinivas Murthy, Michelle Kho, and Danae Tassy.
Supported, in part, by grants from the Canadian Institutes of Health Research (MOP-106503, MOP-136878).
Supplemental digital content is available for this article. Direct URL citations appear in the HTML and PDF versions of this article on the journal’s website (http://journals.lww.com/ccejournal).
Drs. Liaw, Dwivedi, and Medeiros received support for article research from the Canadian Institutes of Health Research (CIHR). Drs. Liaw and Medeiros disclosed government work. Dr. Fox-Robichaud’s institution received funding from CIHR, CIHR/Natural Sciences and Engineering Research Council of Canada, and Hamilton Academic Hospital Fund. Dr. Dodek’s institution received funding from McMaster University. Dr. Winston received grant support from the Alberta Lung Association and the Canadian Intensive Care Foundation. Dr. Lellouche received compensation for patient inclusions in the study, and he disclosed he is a co-founder, administrator, and consultant of Oxynov, R&D company. Dr. Marshall received patient recruitment fees per CIHR grant, and he received funding from Data Monitoring Committee, Asahi Kasei Pharmaceuticals and Baxter. The remaining authors have disclosed that they do not have any potential conflicts of interest.
Contributor Information
Collaborators: Jamie Hutchison, Jane Batt, Emmanuel Charbonney, Jean-Francois Cailhier, Rob Fowler, Paul Hebert, Kusum Menon, Karen Burns, Shane English, John Drover, Bram Rochwerg, Dominique Piquette, Margaret Herridge, Sylvie Debigare, Srinivas Murthy, Michelle Kho, and Danae Tassy
REFERENCES
- 1.Singer M, Deutschman CS, Seymour CW, et al. The third international consensus definitions for sepsis and septic shock (sepsis-3). JAMA 2016315801–810 [DOI] [PMC free article] [PubMed] [Google Scholar]
- 2.Vincent JL, Marshall JC, Namendys-Silva SA, et al. ; ICON investigators Assessment of the worldwide burden of critical illness: The Intensive Care Over Nations (ICON) audit. Lancet Respir Med 20142380–386 [DOI] [PubMed] [Google Scholar]
- 3.Fleischmann C, Scherag A, Adhikari NK, et al. ; International Forum of Acute Care Trialists Assessment of global incidence and mortality of hospital-treated sepsis. Current estimates and limitations. Am J Respir Crit Care Med 2016193259–272 [DOI] [PubMed] [Google Scholar]
- 4.Iwashyna TJ, Ely EW, Smith DM, et al. Long-term cognitive impairment and functional disability among survivors of severe sepsis. JAMA 20103041787–1794 [DOI] [PMC free article] [PubMed] [Google Scholar]
- 5.Torio CM, Andrews RM. National Inpatient Hospital Costs: The Most Expensive Conditions by Payer, 2011: Statistical Brief #160 2006Rockville, MD: Agency for Healthcare Research and Quality; [PubMed] [Google Scholar]
- 6.Brower RG, Matthay MA, Morris A, et al. ; Acute Respiratory Distress Syndrome Network Ventilation with lower tidal volumes as compared with traditional tidal volumes for acute lung injury and the acute respiratory distress syndrome. N Engl J Med 20003421301–1308 [DOI] [PubMed] [Google Scholar]
- 7.Rivers E, Nguyen B, Havstad S, et al. ; Early Goal-Directed Therapy Collaborative Group Early goal-directed therapy in the treatment of severe sepsis and septic shock. N Engl J Med 20013451368–1377 [DOI] [PubMed] [Google Scholar]
- 8.Kumar A, Roberts D, Wood KE, et al. Duration of hypotension before initiation of effective antimicrobial therapy is the critical determinant of survival in human septic shock. Crit Care Med 2006341589–1596 [DOI] [PubMed] [Google Scholar]
- 9.Dellinger RP, Levy MM, Rhodes A, et al. ; Surviving Sepsis Campaign Guidelines Committee including The Pediatric Subgroup Surviving Sepsis Campaign: International guidelines for management of severe sepsis and septic shock, 2012. Intensive Care Med 201339165–228 [DOI] [PMC free article] [PubMed] [Google Scholar]
- 10.Gaieski DF, Edwards JM, Kallan MJ, et al. Benchmarking the incidence and mortality of severe sepsis in the United States. Crit Care Med 2013411167–1174 [DOI] [PubMed] [Google Scholar]
- 11.Husak L, Marcuzzi A, Herring J, et al. National analysis of sepsis hospitalizations and factors contributing to sepsis in-hospital mortality in Canada. Healthc Q 201013 Spec No35–41 [DOI] [PubMed] [Google Scholar]
- 12.Kumar G, Kumar N, Taneja A, et al. ; Milwaukee Initiative in Critical Care Outcomes Research (MICCOR) Group of Investigators Nationwide trends of severe sepsis in the 21st century (2000-2007). Chest 20111401223–1231 [DOI] [PubMed] [Google Scholar]
- 13.Zimmerman JE, Kramer AA, McNair DS, et al. Acute Physiology and Chronic Health Evaluation (APACHE) IV: Hospital mortality assessment for today’s critically ill patients. Crit Care Med 2006341297–1310 [DOI] [PubMed] [Google Scholar]
- 14.Antonelli M, Moreno R, Vincent JL, et al. Application of SOFA score to trauma patients. Sequential Organ Failure Assessment. Intensive Care Med 199925389–394 [DOI] [PubMed] [Google Scholar]
- 15.Dwivedi DJ, Toltl LJ, Swystun LL, et al. ; Canadian Critical Care Translational Biology Group Prognostic utility and characterization of cell-free DNA in patients with severe sepsis. Crit Care 201216R151. [DOI] [PMC free article] [PubMed] [Google Scholar]
- 16.Qiao Q, Lu G, Li M, et al. Prediction of outcome in critically ill elderly patients using APACHE II and SOFA scores. J Int Med Res 2012401114–1121 [DOI] [PubMed] [Google Scholar]
- 17.Richards G, Levy H, Laterre PF, et al. CURB-65, PSI, and APACHE II to assess mortality risk in patients with severe sepsis and community acquired pneumonia in PROWESS. J Intensive Care Med 20112634–40 [DOI] [PubMed] [Google Scholar]
- 18.Raith EP, Udy AA, Bailey M, et al. ; Australian and New Zealand Intensive Care Society (ANZICS) Centre for Outcomes and Resource Evaluation (CORE) Prognostic accuracy of the SOFA score, SIRS criteria, and qSOFA score for in-hospital mortality among adults with suspected infection admitted to the intensive care unit. JAMA 2017317290–300 [DOI] [PubMed] [Google Scholar]
- 19.Knaus WA, Wagner DP, Draper EA, et al. The APACHE III prognostic system. Risk prediction of hospital mortality for critically ill hospitalized adults. Chest 19911001619–1636 [DOI] [PubMed] [Google Scholar]
- 20.Rivera-Fernández R, Nap R, Vázquez-Mata G, et al. Analysis of physiologic alterations in intensive care unit patients and their relationship with mortality. J Crit Care 200722120–128 [DOI] [PubMed] [Google Scholar]
- 21.Gould TJ, Lysov Z, Liaw PC. Extracellular DNA and histones: Double-edged swords in immunothrombosis. J Thromb Haemost 201513Suppl 1S82–S91 [DOI] [PubMed] [Google Scholar]
- 22.Yan SB, Helterbrand JD, Hartman DL, et al. Low levels of protein C are associated with poor outcome in severe sepsis. Chest 2001120915–922 [DOI] [PubMed] [Google Scholar]
- 23.Macias WL, Nelson DR. Severe protein C deficiency predicts early death in severe sepsis. Crit Care Med 200432S223–S228 [DOI] [PubMed] [Google Scholar]
- 24.Shorr AF, Bernard GR, Dhainaut JF, et al. Protein C concentrations in severe sepsis: An early directional change in plasma levels predicts outcome. Crit Care 200610R92. [DOI] [PMC free article] [PubMed] [Google Scholar]
Associated Data
This section collects any data citations, data availability statements, or supplementary materials included in this article.


