Abstract
Background
Poor air quality has previously been associated with lung cancer development, but the risks associated with regional differences in air quality are poorly understood. We investigated the association of air quality indices with development of lung cancer in all Texas counties.
Methods
Lung cancer incidence, air quality indicators (particulate matter less than 2.5 micrometers [PM2.5], radon levels, oil well density) and known risk factors were obtained using data from the Texas Commission on Environmental Quality and the Texas Cancer Registry. Linear regression models were constructed to correlate air quality indicators with lung cancer incidence and advanced stage at diagnosis (stage III or IV), while controlling for other patient characteristics.
Results
Lung cancer incidence ranged from 27.6 to 103.4 cases per 100,000 people. PM2.5 was associated with increased lung cancer incidence (β = 4.38, p < 0.0001), but not radon levels (β = −2.70, p=0.41). Air quality indicators were not significantly associated with an advanced cancer diagnosis.
Conclusion
There are wide differences in the incidence of lung cancer across Texas. These differences appear to be related to air quality. Identifying high-risk areas may help to guide strategies such as implementation of targeted lung cancer screening programs.
Keywords: Lung cancer incidence, Air quality, Epidemiology
Introduction
Lung cancer is the most lethal cancer worldwide, accounting for more than 150,000 deaths annually. 1 Nearly 7% of the population will be diagnosed with lung cancer at some point in their life.2 While smoking is the most significant risk factor for lung cancer, other important causes such as radon, asbestos and some inhaled chemicals are also important causes of lung cancer.
Though there is literature supporting the association of air pollution with lung cancer, the majority of studies have focused on each individual’s exposure using surveys, questionnaires, and ambient monitors in metropolitan areas.3–5 As such, our understanding of air pollution effects have been primarily derived from urban environments. 6–9 Prior data have also revealed higher exposure levels of particulate matter 2.5 microns (PM2.5), a commonly used measure of air pollution, in the southeastern region of the United States10.
In a state with relatively heterogeneous environment exposures, a population-based investigation of air quality differences could allow for a better understanding of the environmental factors which are associated with lung cancer and more efficient implementation of population-based screening or treatment programs. There are few available studies which have performed population-based risk assessments using a county by county analysis.7, 10, 11 Our goal was to perform an analysis of the correlation between air quality indices and lung cancer development in all Texas counties.
Methods
Demographic data
Institutional review board approval was obtained from the University of Texas Medical Branch Review Committee. For each county in Texas (n = 254), the most recent United States Census Bureau data and the 2018 County Health Rankings database were used to collect sociodemographic data including county population, mean age, smoking rate, ethnicity percentages and rural status. According to the Census Bureau, a county with under 50,000 people was considered to be rural.
Environmental data
The Railroad Commission of Texas, Environmental Protection Agency (EPA), Texas Commission on Environmental Quality and the Texas Radon Program were used to collect the following environmental quality indicators: PM2.5 level, number of oil wells per person in each county and radon levels. PM2.5 levels were taken as an average level in each county from January 1, 1998 when levels were first recorded to December 31st, 2017. To designate radon exposure, the EPA categorized each county into zone 1 (> 4.0 pCi/L), zone 2 (2.0—4.0 pCi/L) or zone 3(< 2.0 pCi/L). No county in Texas was designated as zone 1.
Cancer data
For each county, the Texas Cancer Registry (TCR) was used to collect the lung cancer incidence per 100,000 people and the stage at diagnosis. Stage at diagnosis was categorized as early (Stage I and II) and advanced (Stage III and IV).
Statistical Analysis
We analyzed the relative risk of both the incidence and stage at diagnosis for lung cancer in each county using linear regression models. As our focus was on air quality indices, linear regression models were constructed to determine the association of air quality indicators with lung cancer incidence and stage at diagnosis while controlling for county-level sociodemographic characteristics and smoking rates. All statistical analyses were performed using SPSS Statistics for Windows, version 25 (IBM Corp., Armonk, N.Y., USA).
Results
Demographics
All counties in Texas (n=254) were analyzed (Table 1). The mean smoking rate in Texas was 14%. Sixty-eight percent (172/254) of counties were rural.
Table 1—
State and county demographics
| N | 254 |
|---|---|
| Population (total) | 29,366,479 |
| Ethnicity | |
| Caucasian | 42.6% |
| Hispanic | 39.1% |
| African American | 11.8% |
| Asian | 4.8% |
| Other | 1.7% |
| County smoking rate (mean) | 14% (11—20) |
| Rural county status | 68% (172/254) |
Air quality
Table 2 shows air quality data for each county. Eighty-five percent of counties had radon levels in zone 3 (215/254). There was significant variation in the PM2.5 levels in each county, ranging from 5.8 to 12.0 micrograms/meter3 (μg/m3).
Table 2—
Air quality indices
| N | 254 |
|---|---|
| Radon | |
| Zone 1 | 0 |
| Zone 2 | 15% (39/254) |
| Zone 3 | 85% (215/254) |
| PM2.5 (mean) | 8.21 micrograms/meter3 (5.8—12.0) |
| Oil wells per county (mean) | 1,168 (0—16,917) |
Lung Cancer Data
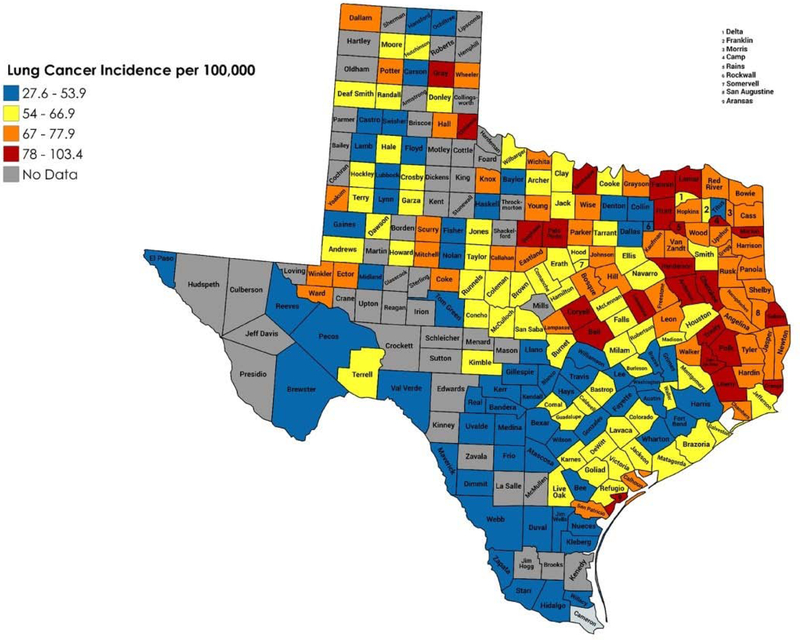
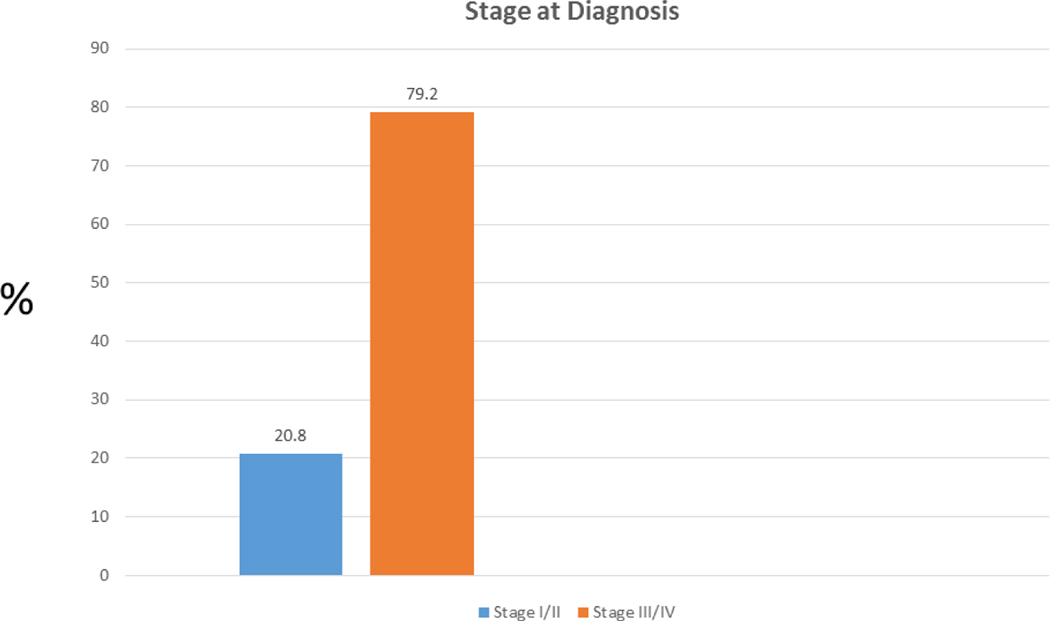
Lung cancer incidence varied widely across counties, ranging from 27.6 to 103.4 cases per 100,000 people (Figure 1). Many of the counties with the highest rates of lung cancer appeared to cluster in east Texas. Overall, 79.2% of all lung cancer cases were diagnosed at an advanced stage (Figure 2).
Figure 1—
Incidence of lung cancer in Texas counties
Figure 2—
Stage at diagnosis of lung cancer in Texas
Univariate analysis
Across all counties, the incidence of lung cancer was directly associated with the county smoking rate (p <0.01), county minority percentage (p < 0.01) and county PM2.5 level (p < 0.01). Rural counties tended to have an increased rate of advanced stage at diagnosis (p = 0.04). County radon levels were not associated with lung cancer incidence (p = 0.40) or stage at diagnosis (p = 0.20).
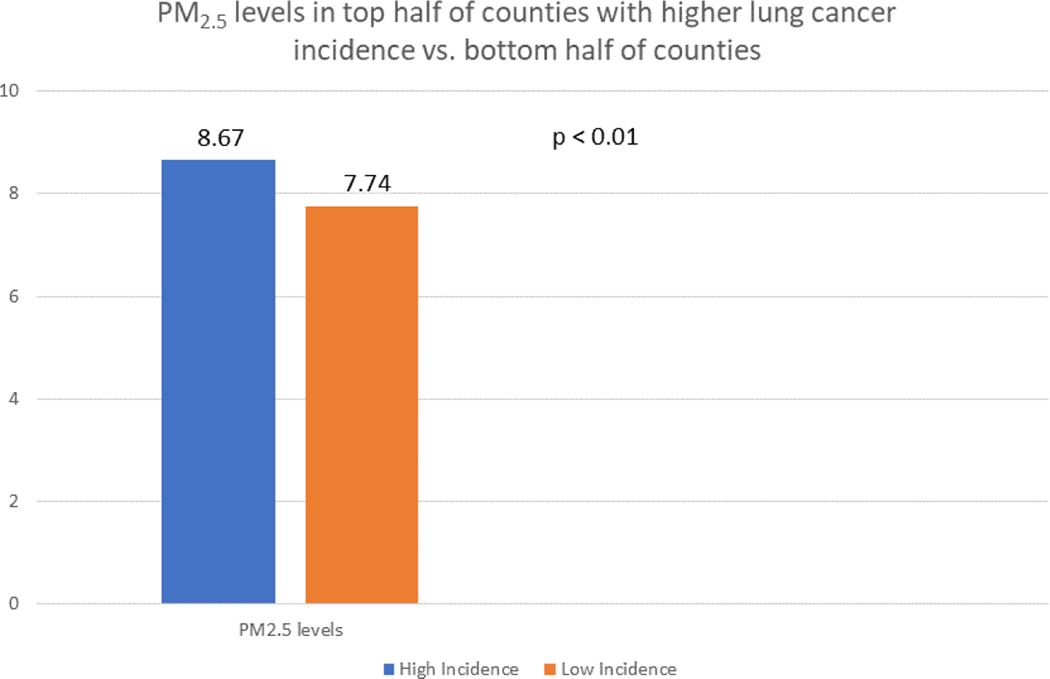
We further analyzed the association of PM2.5 levels with lung cancer incidence by dividing all Texas counties into two halves based on lung cancer incidence. Each group had 127 counties. The average PM2.5 level in the group with the higher lung cancer rate was significantly different than the group with the lower lung cancer incidence rate (8.67 vs. 7.74, p < 0.01) and is shown in Figure 3.
Figure 3—
Average PM2.5 levels in the 127 counties with higher lung cancer incidence compared to the 127 counties with lower lung cancer incidence
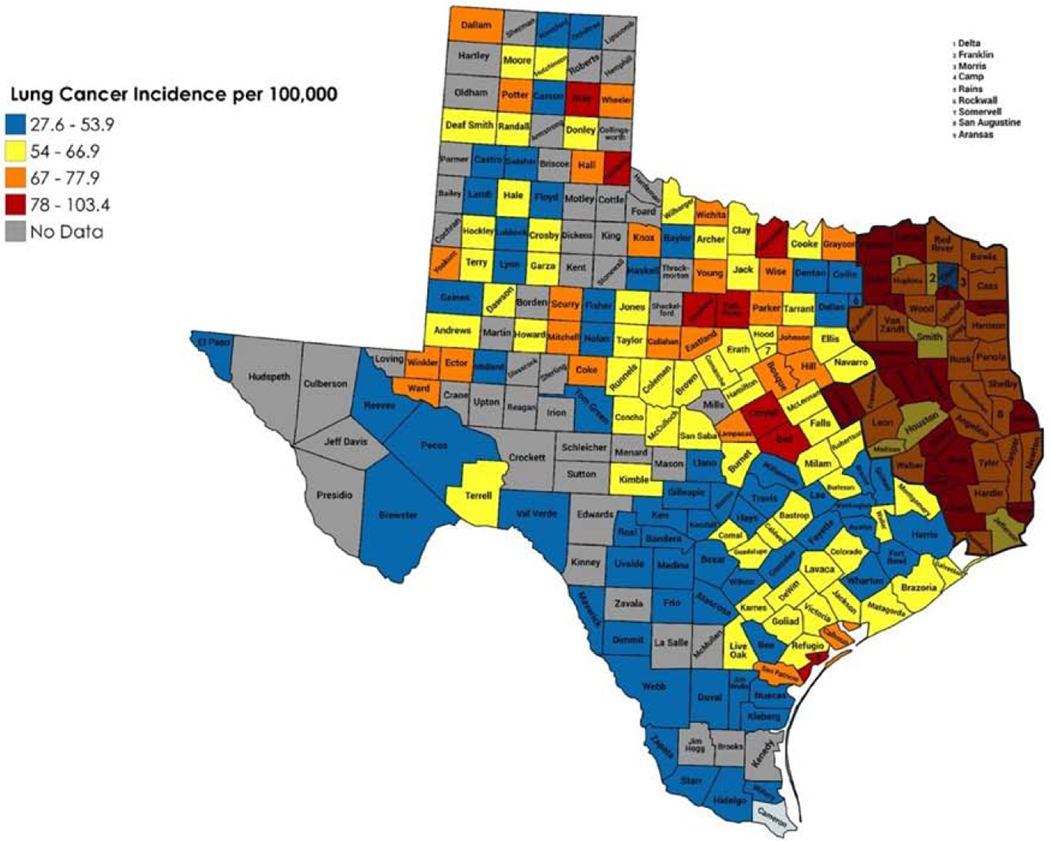
We also analyzed the smoking rate in east Texas (Figure 4) compared to the rest of the state. The rate of smoking in east Texas was significantly higher than the rest of the state (16.9% vs. 13.7%, p < 0.01).
Figure 4—
High incidence of lung cancer in East Texas
Logistic regression of air quality indices
When using linear regression analysis to control for the smoking rate and minority percentage, the county PM2.5 level remained as a statistically significant factor associated with the incidence of lung cancer (p < 0.01). No other variables were significantly associated with either lung cancer incidence or stage at diagnosis.
Discussion
Lung cancer remains a public health concern nationwide, and the majority of patients who are eligible for screening computed tomography scans do not receive them.12 Previous efforts to reduce lung cancer incidence have used plans targeting high-risk individuals, such as smoking cessation counseling and lung screening programs.13 But there have not been widespread attempts to identify and target high-risk areas. Given the relative lack of success in getting eligible patients screened, it may be appropriate to focus efforts to decrease lung cancer mortality to individuals in these high-risk areas first.
We felt that this analysis in a state like Texas would be useful because this state is very heterogenous in many aspects. Many of the 254 counties in Texas have different ethnic, socioeconomic and air quality compositions. We expected to find different rates of lung cancer development among the counties, but we did not expect that some counties would have an almost 4-fold higher rate than other counties. And we certainly did not expect there to be such a strong cluster of counties in east Texas. We feel that this finding is important, because we can now conduct a more detailed analysis to find what factors other than air quality are associated with lung cancer incidence. It appears that the level of air pollution, as represented by PM2.5, does correlate considerably with lung cancer incidence. But there are likely other factors which we did not measure which contribute to the high rate in east Texas. And given that the smoking rate is higher in this part of the state, it appears that both smoking and worse air quality contribute to a higher incidence of lung cancer. Our future studies will look at other environmental exposures, such as the number and distribution of factories, and more detailed demographic data to see what other factors correlate with lung cancer incidence in a population analysis.
Previous literature has demonstrated small particulate matter to be a human health hazard. The International Agency for Research on Cancer (IARC) categorized outdoor pollutants as class I carcinogens.14 More specifically, increased exposure to high PM 2.5 levels has been associated with an increased rate of morbidity and mortality from several cardiovascular diseases. 15 And reductions in PM 2.5 levels have been reported to result in a significant longer life expectancy.7 In 2012 the EPA enacted rigorous National Ambient Air Quality Standards for PM 2.5 by reducing the standard level from 15 μg/m3 to12 μg/m3 in communities.16, 17 Our results coincide with the previous literature showing PM2.5 levels to be associated with worse overall health. Improving air quality in areas with worse pollution should result in a decrease in the incidence of several disease processes, including lung cancer. Some of these efforts to improve air quality may be aided by examining the factors in low air-quality areas which may negatively impact air quality. A truly comprehensive approach to reducing lung cancer incidence should focus on both improving air quality and reducing smoking rates.
While we chose to focus on the relationship of air quality to lung cancer development, it is clear that many other factors contribute to the wide differences in lung cancer incidence in different parts of the state. Previous literature has shown that people in rural areas tend to have a higher rate of lung cancer when compared to their urban counterparts.18 A complete analysis would need to investigate other disparities in rural areas, such as income level, amount of smoking exposure, access to health care and smoking cessation counseling, medically uninsured rate and many other factors. 19–22 But we feel that our study is important in that it shows that there are geographic high-risk regions for lung cancer development. Using this information to determine how to allocate funds for public health initiatives will help to make those initiatives more effective. Additionally, a lack of public policy in rural communities focused on tobacco control have led several authors to conclude that individuals residing in rural areas should be considered a vulnerable population.23–25
Our study can serve as a model for other centers to use to identify high-risk areas for lung cancer development in their states. While our study shows a correlation between air quality and lung cancer incidence, there are limitations. We used county-level data but would have preferred to analyze lung cancer incidence in different zip codes. We did not have this zip code data available on a state-wide level, however. Secondly, we analyzed the available air quality indices which we had but would have favored more granular data. The radon levels, for instance, were reported in only 3 very broad categories. The reporting of more fine-tuned radon levels would be useful and should be considered in the future by government agencies. Despite these limitations, we do feel that our analysis will be helpful in determining how to target high-risk areas with increased rates of lung cancer development.
Conclusion
Air quality is associated with lung cancer development. Specifically, elevated PM 2.5 levels are associated with an increased incidence of lung cancer. This information may help to target high-risk areas with surveillance and treatment strategies to lessen the morbidity and mortality from lung cancer. Future studies should investigate other factors which may lead to such wide differences in lung cancer development in different areas. And efforts should be undertaken to improve air quality, which will likely reduce the incidence and morbidity from several disease processes including lung cancer.
Acknowledgments
Funding/Support: Dr. Hughes is supported by the National Institute of Diabetes And Digestive And Kidney Diseases of the National Institutes of Health under Award Number T32DK007639. The content is solely the responsibility of the authors and does not necessarily represent the official views of the National Institutes of Health.
Meeting: 14th Annual Academic Surgical Congress: Houston, TX; February 5–9, 2019.
Footnotes
COI/Disclosures: None.
Publisher's Disclaimer: This is a PDF file of an unedited manuscript that has been accepted for publication. As a service to our customers we are providing this early version of the manuscript. The manuscript will undergo copyediting, typesetting, and review of the resulting proof before it is published in its final form. Please note that during the production process errors may be discovered which could affect the content, and all legal disclaimers that apply to the journal pertain.
References
- 1.Mulshine JL, D’Amico TA. Issues with implementing a high-quality lung cancer screening program. CA Cancer J Clin 2014; 64(5):352–63. [DOI] [PubMed] [Google Scholar]
- 2.Humphrey LL, Deffebach M, Pappas M, et al. Screening for lung cancer with low-dose computed tomography: a systematic review to update the US Preventive services task force recommendation. Ann Intern Med 2013; 159(6):411–420. [DOI] [PubMed] [Google Scholar]
- 3.Beelen R, Hoek G, van den Brandt PA, et al. Long-term exposure to traffic-related air pollution and lung cancer risk. Epidemiology 2008; 19(5):702–10. [DOI] [PubMed] [Google Scholar]
- 4.Dockery DW, Pope CA 3rd, Xu X, et al. An association between air pollution and mortality in six U.S. cities. N Engl J Med 1993; 329(24):1753–9. [DOI] [PubMed] [Google Scholar]
- 5.McDonnell WF, Nishino-Ishikawa N, Petersen FF, et al. Relationships of mortality with the fine and coarse fractions of long-term ambient PM10 concentrations in nonsmokers. J Expo Anal Environ Epidemiol 2000; 10(5):427–36. [DOI] [PubMed] [Google Scholar]
- 6.Lepeule J, Laden F, Dockery D, et al. Chronic exposure to fine particles and mortality: an extended follow-up of the Harvard Six Cities study from 1974 to 2009. Environ Health Perspect 2012; 120(7):965–70. [DOI] [PMC free article] [PubMed] [Google Scholar]
- 7.Pope CA 3rd, Ezzati M, Dockery DW. Fine-particulate air pollution and life expectancy in the United States. N Engl J Med 2009; 360(4):376–86. [DOI] [PMC free article] [PubMed] [Google Scholar]
- 8.Jerrett M, Burnett RT, Ma R, et al. Spatial analysis of air pollution and mortality in Los Angeles . Epidemiology 2005; 16(6):727–36. [DOI] [PubMed] [Google Scholar]
- 9.Krewski D, Jerrett M, Burnett RT, et al. Extended follow-up and spatial analysis of the American Cancer Society study linking particulate air pollution and mortality. Res Rep Health Eff Inst 2009(140):5–114; discussion 115–36. [PubMed] [Google Scholar]
- 10.Kioumourtzoglou MA, Schwartz J, James P, et al. PM2.5 and Mortality in 207 US Cities: Modification by Temperature and City Characteristics. Epidemiology 2016; 27(2):221–7. [DOI] [PMC free article] [PubMed] [Google Scholar]
- 11.Carvour ML, Hughes AE, Fann N, et al. Estimating the Health and Economic Impacts of Changes in Local Air Quality. Am J Public Health 2018; 108(S2):S151–s157. [DOI] [PMC free article] [PubMed] [Google Scholar]
- 12.Charkhchi P, Kolenic GE, Carlos RC. Access to Lung Cancer Screening Services: Preliminary Analysis of Geographic Service Distribution Using the ACR Lung Cancer Screening Registry. J Am Coll Radiol 2017; 14(11):1388–1395. [DOI] [PMC free article] [PubMed] [Google Scholar]
- 13.Okereke IC, Bates MF, Jankowich MD, et al. Effects of Implementation of Lung Cancer Screening at One Veterans Affairs Medical Center. Chest 2016; 150(5):1023–1029. [DOI] [PubMed] [Google Scholar]
- 14.Loomis D, Grosse Y, Lauby-Secretan B, et al. The carcinogenicity of outdoor air pollution. Lancet Oncol 2013; 14(13):1262–3. [DOI] [PubMed] [Google Scholar]
- 15.Di Q, Dai L, Wang Y, et al. Association of Short-term Exposure to Air Pollution With Mortality in Older Adults. Jama 2017; 318(24):2446–2456. [DOI] [PMC free article] [PubMed] [Google Scholar]
- 16.(U.S. USE, Agency) EP. 40 CFR Part 50. National Ambient Air Quality Standards for particulate matter. Final rule. . Vol. 62 Fed Reg., 1997. pp. 38652–38460. [Google Scholar]
- 17.(U.S. USE, Agency) EP. 40 CFR Part 50, 51, 52, 53, 58. National Ambient Air Quality Standards for particulate matter. Final rule. . Vol. 78 Fed Reg., 2013. pp. 3086–3287. [Google Scholar]
- 18.Singh GK, Williams SD, Siahpush M, et al. Socioeconomic, Rural-Urban, and Racial Inequalities in US Cancer Mortality: Part I-All Cancers and Lung Cancer and Part II-Colorectal, Prostate, Breast, and Cervical Cancers. J Cancer Epidemiol 2011; 2011:107497. [DOI] [PMC free article] [PubMed] [Google Scholar]
- 19.Meit M KA, Gilbert T, Tzy-Chyi Yu A, Tanenbaum E, Ormson E, TenBroeck S, Bayne A, Popat S, NORC Walsh Center for Rural Health Analysis. The 2014 Update of the Rural-Urban Chartbook 2014. Available at: https://ruralhealth.und.edu/projects/health-reform-policy-research-center/pdf/2014-rural-urban-chartbook-update.pdf. Accessed January 12, 2019.
- 20.Vander Weg MW, Cunningham CL, Howren MB, et al. Tobacco use and exposure in rural areas: Findings from the Behavioral Risk Factor Surveillance System. Addict Behav 2011; 36(3):231–6. [DOI] [PubMed] [Google Scholar]
- 21.Northridge ME, Vallone D, Xiao H, et al. The importance of location for tobacco cessation: rural-urban disparities in quit success in underserved West Virginia Counties. J Rural Health 2008; 24(2):106–15. [DOI] [PubMed] [Google Scholar]
- 22.Hodge FS, Fredericks L, Kipnis P. Patient and smoking patterns in northern California American Indian Clinics. Urban and rural contrasts. Cancer 1996; 78(7 Suppl):1623–8. [PubMed] [Google Scholar]
- 23.York NL, Rayens MK, Zhang M, et al. Strength of tobacco control in rural communities. J Rural Health 2010; 26(2):120–8. [DOI] [PMC free article] [PubMed] [Google Scholar]
- 24.Wewers ME, Shoben A, Conroy S, et al. Effectiveness of Two Community Health Worker Models of Tobacco Dependence Treatment Among Community Residents of Ohio Appalachia. Nicotine Tob Res 2017; 19(12):1499–1507. [DOI] [PMC free article] [PubMed] [Google Scholar]
- 25.Doogan NJ, Roberts ME, Wewers ME, et al. A growing geographic disparity: Rural and urban cigarette smoking trends in the United States. Prev Med 2017; 104:79–85. [DOI] [PMC free article] [PubMed] [Google Scholar]


