

Abstract
Precise localization of post-translational modifications (PTMs) on proteins and peptides is an outstanding challenge in proteomics. While electron transfer dissociation (ETD) has dramatically advanced PTM analyses, mixtures of localization variants that commonly coexist in cells often require prior separation. Although differential or field asymmetric waveform ion mobility spectrometry (FAIMS) achieves broad variant resolution, the need for standards to identify the features has limited the utility of approach. Here we demonstrate full a priori characterization of variant mixtures by high-resolution FAIMS coupled to ETD and the procedures to systematically extract the FAIMS spectra for all variants from such data.
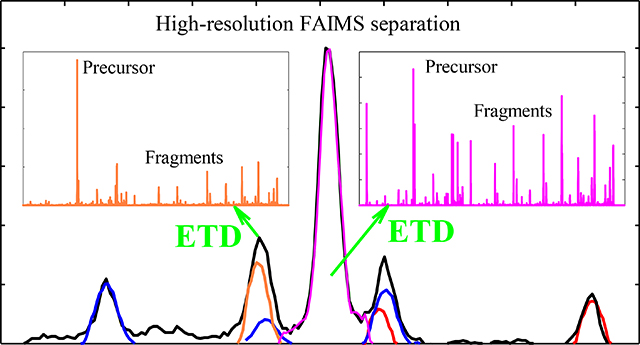
Graphical Abstract
Introduction
Many proteins incorporate post-translational modifications (PTMs) that govern crucial biological functions [1,2]. For example, the phosphorylation pattern of human τ protein is thought to control the aggregation of paired helical filaments in Alzheimer’s disease by influencing the cis/trans ratio of prolyl bonds adjacent to T231 and S235 and thereby the protein conformation[3]. Phosphorylated sites also have distinct regulatory functions for non-amyloid proteins, such as ERK and CDK family members and adapter proteins like SRC and Fak[4]. The same PTMs often attach in different locations on the backbone, creating “localization variants” that coexist in vivo and have different and even opposite biological activities [5–8]. For instance, demethylation of H3 histone is associated with transcription activation when on the K4 residue but with heterochromatin and repression when on the closest lysine (K9) [6].
As the technologies for identifying and quantifying primary protein sequences mature, the proteomics frontier is moving to the characterization of PTMs and their roles in disease states [1,2,9]. That advance is hindered by the open-ended diversity of PTMs (with hundreds discovered to date) and sub-stoichiometric modification[9]. Many PTMs are labile, including perhaps the most biologically consequential - the phosphorylation considered here[2,5,7,8,10]. Ergodic methods such as collision-induced dissociation (CID) usually eject them from the peptide and/or shift them to another residue before severing the backbone, obliterating or falsifying the attachment site information [2,10]. Thus comprehensive tandem mass spectrometry (MS/MS) analysis of PTMs requires a direct fragmentation mechanism, such as the electron capture dissociation or electron transfer dissociation (ETD) that cut the peptide backbone at every residue without abstracting PTMs [2,5,11,12]. However, MS/MS methods are fundamentally unable to distinguish some variants in a mixture of three or more due to the absence of unique product masses [10]. This can in theory be overcome by subsequent fragmentations, but (unlike with CID in MSn protocols) successive ETD application is impractical in view of (i) charge reduction in the 1st step, which produces few or no multiply-charged ions that could be precursors for the 2nd step, and (ii) low ETD yield into each fragment (normally ~0.1 – 1% because of limited ETD efficiency and non-specific dissociation along ~10 – 100 channels).
Hence peptide variants generally need to be separated prior to the MS/MS step. While proteolytic digests are routinely fractionated by liquid chromatography (LC) prior to MS/MS, it often fails to resolve the localization variants, especially those with nearby alternatively occupied sites that also produce the most similar fragmentation patterns [7,13].
A growing substitute to LC is ion mobility spectrometry (IMS), where ionized compounds are driven through gas by electric field and fractionated depending on the transport properties [14]. The original approach of linear (drift tube) IMS is based on the absolute ion mobility (K) at moderate fields and achieves a resolving power (R) up to ~150 [15]. With a respectable R ~ 80, this technique can partly separate the phosphopeptide and unmodified peptide domains and resolve some variants[16–18]. Unfortunately, those could not be assigned using ETD: the extended times needed for a suitable yield of reaction between the ions and ETD reagent (commonly ~100 – 300 ms) greatly exceed the temporal peak width of ion packets upon IMS separation (typically ~0.5 ms) and thus implementing ETD on the fly after IMS would obliterate the established resolution. Whereas the IMS resolving power can be increased somewhat to pull apart the variants better, that would counteract matching the IMS peak width and the ETD timescale.
A newer approach of differential or Field Asymmetric waveform IMS (FAIMS) leverages the nonlinear ion motion in fields of high intensity (E) to sort ions by the mean derivative of K(E) function over a certain range[19,20]. That quantity is elicited employing an asymmetric waveform of some amplitude (dispersion voltage, DV) set up across a gap between two electrodes, through which ions are carried by the gas flow. Ions injected into the gap are pushed to either electrode, but a given species can be balanced (and thus pass and be detected) by superposing a particular fixed compensation voltage (CV) on the waveform. Scanning CV, commonly expressed as the compensation field (EC) to normalize for the gap width, reveals the spectrum of species present. As the K(E) derivative is correlated to ion mass substantially weaker than the mobility itself, FAIMS is much more orthogonal to MS than linear IMS [21–23]. The gain depends on the analyte nature and is about fourfold for peptides [24]. Hence FAIMS tends to resolve isomers finer than linear IMS with equal R metric.
The resolution in FAIMS strongly depends on the gap shape, maximizing in planar gaps where homogeneous electric field allows equilibrating only one species at a time [25]. It is also sensitive to the gas composition. The He/N2 buffers generally work well because of higher ion mobilities in lighter gases and prominent non-Blanc effect in mixtures of molecules with disparate masses [20,26]. The optimized buffers and high-fidelity waveform generators have recently raised the attainable R for multiply-charged peptides up to ~500 [27]. That performance has allowed fully separating all variants tried so far for sequences up to ~3 kDa, including those with smaller PTMs such as acetylation and methylation [28,29]. Those experiments utilized an ion trap MS system without ETD capability, and the spectral annotation relied on pure standards. With real protein digests, synthesizing those for all potentially relevant variants is often prohibitive.
Rather, one wishes to identify the features disentangled by FAIMS via ETD. That has been shown and utilized in proteomic analyses, but the commercial cylindrical-gap FAIMS device provided only marginal variant separation [12, 30–32]. Here we describe a new platform integrating high-definition FAIMS with ETD and deploy it to resolve a mixture of PTM localization variants baseline with a priori assignment for all.
Experimental Methods
Our FAIMS/MS platform is an upgrade on the earlier instrument [27]. The custom planar FAIMS unit remains as reported, with the gap width of 1.88 mm and length of ~50 mm. The bisinusoidal waveform with the 2:1 harmonics ratio and DV = 4 kV is delivered by a novel high-definition generator (Heartland Mobility, Wichita, KS) protected from arc discharge to permit operation near the breakdown threshold without risking equipment damage. The electrospray (ESI) emitter is biased at ~3 kV above the curtain plate of FAIMS inlet.
That system is mounted on a Thermo LTQ XL ion trap with ETD capability, enabling ETD of species filtered by FAIMS. A major present challenge for high-resolution FAIMS/ETD analyses is low sensitivity due to poor ion utilization in both stages. We have ameliorated that problem by effective FAIMS/MS coupling via an electrodynamic ion funnel interface preceded by a slit aperture that maximizes the overlap with ion beams exiting the FAIMS gap [25].
For the ETD stage, the temperatures were 160 oC at the source, transfer line, and restrictor, and 110 oC at the reagent (fluoranthene) vial. The pressure of chemical ionization gas (He) was delivered to the mass spectrometer at 10 PSI. Under those conditions, the reagent ion signal was ~106. During ETD, we scanned CV at the rate of 0.5 V/min to acquire the EC spectra or kept it constant to obtain the fragmentation pattern for a given feature. Most ETD spectra were obtained with the 120 – 140 ms reaction time followed by supplemental collisional activation at the potential of 25 V, which has balanced the sensitivity with coverage. All fragments were singly charged.
The N2 and He/N2 buffers were formulated from UHP components by digital flow meters (MKS Instruments) controlled from a PC, purified by an Agilent filter (RMSHY-4), and delivered at the “standard” rate of 2 L/min. This pilot study targets the τ 226 – 240 segment (VAVVRT231PPKS235PS237S238AK) monophosphorylated on T231 (1), S235 (2), S237 (3), or S238 (4) with the monoisotopic mass of m = 1602.9 Da previously separated by FAIMS [28]. Their equimolar mixtures (~5 μM each) were dissolved in 50:49:1 water/methanol/acetic acid and infused to the emitter at ~0.5 uL/min. This peptide set was chosen for the inordinate difficulty for differentiation by MS/MS ensuing from the two prolines between T231 and S235, one proline between S235 and S237, and adjacent S237 and S238 residues. As the C-terminal side of proline is protected from cleavage, the fragments of 1 and 2 differ by just two pairs, and those of 2 and 3 or 3 and 4 by one pair only.
Results and Discussion
These peptides turn into protonated ions with the charge states (z) of 2 (m/z = 802.5) and 3 (m/z = 535.3), but both FAIMS separation and ETD tend to work much better for z = 3 [28]. Possible c- and z- fragments for all four variants (with either z = 2 or 3) needed to extract the EC spectra were cataloged using the Protein Prospector software and compared to identify the unique m/z values (Table 1) [33]. As usual, we start from the N2 buffer and add He in steps to improve resolution. We first look at a binary mixture (1 + 2) without the problem of non-unique fragments, then employ FAIMS to unlock that problem for the quaternary mixture.
Table 1.
Theoretically expected ETD fragments of the τ 226 – 240 peptides monophosphorylated at T231, S235, S237, or S238.
| C Fragments | Z Fragments | ||||||||||
|---|---|---|---|---|---|---|---|---|---|---|---|
| T231 | S235 | S237 | S238 | T231 | S235 | S237 | S238 | ||||
| V | 1 | 117.10 | 117.10 | 117.10 | 117.10 | V | 15 | --- | --- | --- | --- |
| A | 2 | 188.14 | 188.14 | 188.14 | 188.14 | A | 14 | 1488.77 | 1488.77 | 1488.77 | 1488.77 |
| V | 3 | 287.21 | 287.21 | 287.21 | 287.21 | V | 13 | 1417.73 | 1417.73 | 1417.73 | 1417.73 |
| V | 4 | 386.28 | 386.28 | 386.28 | 386.28 | V | 12 | 1318.66 | 1318.66 | 1318.66 | 1318.66 |
| R | 5 | 542.38 | 542.38 | 542.38 | 542.38 | R | 11 | 1219.60 | 1219.60 | 1219.60 | 1219.60 |
| T | 6 | --- | --- | --- | --- | T | 10 | 1063.49 | 1063.49 | 1063.49 | 1063.49 |
| P | 7 | --- | --- | --- | --- | P | 9 | --- | --- | --- | --- |
| P | 8 | 917.50 | 837.53 | 837.53 | 837.53 | P | 8 | --- | --- | --- | --- |
| K | 9 | 1045.59 | 965.63 | 965.63 | 965.63 | K | 7 | 688.38 | 768.34 | 768.34 | 768.34 |
| S | 10 | --- | --- | --- | --- | S | 6 | 560.28 | 640.25 | 640.25 | 640.25 |
| P | 11 | 1229.68 | 1229.68 | 1149.71 | 1149.71 | P | 5 | --- | --- | --- | --- |
| S | 12 | 1316.71 | 1316.71 | 1316.71 | 1236.74 | S | 4 | 376.20 | 376.20 | 456.16 | 456.16 |
| S | 13 | 1403.74 | 1403.74 | 1403.74 | 1403.74 | S | 3 | 289.16 | 289.16 | 289.16 | 369.13 |
| A | 14 | 1474.78 | 1474.78 | 1474.78 | 1474.78 | A | 2 | 202.13 | 202.13 | 202.13 | 202.13 |
| K | 15 | --- | --- | --- | --- | K | 1 | 131.09 | 131.09 | 131.09 | 131.09 |
The EC spectrum of (1 + 2) in N2 has two major features, and the ETD pattern of 3+ precursor comprises all unique fragments (UF) for 1 (c8 at m/z of 917.5, c9 at 1045.6, z6 at 560.3, and z7 at 688.4) and 2 (c8 at 837.5, c9 at 965.6, z6 at 640.2, and z7 at 768.3), as well as numerous non-distinguishing products (Fig. 1a). All four UF for either variant have identical spectra, but those for 1 and 2 drastically differ (Fig. 1 b, c). This illustrates the self-consistency and resolution of our procedure to extract the spectra for peptide variants from those for UF. The spectrum for each precursor is reconstructed by aggregating those for all four fragments (Fig. 1d): 1 is readily separated from 2, but not vice versa because the higher-EC peak (features 1 B - D) almost coincides with 2. The sum of two traces matches the measured total spectrum (that also includes all non-distinguishing fragments), further validating the protocol.
Fig. 1.

FAIMS/ETD data (with N2 buffer) for the pT231/pS235 mixture: (a) total ETD spectrum with c/z fragments labeled (unique fragments color-coded); (b, c) normalized spectra for all UF of pT231 and pS235 with the m/z values as marked; (d) measured trace (line) with the scaled spectra for both species produced by summing the spectra for all UF of each (above), and the mixture spectrum reconstructed by adding the two (dotted line).
In He/N2 buffers, the EC spectra for four UF of either 1 or 2 remain close and their reconstructed traces also sum to the measured spectrum (Figs. S1, S2). Upon He addition, the 1D feature rapidly disappears while the minor 1B and 1C grow between the major peaks 1A and 2C (Fig. 2). The evolution of 2 is simpler: the front ledge (2A and 2B) vanishes. The variant separation becomes perfect by ~30% He.
Fig. 2.

Same as Fig. 1d with He/N2 buffers.
With the robustness of approach thus confirmed, we progress to the mixture of all four variants. Besides all ETD products in Fig. 1, we see (Fig. 3a) the distinguishing fragments at m/z = 1149.7 (c11), 369.1 (z4), and 456.2 (z5). The c12 fragment (m/z = 1236.7) was observed, but swamped by undetermined interference. Therefore, the only marker for 4 was the tiny z4 feature.
Fig. 3.

FAIMS/ETD data (with N2 buffer) for the four-variant mixture: (a) total ETD spectrum with c/z fragments labeled; (b) normalized spectra for the precursors or their groups derived by summing the spectra for all distinguishing fragments; (c) measured trace (line) with the scaled spectra for individual species derived from above data, and the mixture spectrum obtained by adding them all (dotted line).
The lack of UF for 2 and 3 can be overcome by accounting for both presence and absence of specific products at particular FAIMS features and exploiting the experimental trace to properly scale the EC spectra for various variants and their combinations elicited from ETD data. [As the yields of different c/z pairs are grossly unequal (Fig. 3a), the heights of raw EC spectra correlate with the precursor abundances only weakly).
The EC spectrum in N2 contains three major peaks (Fig. 3). We first use UF to find the spectrum for 1 (Fig. 3b), which naturally copies that in Fig. 1. The set 2/3/4 has four UF (c8, c9, z6, z7) that sum to the spectrum overlapping with peaks B and C, but not A. Hence A must be solely due to 1, and we can scale the trace for 1 to fit that peak in the measured spectrum (Fig. 3c). The spectrum for 1/2 obtained from UF c11 (1229.7) and z4 (376.2) has the dominant peak coinciding with C but little intensity at B, and the opposite nearly holds for the spectrum for 3/4 derived from parallel UF at 1149.7 and 456.2 (Fig. 3b). That allows us to scale the spectrum for 3/4 to fit B, then subtract it from the measured trace to scale the spectrum for 1/2 to fit C (Fig. 3c). We finally subtract from that the spectrum for 1 to deduce the one for 2. The normalized spectrum for 4 is extracted from its sole UF (Fig. 3b). Whereas the lack of a pronounced feature in the measured trace at its peak position precludes confident scaling and thus subtraction from the spectrum for 3/4, clearly B is due to 3 rather than 4. The sum of spectra for 1, 2, and 3/4 reasonably tracks the measured trace (Fig. 3c). Overall, FAIMS has fractionated a mixture of four components into A (1), B (predominately 3 + 4), and C (mostly 1 + 2). This partial separation is nearly enough for full characterization using ETD, which can deal with binary mixtures as explained above.
Much higher resolution is available with He/N2 buffers. By 30% He, the three peaks separate nearly baseline, with B featuring a shoulder B1 on the left and tail B3 on the right (Fig. 4a). The trace is interpreted via the outlined process (Fig. S4): the spectra for 1 and 2/3/4 indicate that A consists exclusively of 1. As the spectrum for 1/2 has a peak at C but those for 1 and 3/4 do not overlap with C, it must be solely due to 2. Thus the spectra for 1 and 1/2 can be accurately scaled, and 2 recovered by subtracting 1 from 1/2. The spectrum for 3/4 again peaks at B and is scaled to it (the spectrum for 1/2 hardly overlaps with B). The peak for 4 has moved to the low-EC side of B, where it engenders B1. It can now be scaled by subtracting the spectrum for 1/2/3, obtained from UF c12 (1316.7) and z3 (289.2) and scaled to fit B, from the trace in the appropriate region. The spectrum for 3 is derived by subtracting the scaled spectra for 2 and 4 from that for 2/3/4. Within the logic of above solutions, one can alter the details. For example, in the last step one can instead subtract the spectrum for 1/2 from 1/2/3. These variations do not affect the outcome. Again, the spectra for all four variants add up to the measured trace.
Fig. 4.

Same as Fig. 3c with He/N2 buffers.
The separation further improves at 40% He (Fig. 4b). Here, the structures B1 and B3 split into well-defined peaks. Analysis along the above path (Fig. S5) tells that B1 comprises 4 (which continues transposing to lower EC relative to 3) with some 1, while B3 is made from 1 and some 2. This conclusion agrees with the results for (1 + 2) mixture in Fig. 2.
The fraction of He in FAIMS is limited by electrical breakdown, presently to under ~65% (v/v). However, a common constraint for peptides is that some disappear largely or completely upon He addition, presumably upon “self-cleaning” where the species that changed the CV by more than the baseline peak width upon isomerization inside the gap are filtered out [34]. This can occur in any medium, but is more likely at greater He concentrations because of both stronger heating and higher resolution that decreases the magnitude of geometry shift needed for elimination. Accordingly, the best variant separations were often achieved at He fractions significantly below the breakdown threshold, such as ~40 – 60% [29]. The ion counts required for MS/MS and especially ETD exceed those for MS detection. This shifts the resolution/sensitivity balance toward the latter, and the optimum He fractions for FAIMS/ETD are lower than those for FAIMS/MS: here ~30 – 40%.
For maximum signal, all above mass spectra were collected in the “turbo mode” with low MS resolving power. That sufficed for the present exemplary mixture, but many realistic samples require higher MS resolution and mass accuracy. Those can be reached in the mode resembling multiple reaction monitoring (MRM), where the CV during ETD is switched between discrete spectral peaks selected from the initial MS-only scan. This permits extended data accumulation at a given EC that compensates for lower signal (even at the highest He fractions) at least in the “normal” MS mode (Fig. 5). For one, that enables baseline resolution of the c12 informative and z12 non-informative fragments partly merged in the turbo mode.
Fig. 5.

ETD spectrum measured at the peak B2 of Fig. 4b in the normal mode.
These peptides are also somewhat separated by FAIMS for z = 2. However, ETD of the 2+ ions from quaternary mixture produced no fragments below m/z = 1220 despite the reaction time up to 350 ms (Fig. 6). This has limited the UF to c11 and c12 that would not elucidate the picture even had FAIMS resolved all the variants. Hence we did not apply FAIMS/ETD to 2+ ions. However, those may help for other peptides that exhibit more informative fragments (e.g., because of PTMs closer to either terminus that would turn large-mass ions into UF) and/or better separation in the 2+ state.
Fig. 6.

ETD spectrum of the four-variant mixture (selecting 2+ precursors)
Conclusions
We have integrated the highest-resolution FAIMS system with ETD (on a Thermo LTQ XL ion trap) and demonstrated the ability of new platform to fully characterize the mixtures of peptide localization variants not amenable to ETD alone due to the lack of unique fragments (UF). The key aspects of data interpretation are the (i) summation of counts for all UF of each variant, (ii) scaling of so reconstructed precursor spectra to the measured trace, and (iii) use of the variant groups that have UF, the information regarding both present and missing fragments, and signal subtraction to derive the spectra for each variant. While we have addressed four species, the approach should work for more complex samples given the facility of ETD to deal with binary mixtures and the flexibility of FAIMS separations controlled by changing the dispersion voltage and gas composition. Real bioanalyses would benefit from higher mass resolution and accuracy, and we are working to couple high-definition FAIMS to the Orbitrap mass spectrometer.
Supplementary Material
Acknowledgements
We thank Gordon A. Anderson (GAACE), and Dr. Keqi Tang (PNNL) for broad aid with instrumental development and Andrew Bowman, and Julia Kaszycki for experimental assistance. This research was funded by NIH K-INBRE (P20 GM103418) and NSF EPSCoR (EPS-0903806). A.A.S. has interest in Heartland Mobility, LLC that produces high-definition FAIMS systems and ion funnel interfaces such as those utilized in this work.
References
- 1.Mann M, Jensen ON: Proteomic Analysis of Post Translational Modification. Nat. Biotechnol. 21, 255–261 (2003) [DOI] [PubMed] [Google Scholar]
- 2.Molina H, Hor DM, Tang N, Mathivanan S, Panday A: Global Proteomic Profiling of Phosphopeptides Using Electron Transfer Dissociation Tandem Mass Spectrometry. Proc. Natl. Acad. Sci. U.S.A. 104, 2199–2204 (2007) [DOI] [PMC free article] [PubMed] [Google Scholar]
- 3.Daly NL, Hoffmann R, Otvos L, Craik DJ : Role of Phosphorylation in the Conformation of tau Peptides Implicated in Alzheimer’s Disease. J. Biochemistry 39, 9039–9046 (2000) [DOI] [PubMed] [Google Scholar]
- 4.Nebreda AR: CDK Activation by Non-Cyclin Proteins. Current Opin. Cell Biol. 18, 192–198 (2006) [DOI] [PubMed] [Google Scholar]
- 5.Chi A, Huttenhower C, Geer LY, Coon JJ, Syka JEP, Bai DL, Shabanowitz J, Burke DJ, Troyanskaya OG, Hunt DF: Analysis of Phosphorylation Sites on Proteins from Saccharomyces Cerevisiae by Electron Transfer Dissociation (ETD) Mass Spectrometry. Proc. Natl. Acad. Sci. U.S.A. 104, 2193–2198 (2007) [DOI] [PMC free article] [PubMed] [Google Scholar]
- 6.Mosammaparast N, Shi Y: Reversal of Histone Methylation: Biochemical and Molecular Mechanisms of Histone Demethylases Annu. Rev. Biochem. 79, 155–179 (2010) [DOI] [PubMed] [Google Scholar]
- 7.Langlais P, Mandarino LJ, Yi Z: Label-free Relative Quantification of Co-eluting Isobaric Phosphopeptides of Insulin Receptor Substrate-1 by HPLC-ESIMS/ MS. J. Am. Soc. Mass Spectrom. 21, 1490–1499 (2010) [DOI] [PMC free article] [PubMed] [Google Scholar]
- 8.Cunningham DL, Sweet SMM, Cooper HJ, Heath JK: Differential Phosphoproteomics of Fibroblast Growth Factor Signaling: Identification of Src Family Kinase-Mediated Phosphorylation Events. J. Proteome Res. 9, 2317–2328 (2010) [DOI] [PMC free article] [PubMed] [Google Scholar]
- 9.Savitski MM, Nielsen ML, Zubarev RA: ModifiComb, a New Proteomic Tool for Mapping Substoichiometric Post-translational Modifications, Finding Novel Types of Modifications, and Fingerprinting Complex Protein Mixtures. Moll. Cell. Proteomics. 5, 935–948 (2006) [DOI] [PubMed] [Google Scholar]
- 10.Palumbo A, Reid GE: Evaluation of Gas-Phase Rearrangement and Competing Fragmentation Reactions on Protein Phosphorylation Site Assignment Using Collision Induced Dissociation-MS/MS and MS3. Anal. Chem. 80, 9735–9743 (2008) [DOI] [PubMed] [Google Scholar]
- 11.Swaney DL, McAlister GC, Wirtala M, Schwartz JC, Syka JEP, Coon JJ: Supplemental Activation Method for High-Efficiency Electron-Transfer Dissociation of Doubly Protonated Peptide Precursors. Anal. Chem. 79, 477–485 (2007) [DOI] [PMC free article] [PubMed] [Google Scholar]
- 12.Xuan Y, Creese AJ, Horner JA, Cooper HJ: High-field Asymmetric Waveform Ion Mobility Spectrometry (FAIMS) Coupled with High-Resolution Electron Transfer Dissociation Mass Spectrometry for the Analysis of Isobaric Phosphopeptides. Rapid Commun. Mass Spectrom. 23, 1963–1969 (2009) [DOI] [PubMed] [Google Scholar]
- 13.Singer D, Kuhlmann J, Muschket M, Hoffman R: Separation of Multiphosphorylated Peptide Isomers by Hydrophilic Interaction Chromatography on an Aminopropyl Phase. Anal. Chem. 82, 6409–6414 (2010) [DOI] [PubMed] [Google Scholar]
- 14.Eiceman GA, Karpas Z, Hill HH: Ion Mobility Spectrometry (3rd ed.) CRC Press, Boca Raton, Florida: (2014) [Google Scholar]
- 15.Dugourd Ph., Hudgins RR, Clemmer DE, Jarrold MF: High-resolution Ion Mobility Measurements. Rev. Sci. Instrum. 68, 1122–1129 (1997) [Google Scholar]
- 16.Ruotolo BT, Verbeck GF, Thomson LM, Woods AS, Gillig KJ, Russell DHJ: Distinguishing between Phosphorylated and Nonphosphorylated Peptides with Ion Mobility-Mass Spectrometry. Proteome Res. 1, 303–306 (2002) [DOI] [PubMed] [Google Scholar]
- 17.Glover MS, Dilger JM, Acton MD, Arnold RJ, Radivojac P, Clemmer DE: Examining the Influence of Phosphorylation on Peptide Ion Structure by Ion Mobility Spectrometry-Mass Spectrometry. 27, 786–794 (2016) [DOI] [PMC free article] [PubMed] [Google Scholar]
- 18.Ibrahim Y, Shvartsburg AA, Smith RD; Belov ME: Ultrasensitive Identification of Localization Variants of Modified Peptides Using Ion Mobility Spectrometry. Anal. Chem. 83, 5617–5623 (2011) [DOI] [PMC free article] [PubMed] [Google Scholar]
- 19.Guevremont RJ: High-field Asymmetric Waveform Ion Mobility Spectrometry: A New Tool for Mass Spectrometry. Chromatogr. A 1058, 3–19 (2004) [PubMed] [Google Scholar]
- 20.Shvartsburg AA: Differential Ion Mobility Spectrometry. CRC Press, Boca Raton, Florida: (2008) [Google Scholar]
- 21.Guevremont R, Barnett DA, Purves RW, Vandermey J: Analysis of a Tryptic Digest of Pig Hemoglobim Using ESI-FAIMS-MS. Anal. Chem. 72, 4577–4584 (2000) [DOI] [PubMed] [Google Scholar]
- 22.Shvartsburg AA, Mashkevich SV, Smith RD: Feasibility of Higher-Order Differential Ion Mobility Separations Using New Asymmetric Waveforms. J. Phys. Chem. A. 110, 2663–2673 (2006) [DOI] [PMC free article] [PubMed] [Google Scholar]
- 23.Shvartsburg AA, Isaac G, Leveque N, Smith RD, Metz TO: Separation and Classification of Lipids Using Differential Ion Mobility Spectrometry. J. Am. Soc. Mass Spectrom. 22, 1146–1155 (2011) [DOI] [PMC free article] [PubMed] [Google Scholar]
- 24.Shvartsburg AA, Creese AJ, Smith RD, Cooper HJ: Separation of a Set of Peptide Sequence Isomers Using Differential Ion Mobility Spectrometry Anal Chem. 83, 6918–6923 (2011) [DOI] [PMC free article] [PubMed] [Google Scholar]
- 25.Shvartsburg AA, Li F, Tang K, Smith RD: High-Resolution Field Asymmetric Waveform Ion Mobility Spectrometry Using New Planar Geometry Analyzers. Anal. Chem. 78, 3706–3714 (2006) [DOI] [PMC free article] [PubMed] [Google Scholar]
- 26.Shvartsburg AA, Tang K, Smith RD: Understanding and Designing Field Asymmetric Waveform Ion Mobility Spectrometry Separations in Gas Mixtures. Anal. Chem. 76, 7366–7374 (2004) [DOI] [PubMed] [Google Scholar]
- 27.Shvartsburg AA, Seim TA, Danielson WF, Norheim R, Moore RJ, Anderson GA, Smith RD: High-Definition Differential Ion Mobility Spectrometry with Resolving Power up to 500. J. Am. Soc. Mass Spectrom. 24, 109–114 (2013) [DOI] [PMC free article] [PubMed] [Google Scholar]
- 28.Shvartsburg AA, Singer D, Smith RD, Hoffman R: Ion Mobility Separation of Isomeric Phosphopeptides from a Protein with Variant Modification of Adjacent Residues. Anal. Chem. 83, 5078–5085 (2011) [DOI] [PMC free article] [PubMed] [Google Scholar]
- 29.Shvartsburg AA, Zheng Y, Smith RD, Kelleher NL: Separation of Variant Methylated Histone Tails by Differential Ion Mobility. Anal. Chem. 84, 6317–6320 (2012) [DOI] [PMC free article] [PubMed] [Google Scholar]
- 30.Bridon G, Bonneil E, Muratore-Schroeder T, Caron-Lizotte O, Thibault P: Improvement of Phosphoproteome Analyses Using FAIMS and Decision Tree Fragmentation. Application to the Insulin Signaling Pathway in Drosophila Melanogaster S2 Cells. J. Proteome Res. 11, 927–940 (2012) [DOI] [PubMed] [Google Scholar]
- 31.Creese AJ, Cooper HJ: Separation and Identification of Isomeric Glycopeptides by High Field Asymmetric Waveform Ion Mobility Spectrometry. Anal. Chem. 84, 2597–2601 (2012) [DOI] [PMC free article] [PubMed] [Google Scholar]
- 32.Ulasi GN, Creese AJ, Hui SX, Penn CW, Cooper HJ, : Comprehensive mapping of O-glycosylation in flagellin from Campylobacter jejuni 11168: A multienzyme differential ion mobility mass spectrometry approach. Proteomics. 15, 2733–2745 (2015) [DOI] [PMC free article] [PubMed] [Google Scholar]
- 33.Protein Prospector freely available at: http://prospector.ucsf.edu/prospector/mshome.htm
- 34.Shvartsburg AA, Li F, Tang K, Smith RD: Distortion of Ion Structures by Field Asymmetric Waveform Ion Mobility Spectrometry. Anal. Chem. 79, 1523–1528 (2007) [DOI] [PubMed] [Google Scholar]
Associated Data
This section collects any data citations, data availability statements, or supplementary materials included in this article.