

Abstract
Background:
Coronary artery calcium scoring only represents a small fraction of all information available in noncontrast cardiac computed tomography (CAC-CT). We hypothesized that an automated pipeline using radiomics and machine learning could identify phenotypic information about high-risk left ventricular hypertrophy (LVH) embedded in CAC-CT.
Methods:
This was a retrospective analysis of 1,982 participants from the Dallas Heart Study who underwent CAC-CT and cardiac magnetic resonance (CMR). Two hundred and twenty-four participants with high-risk LVH were identified by CMR. We developed an automated adaptive atlas algorithm to segment the left ventricle on CAC-CT, extracting 107 radiomics features from the volume of interest. Four logistic regression (LR) models using different feature selection methods were built to predict high-risk LVH based on CAC-CT radiomics, gender, height, and body surface area in a random training subset of 1,587 participants.
Results:
The respective areas under the receiver operating characteristics curves for the cluster-based model, the LR model after exclusion of highly correlated features, and the penalized LR models using least absolute shrinkage and selection operators with “minimum” or “one standard error” lambda values were 0.74 (CI95%: 0.67–0.82), 0.74 (CI95%: 0.67–0.81), 0.76 (CI95%: 0.69–0.83), and 0.73 (CI95%: 0.66–0.80) for detecting high-risk LVH in a distinct validation subset of 395 participants.
Conclusions:
Ventricular segmentation, radiomics features extraction, and machine learning can be used in a pipeline to automatically detect high-risk phenotypes of LVH in participants undergoing CAC-CT, without the need for additional imaging or radiation exposure.
Clinical Trial Registration Information:
ClinicalTrials.gov Identifier: NCT00344903, available at https://clinicaltrials.gov/ct2/show/NCT00344903
Keywords: Tomography, X-Ray Computed, Hypertrophy, Left Ventricular, Ventricular Remodeling, Heart Failure
AHA Journal Subject Terms: Computerized Tomography (CT), Hypertrophy, Remodeling, Heart Failure
1). Introduction
Coronary artery calcium (CAC) scoring by computed tomography scanning (CT) is an established method for assessing atherosclerotic burden and is strongly associated with future adverse atherosclerotic cardiovascular events in asymptomatic individuals and those with stable chest pain (1–3). Although CT scanner technology has advanced over the last two decades (4), the approach to CAC-CT has not significantly changed since its introduction more than 25 years ago (5). Considering that on average a CAC-CT scan consists of 40 to 60 slices through the heart, the current clinical practice typically collapses information from 10 to 16 million voxels into a single numeric feature (i.e. the Agatston score).
Prior studies encompassing large multi-ethnic cohorts have shown that phenotypic elements identifiable on imaging, such as left ventricular hypertrophy and remodeling, can play a significant role in the identification of individuals at risk for future heart failure or death (6–10). Therefore, a screening method that could integrate the assessment of coronary calcium and left ventricular phenotypes would be highly desirable in preventive cardiac imaging.
Two recent advances are critical to extracting additional information from CT scans. First, radiomics approaches can be used to extract quantitative imaging features about shape, intensity, and texture from image datasets (11). Second, machine learning methods have evolved rapidly in imaging, providing means to integrate these quantitative features into predictive instruments for clinically relevant outcomes (12). Improvements in computer technology and the development of open source software libraries have bolstered the application of machine learning methods to medical imaging (13). Machine learning has the potential to streamline the extraction and analysis of multiple parameters from CAC-CT, overcoming time-consuming operator-dependent manual post-processing. Moreover, data extraction using machine learning is scalable, reproducible, and could be applied prospectively or retrospectively with favorable cost profiles, without the need to expose individuals to additional ionizing radiation. We hypothesized that these methods may hold the key to unlock underutilized information present on CAC-CT.
The objective of this study was to develop and determine if a fully automated pipeline consisting of LV segmentation, radiomics feature extraction, and machine learning modeling on CAC-CT could be used to predict high-risk left ventricular hypertrophy (LVH) phenotypes in a multi-ethnic, population-based cohort.
2). Material and Methods
2.1). Study Participants and Demographic Data
The Dallas Heart Study (DHS) is a single center, multi-ethnic, population-based probability sample of the Dallas County residents, with deliberate oversampling of blacks, focused to serve as a research platform for better understanding the effects of biologic and social variables in cardiovascular health (14). All participants provided written informed consent and the study protocol was approved by the Institutional Review Board of University of Texas Southwestern Medical Center. We retrospectively analyzed data obtained from participants of the DHS phase 2 (DHS2) (15) who concurrently underwent a CAC-CT for coronary Agatston scoring and a cardiac MR for assessment of cardiac morphology and function (CMR). The exclusion criteria comprised any failure to retrieve or to post process the imaging data. We obtained the demographic and ancillary non-radiologic data from the original DHS2 database.
Because of the sensitive nature of the data collected for this study, requests to access the dataset from qualified researchers trained in human subject confidentiality protocols may be sent to the Center for Translational Medicine at the University of Texas Southwestern Medical Center (5323 Harry Hines Blvd, Dallas, TX 75390; Phone: +1 214-648-2500).
2.2). Imaging Studies
Non-contrast-enhanced cardiac CT scans were obtained using an Aquilion CT scanner (Toshiba Tokyo, Japan) with prospective ECG-triggering (65 to 85% of the RR wave interval) and the following parameters: 135 kVp and fixed 150 mA tube current and 0.5-s rotation time; 64 × 0.5 mm collimation, reconstructed with half-scan filtered back projection (manufacturer’s convolution kernel FC12) in 3 × 3 mm axial slices; 512 × 512 matrix; 0.6 × 0.6 × 3 mm voxel size (15). Cardiac MR images were obtained using a 3.0 Tesla Achieva MR scanner (Philips Medical Systems Best, Netherlands) as previous reported (16).
2.3). Machine Learning Pipeline
2.3.1). Automatic Segmentation of the Heart on CAC-CT
We randomly sampled 70 participants from the DHS2 cohort. A cardiothoracic radiologist with 10 years of clinical practice manually segmented the external boundaries of the four cardiac chambers on the CAC-CT using the software 3D Slicer (version 4.10.0) (17). Given the lack of intravenous contrast, the segmentation relied on secondary anatomic landmarks generally visible on CAC-CT, such as the course of the left anterior descending and posterior descending coronary arteries in the anterior and posterior interventricular grooves (i.e., division between the right and left heart), as well as the course of the right and left circumflex arteries in the atrioventricular grooves (i.e., division between the ventricles and atria). The contours were defined at the boundaries between the myocardium and epicardial fat, using a similar approach as previously described (18).
Next, we randomly subsampled 50 out of the 70 segmented CAC-CT to serve as “atlases” for the automatic segmentation algorithm. The remaining 20 cases were used for algorithm validation. The automatic segmentation algorithm used a multi-atlas approach (19) written in Python (20) with the Simple ITK library (21). The first step consisted in the application of 3D affine transformations between each of the 50 atlases to a target CAC-CT with unknown segmentation. The transforms obtained during the optimization process were used to warp images and respective segmentations. In the second step, we calculated the Euclidean distance between each transformed atlas and the respective target CAC-CT, after which the atlases were ranked in ascending order. We selected a k number of atlases with the smaller distances to each target for the more computationally expensive non-linear registration step. To balance computing time and algorithm performance, the k parameter was set to five atlases based on literature data (19) and on our empirical data. In the third step, the k transformed atlases underwent a second round of deformable registration to the target using the Demons registration algorithm (22). The final transforms were used to warp the respective segmentations a second time.
The two sequential registration steps resulted in a 4D tensor containing the segmentation of the five best atlases in correspondence to the target 3D CAC-CT dataset. We obtained the final cardiac segmentation of the target by flattening the 4th dimension of that tensor using majority voting decision. Subsequently, 5 × 5-pixel median filtering followed by Gaussian deconvolution were used to eliminate “salt and pepper artifacts” and to smooth the segmentation edges of the masks, respectively. The segmentation results of the algorithm were validated in the subsample of 20 CAC-CT out of the 70 studies that were manually segmented, but not used in the development of the algorithm; the Dice coefficient, Jaccard index, and volumetric similarity were selected as indicators of the segmentation algorithm performance against expert manual segmentation (23).
2.3.2). Extraction of Features from the Left Ventricular Segmentation on CAC-CT
We extracted the radiomic features from the LV segmentation using the Pyradiomics library (24). No additional pre-processing filters were applied prior to feature extraction. The following classes were enabled for feature extraction: first order statistics, 3D shape-based and 2D shape-based geometric features, gray level co-occurrence matrix, gray level run length matrix, gray level size zone matrix, neighboring gray tone difference matrix, and gray level dependence matrix. A list with all of the enabled features can be found in the Supporting Materials, Supporting Table 1, and a detailed description of those features can be found elsewhere (25).
2.4). Standard of Reference: Cardiac MR
The LV was manually segmented on CMR in all DHS2 participants as previously described (16), in accordance with published guidelines (26). The parameters obtained were LV end-diastolic volume (LVEDV), LV end-systolic volume (LVESV), LV stroke volume (LVSV), and LV mass (LVmass). We compared the voxel volume measurements obtained by the automatic CAC-CT segmentation against the end-diastolic and end-systolic measurements obtained by CMR, using the sum of the LV cavity with the LVmass divided by the specific gravity of myocardium (1.05 g/mL) (27).
The CMR criteria for defining the presence of LVH was an LVmass/height2.7 ≥34.1 g/m2.7 for female and ≥38.1 g/m2.7 for male gender. In participants with LVH, increased LV concentricity was defined as LVmass/LVEDV0.67 ≥5.8 g/mL0.67 for female and ≥7.2 g/mL0.67 for male gender. LV dilation was defined LVEDV/BSA ≥80.3 mL/m2 for female and ≥82.8 mL/m2 for male gender (16, 28). The categories of LVH were 1) indeterminate hypertrophy (neither increased LV concentricity nor dilation), 2) thick hypertrophy (increased LV concentricity without dilation), 3) dilated hypertrophy (LV dilation without increased concentricity), and 4) both thick and dilated hypertrophy (increased LV concentricity and dilation) (8, 29). The outcome variable was dichotomized into low and high-risk LVH subtypes, the first category including no LVH and indeterminate LVH, the latter including thick, dilated, and both thick and dilated hypertrophy (8).
2.5). Predictive Model
We built four logistic regression models to assess the probability of high-risk LVH as defined by CMR criteria, based on the features extracted from left ventricular segmentation on CAC-CT and gender, height, and body surface area (BSA). The participants were randomly split into a training and a validation subset, respectively comprising 80% and 20% of the initial dataset, stratified by the dependent variable. Independent variables were scaled to an interval between zero and one for improving computational performance. These two steps used helper functions of the caret library in R (30).
The first approach to decrease data dimensionality consisted of applying a hierarchical variable clustering algorithm on all radiomic features (Supporting Figure 1) (31). Subsequently, each one of the variable clusters was treated as a “synthetic variable” with the central measure being the first principal linear component of the cluster (31). Last, the synthetic variables were fitted to a logistic regression model (“cluster-based LR model”).
The second approach to decreased data dimensionality consisted of eliminating “highly correlated” features. First, a correlation matrix using Pearson’s correlation coefficient is obtained in a pair-wise fashion between all radiomic variables (Supporting Figure 2). The findCorrelation function from the caret package searches for absolute correlation coefficients above a specified threshold; arbitrarily set to 0.80 in our study (values greater than 0.75 are empirically used in machine learning algorithms) (30). When the correlation coefficient between two variables exceeds this threshold, the algorithm looks at the mean absolute correlation of each variable across the correlation matrix, removing the one with the largest mean absolute correlation across other features. After this procedure, the remaining variables were fitted to the training set using logistic regression (“LR model without highly correlated features”).
The third and fourth models were derived from using the Least Absolute Shrinkage and Selection Operator (LASSO) method with 10-fold cross-validation across all set of features of the training set. Two models were created using the glmnet library in R (32); one with the λ parameter that minimizes the out-of-sample error (“optimal LASSO”), and the other with the least number of variables within one standard error from the optimal model out-of-sample error (“simplest LASSO”). Figure 1 summarizes the machine learning pipeline.
Figure 1.
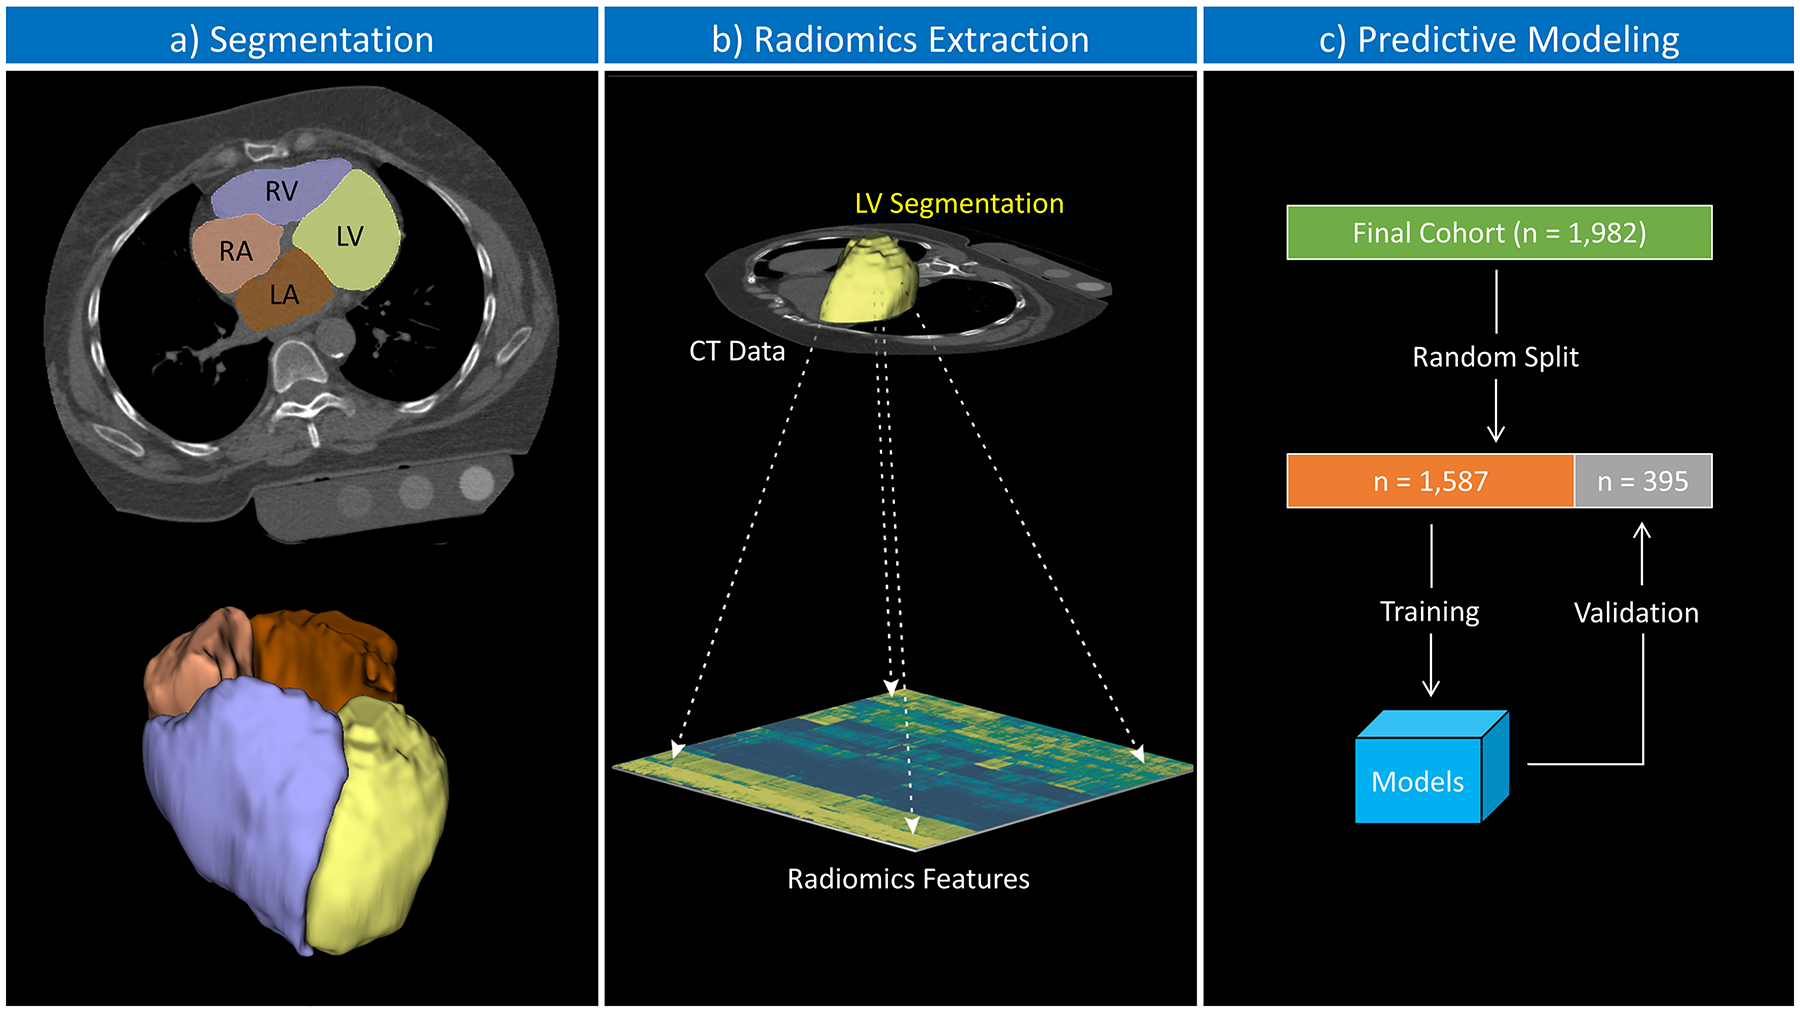
Schematic illustration of the study pipeline. (a) Segmentation: the automated multiatlas-based algorithm performed semantic segmentation of the cardiac chambers; color overlay representing the segmentation results (LV, left ventricle; RV, right ventricle; LA, left atrium; RA, right atrium). (b) Radiomics extraction: the LV segmentation was used to extract radiomics features from the CT data. (c) The final cohort was randomly split into training (80%) and validation (20%) datasets; radiomics features and correspondent cardiac magnetic resonance phenotypes were used to build the predictive models on the training dataset; posteriorly, the models were tested against the validation set.
2.6). Statistical Analysis
We performed all statistical analysis on R (version 3.5.3, The R Foundation for Statistical Computing – Vienna, Austria), and the summary of measures are presented as the mean ± standard deviation, unless specified otherwise. We used the Student’s unpaired t-test to assess for statistically significant differences of continuous demographic variables and chi-square test to assess for statistically significant differences of categorical variables between training and validation subsets. We used Pearson’s R coefficient to assess the correlation between the voxel volume of the automatic CT segmentation and the CMR segmentations (LVEDV or LVESV + Mass/specific gravity of myocardium). The bias and limits of agreement between the methods were graphically analyzed using the Bland-Altman plot (33). We used receiver operating characteristics analysis to assess the performance indicators (sensitivity, specificity, positive and negative predictive values) at the best discriminator thresholds for all models. The 95% confidence intervals for the AUC and performance indicators were calculated using the DeLong method and bootstrapping, respectively. Pair-wise comparisons between AUCs of different models were made using the Venkatraman method with Bonferroni correction for multiple comparisons (34). A p-value smaller than 0.05 was considered statistically significant.
3). Results
3.1). Summary of the Demographic Data
The final study cohort comprised 1,982 out of 1,988 participants who underwent both CAC-CT and CMR. Six participants (0.3%, 6/1,988) were excluded due to failure in the completion of the CAC-CT segmentation step. The random data split resulted in a training set with 1,587 participants and a validation set with 395 participants. There were no statistically significant differences between the demographic, risk, CMR parameters, LVH prevalence or subtype, or calcium score value data between the two groups. The prevalence of high-risk LVH in the training and validation subsets was 11% (respectively, 179/1,587 and 45/395). Table 1 summarizes the data in the two subsets.
Table 1.
Comparison of Demographics, CMR Measurements, and Calcium Score Between Training and Test Samples. Mean ± standard deviation
| Training Subset | Validation Subset | P-value | |
|---|---|---|---|
| N of Participants | 1,587 | 395 | |
| Age | 51.09 ± 9.56 | 51.52 ± 9.91 | 0.5208 |
| Gender (F/M) | 945 (60%) / 642 (40%) | 223 (56%) / 172 (44%) | 0.2891 |
| Ethnicity (AA/Other) | 794 (50%) / 793 (50%) | 178 (45%) / 217 (55%) | 0.0870 |
| Height (cm) | 167.98 ± 9.49 | 168.38 ± 9.55 | 0.4571 |
| BSA (m2) | 1.95 ± 0.21 | 1.96 ± 0.21 | 0.3130 |
| Framingham 10-yr risk | 4.21 ± 5.30 | 4.41 ± 4.99 | 0.5593 |
| Agatston score | 99.33 ± 431.28 | 104.46 ± 288.39 | 0.8143 |
| CMR-LVEDV | 118.15 ± 27.51 | 119.79 ± 28.02 | 0.2946 |
| CMR-LVESV | 37.30 ± 14.73 | 38.92 ± 16.37 | 0.0735 |
| CMR-LVSV | 80.85 ± 16.66 | 80.88 ± 15.72 | 0.9749 |
| CMR-LVEF | 69.09 ± 6.45 | 68.37 ± 6.80 | 0.0568 |
| CMR-LVmass | 127.60 ± 37.32 | 128.67 ± 37.41 | 0.6110 |
| No LVH | 1247 (79%) | 312 (79%) | |
| LVH | |||
| ■ INDETERMINATE | 161 (10%) | 38 (10%) | 0.4804 |
| ■ THICK | 142 (8%) | 31 (8%) | |
| ■ DILATED | 27 (2%) | 12 (3%) | |
| ■ BOTH | 10 (1%) | 2 (0.5%) |
3.2). Results of the Automatic Segmentation of the Heart on CAC-CT
The performance indicators for the automated LV segmentation algorithm against the validation set were: Dice coefficient, 0.86 ± 0.07; Jaccard index, 0.76 ± 0.10, and volumetric similarity, 0.06 ± 0.14.
3.3). CAC-CT vs CMR
The correlation coefficient between the LV segmentation volume on CAC-CT and LV diastolic volume on CMR (LVEDV + LVMass/specific gravity of myocardium) was 0.57 (CI95%: 0.54 – 0.60, p-value < 0.001). In average, the LV volume measured by CAC-CT was biased by −42.03 mL when compared to diastolic CMR measurements, with 95% limits of agreement between −143.59 mL and 59.54 mL (Figure 2a–b). The correlation coefficient between the LV segmentation volume of CAC-CT and LV systolic volume on CMR (LVESV + LVMass/specific gravity of myocardium) was 0.54 (CI95%: 0.50 – 0.57, p-value < 0.001). In average, the LV volume measured by CAC-CT was biased by +38.83 mL when compared to systolic CMR measurements, with 95% limits of agreement between −56.91 mL and 134.57 mL (Figure 2c–d).
Figure 2.
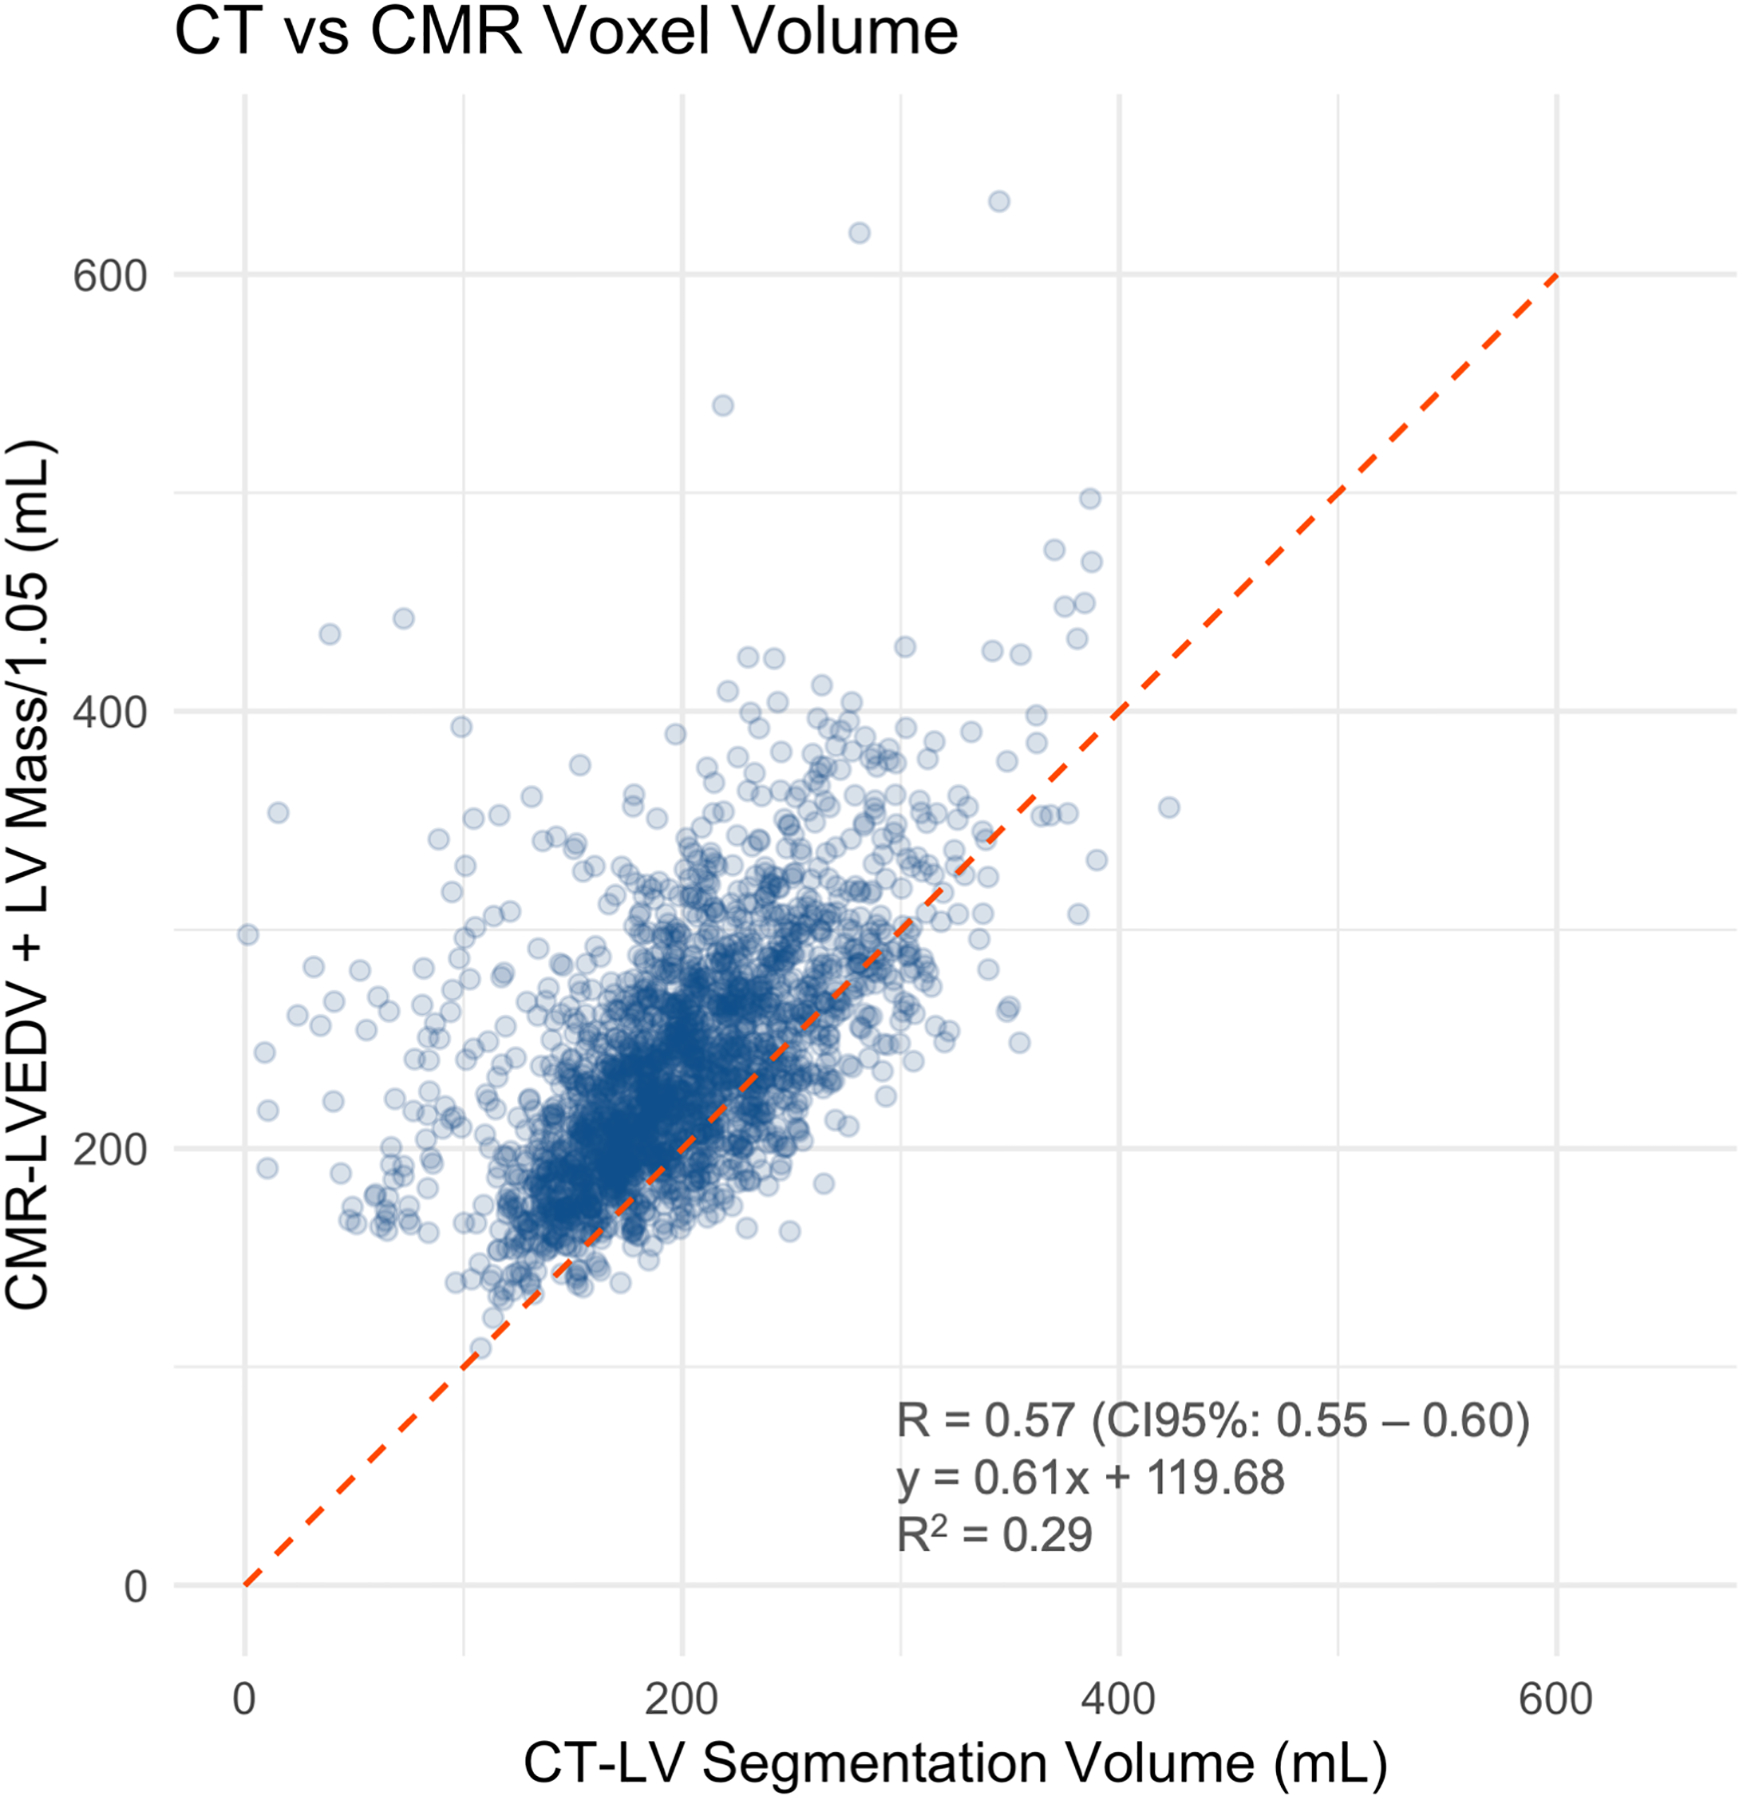
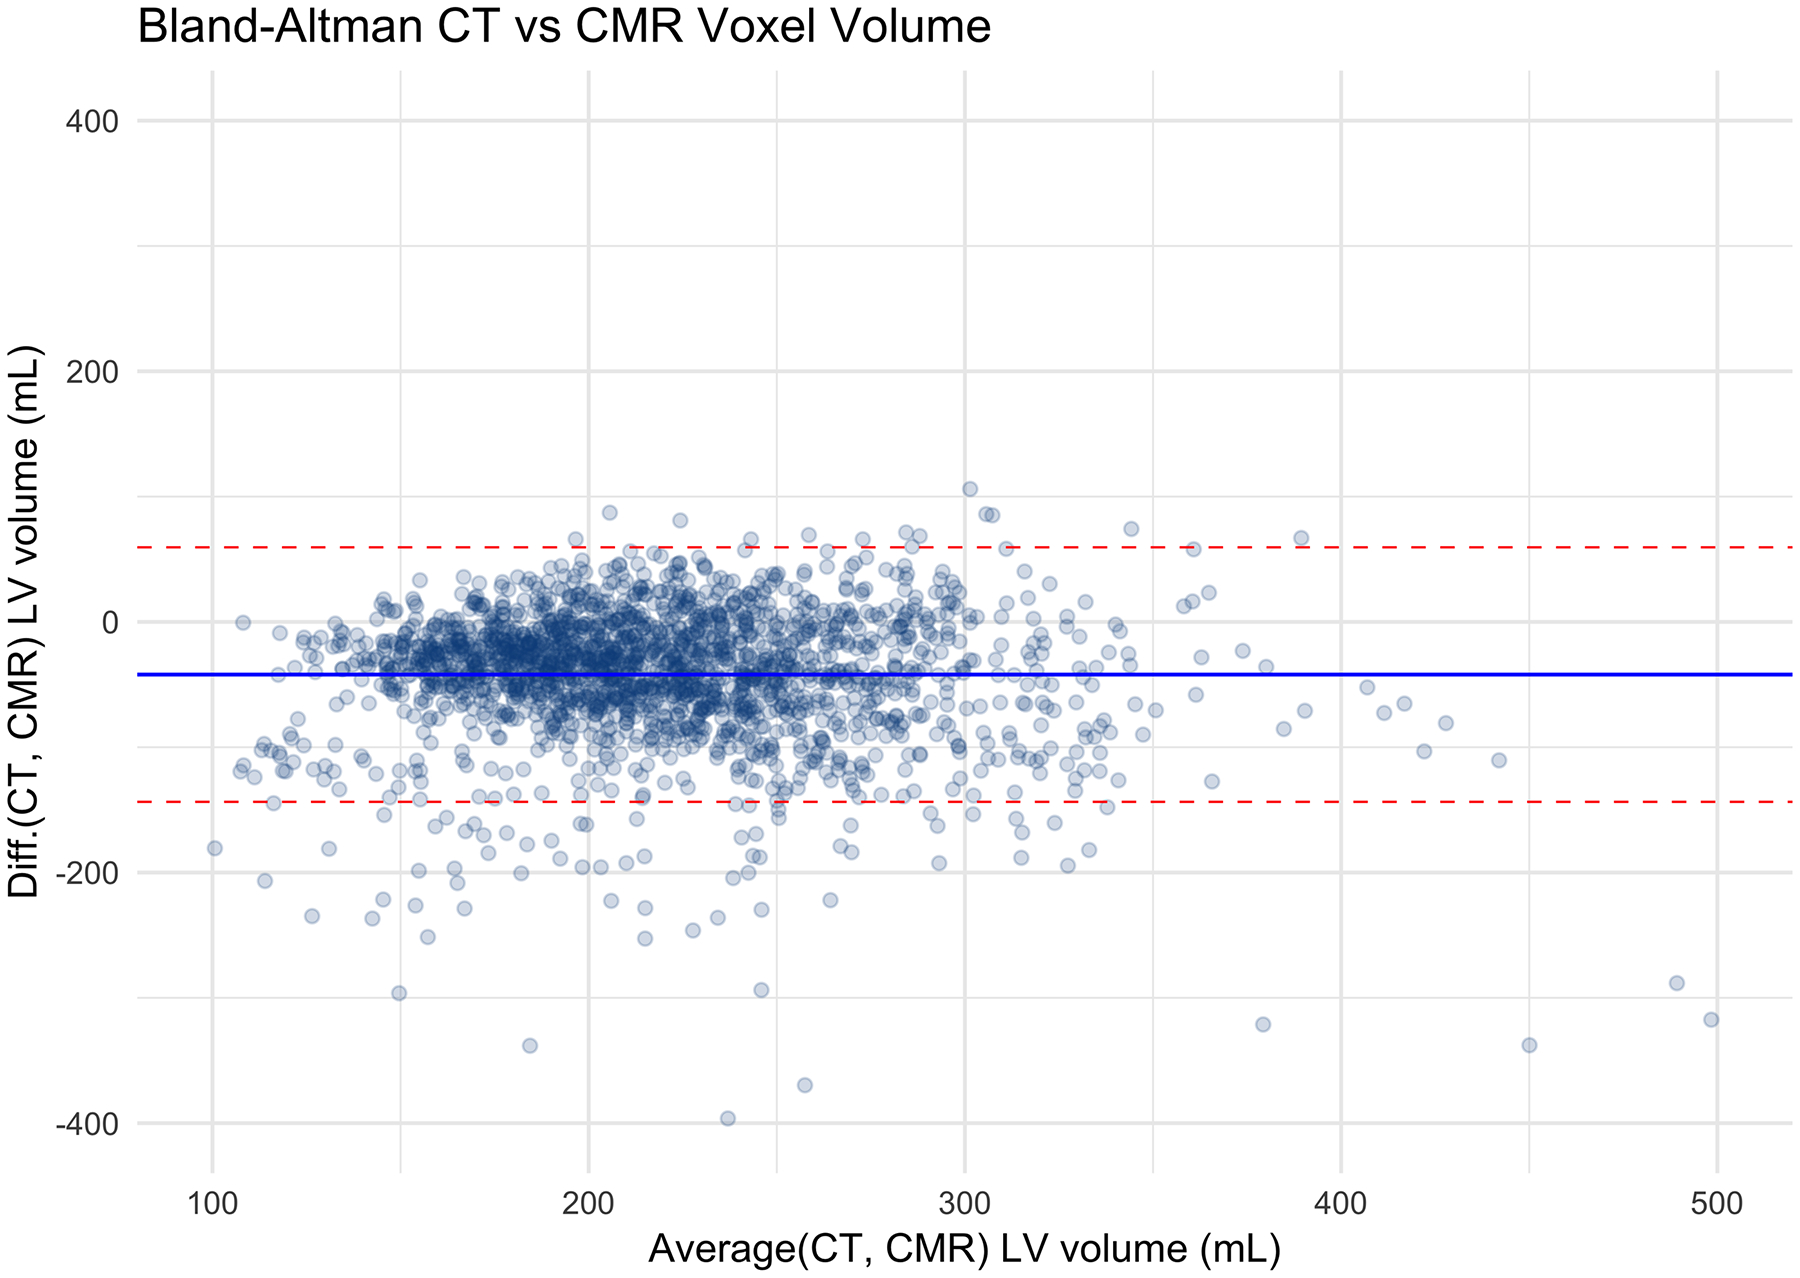
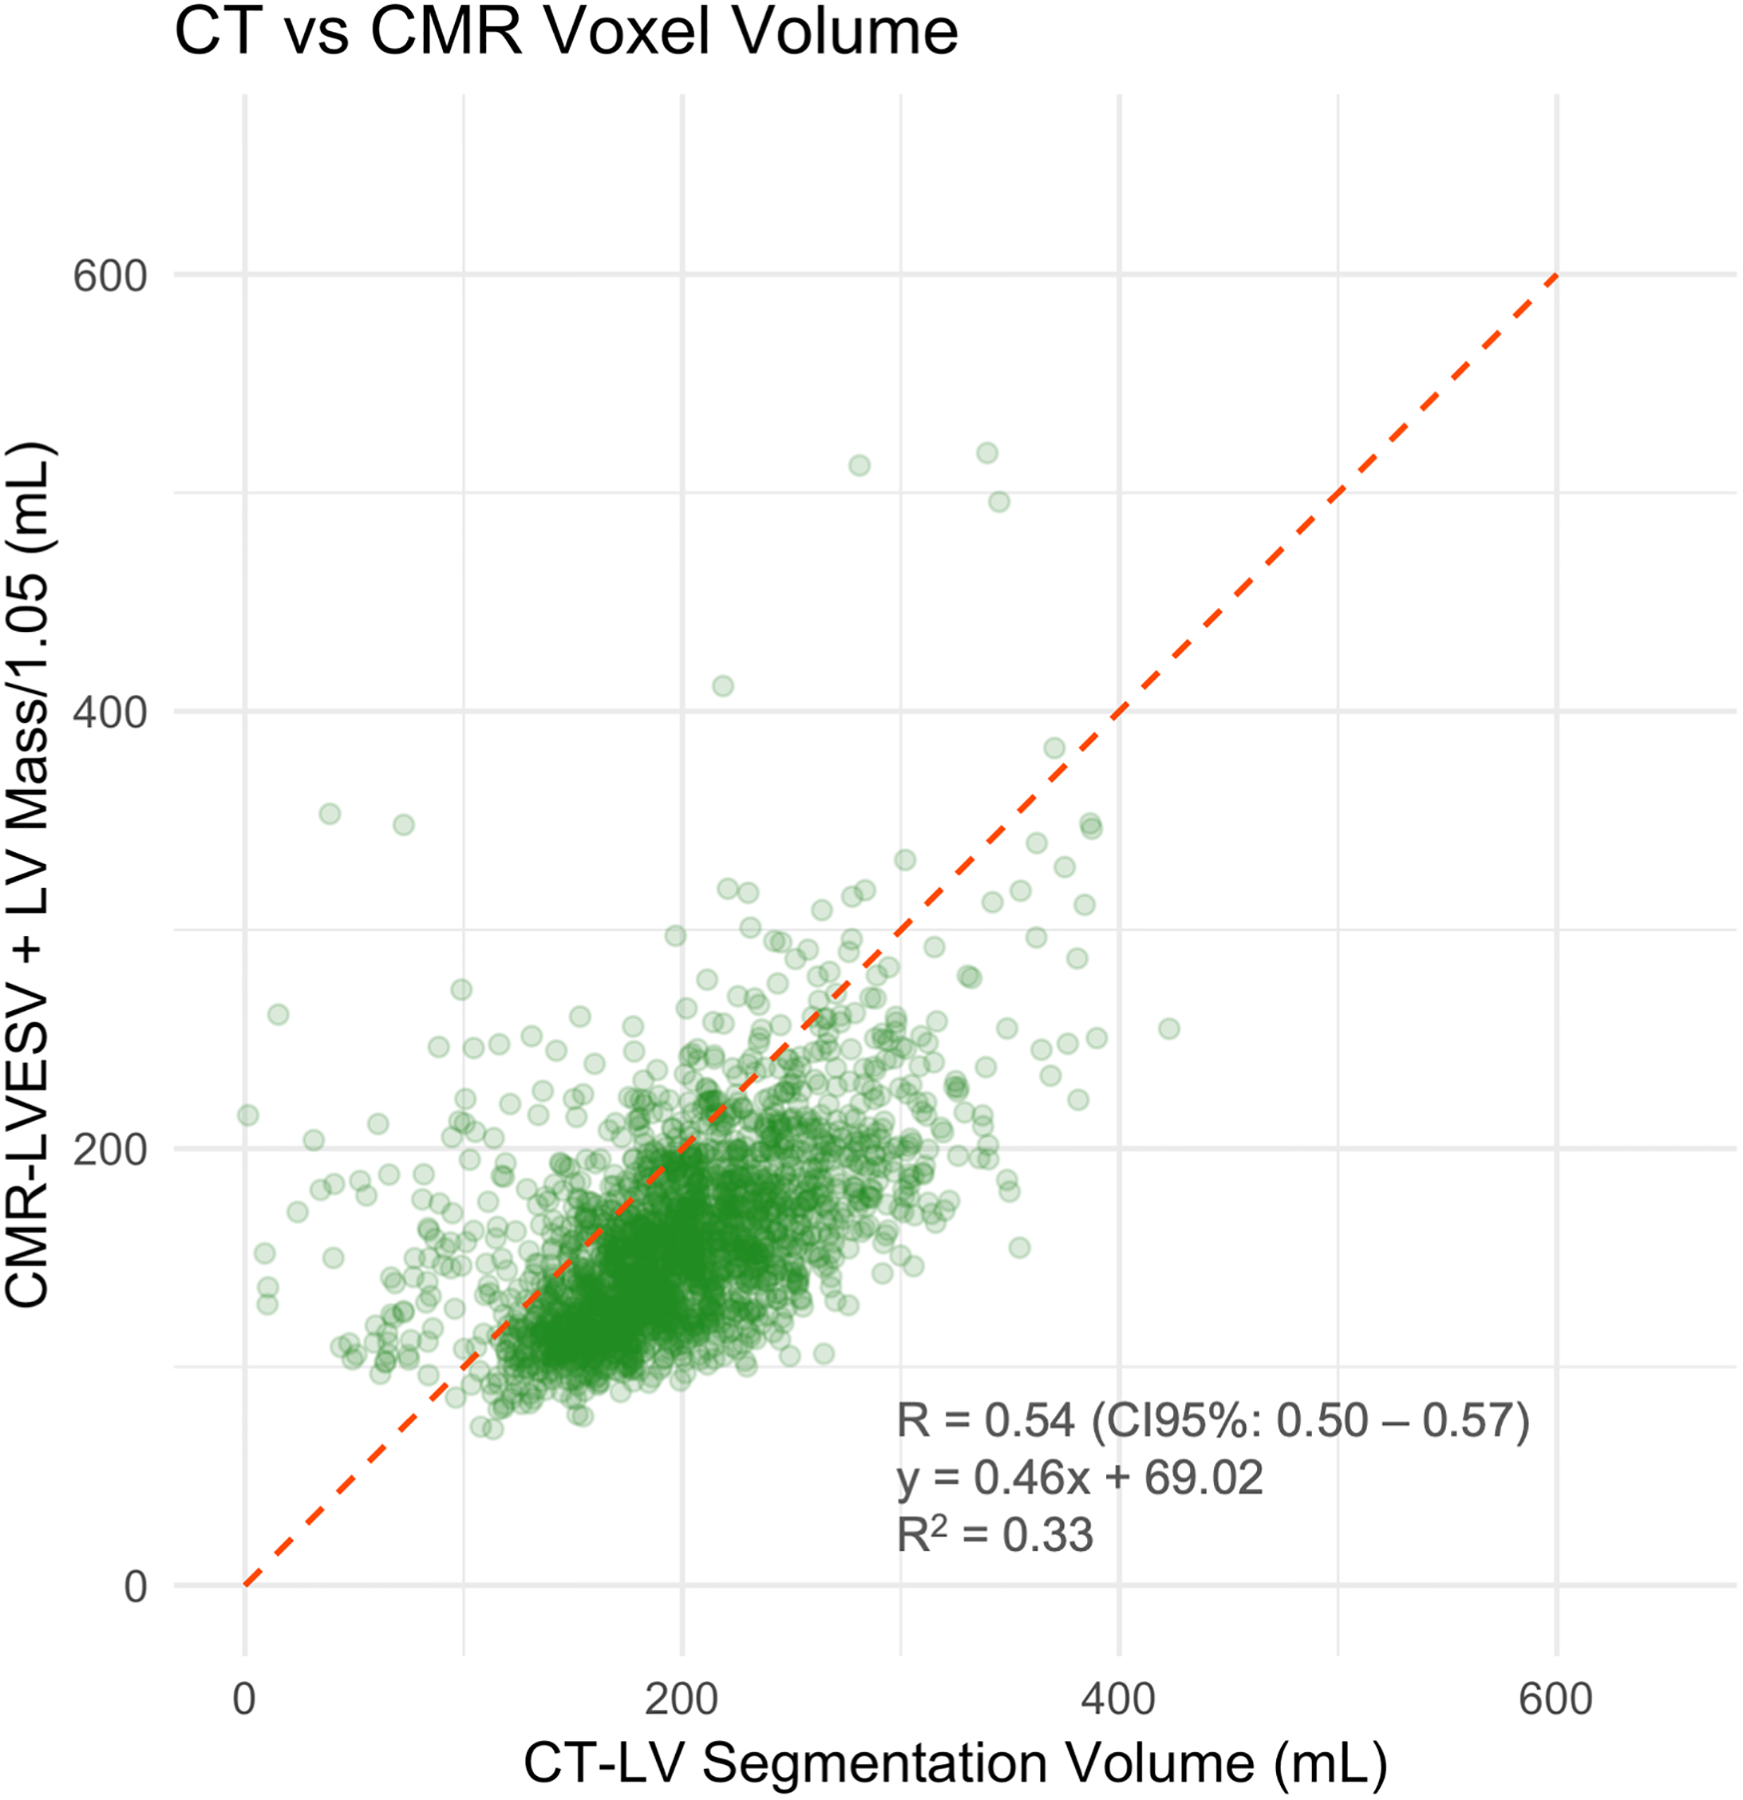
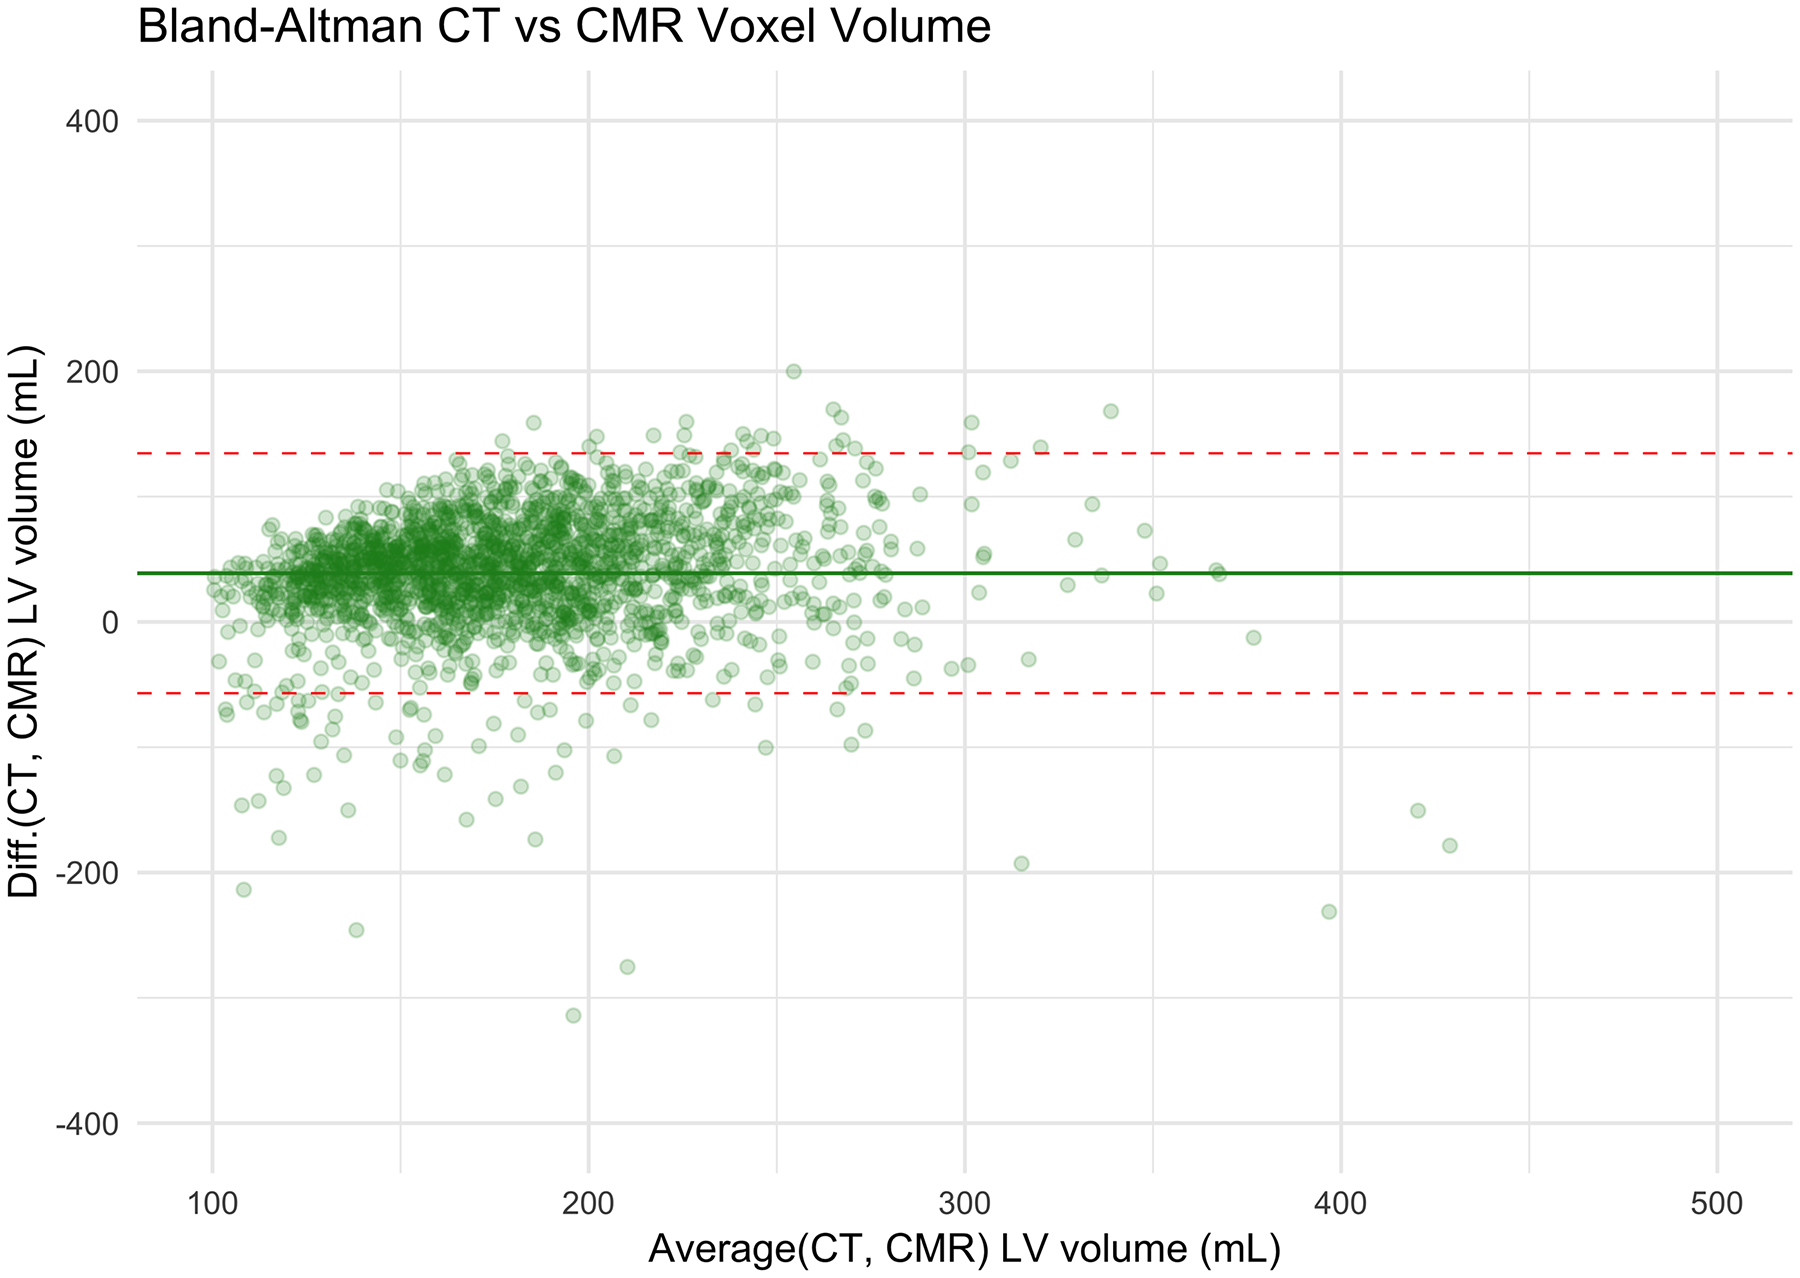
Left ventricle (LV) measurements: Coronary artery calcium scoring computed tomography (CAC-CT) versus cardiac magnetic resonance (CMR). A, Scatter plot of LV volumes measured on CAC-CT versus diastolic CMR (R=0.57 [95% CI, 0.54 – 0.60], P < 0.001). B, Bland-Altman plot of LV volumes measured on CAC-CT vs diastolic CMR (average bias = −42.03 mL; limits of agreement = −143.59, 59.54 mL). C, Scatter plot of LV volumes measured on CAC-CT vs systolic CMR (R=0.54 [95% CI, 0.50 – 0.57], P < 0.001). D, Bland-Altman plot of LV volumes measured on CAC-CT vs diastolic CMR (average bias =38.83 mL, limits of agreement = −56.91, 134.57 mL). The dashed red lines in A and C represent the identity function. The continuous lines and the dashed red lines in B and D represent the bias and the 95% CI limits of agreement, respectively. LVEDV indicates left ventricular end-diastolic volume, and LVESV, left ventricular end-systolic volume.
3.4). Feature Extraction and Performance of the Prediction Models
One-hundred and seven radiomics features were extracted from the LV segmentation, and combined with three clinical variables that were used for the CMR-based LVH phenotyping (participant gender, BSA, and height). Figure 3 summarizes all of the features in the whole cohort.
Figure 3.
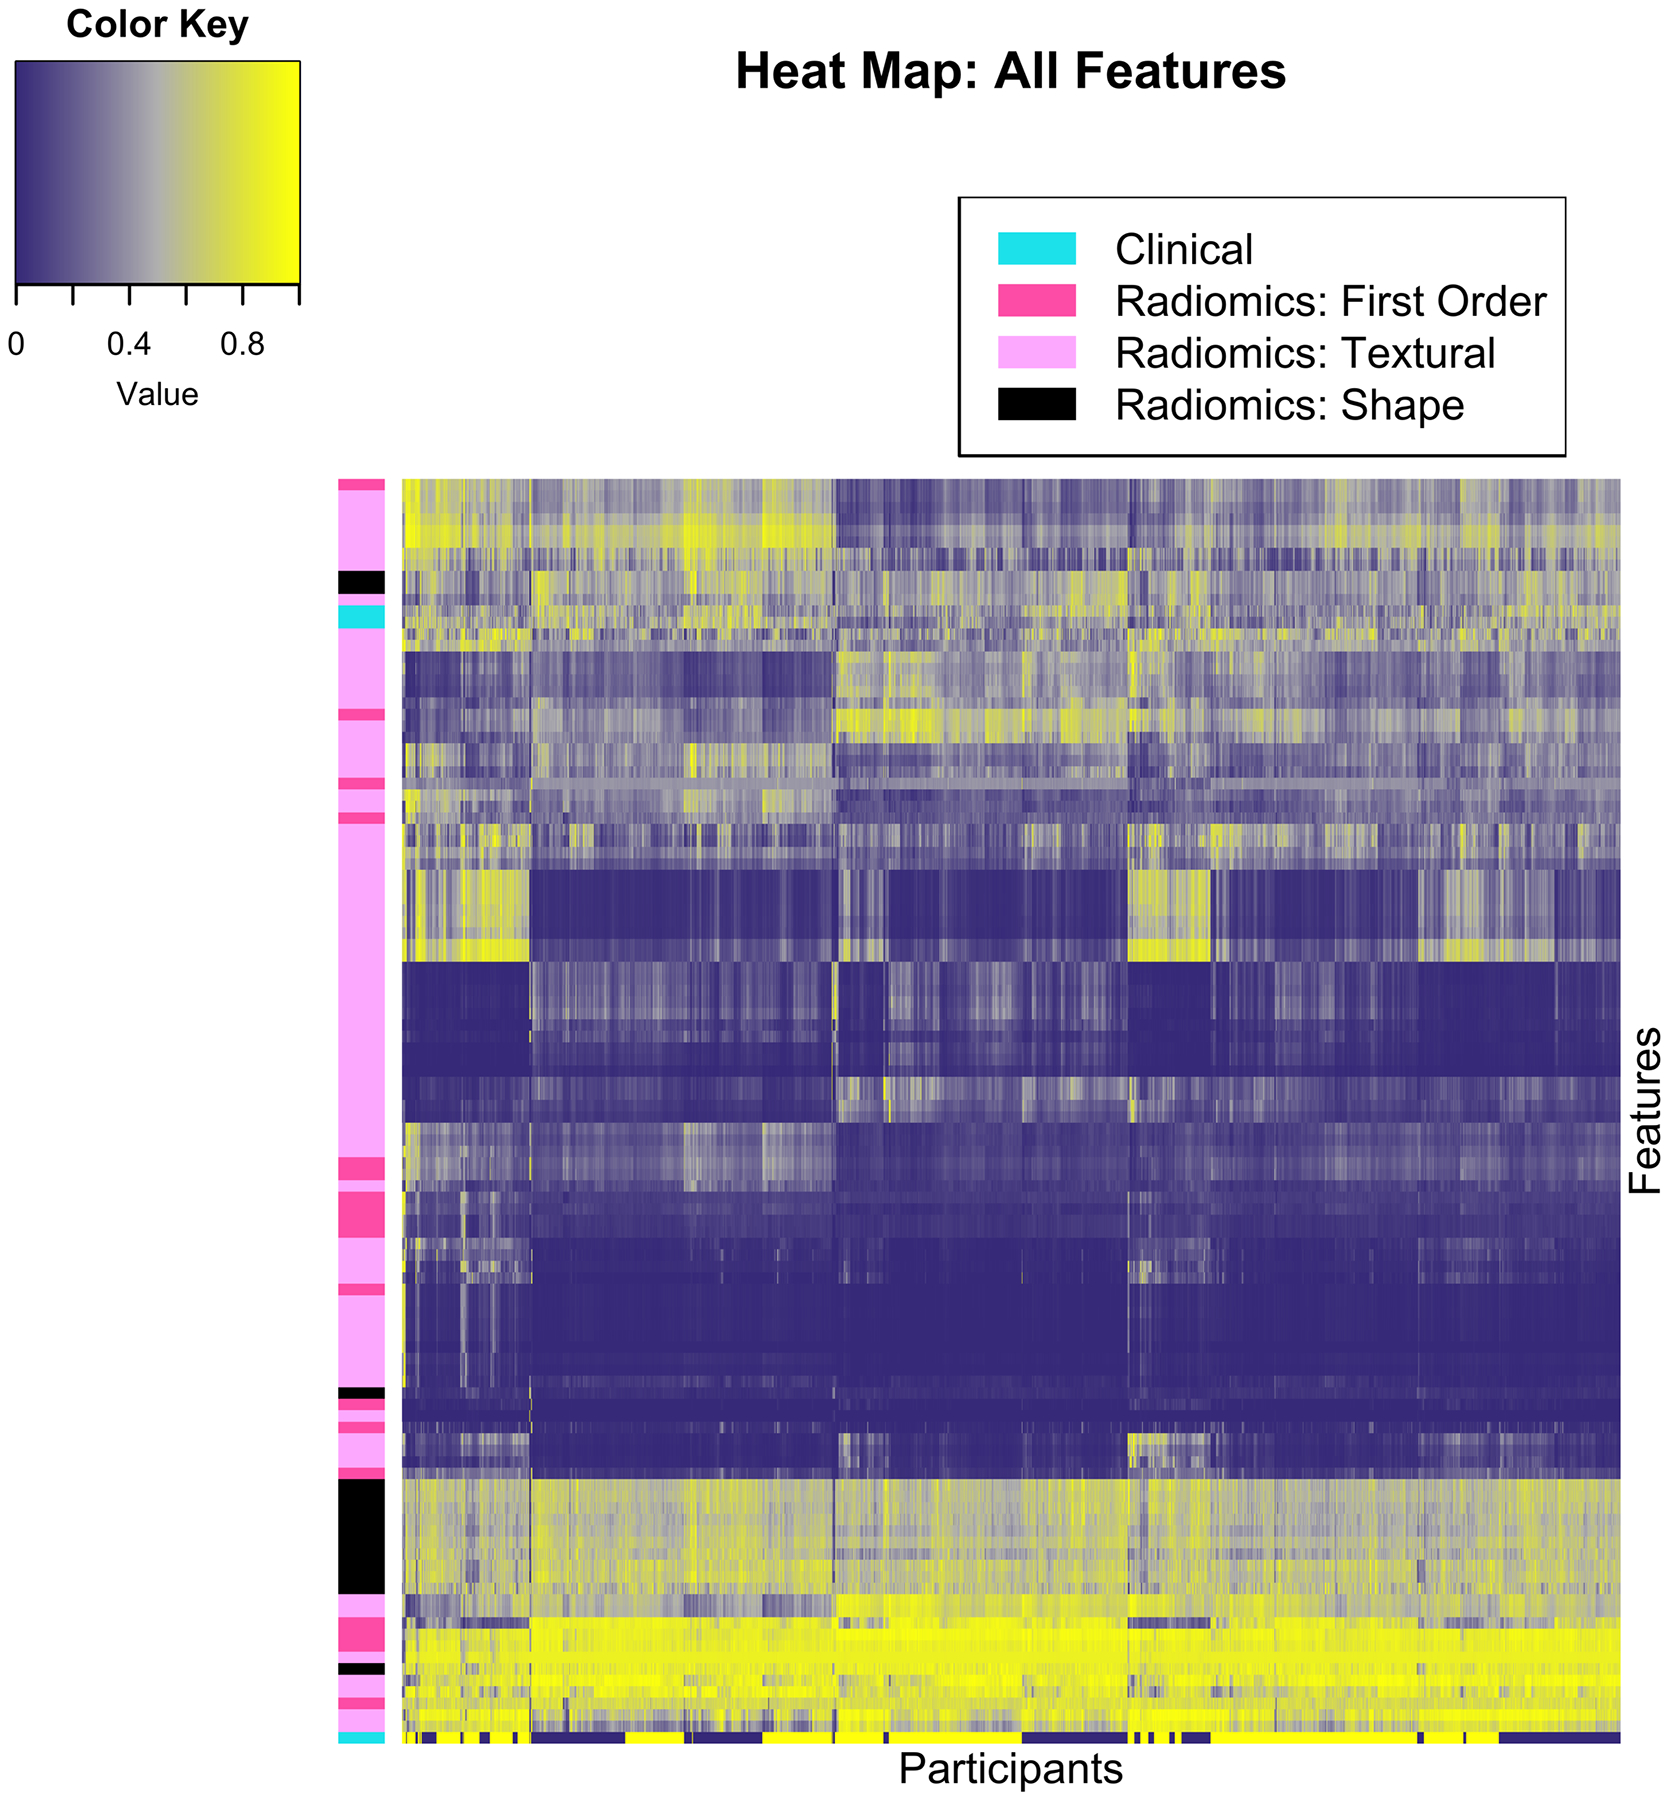
Heat map using unsupervised clustering, participants in the horizontal axis (n = 1,982) and features along the vertical axis (n = 110). Normalized values are color-coded between zero and one, as shown by the color key. Features are grouped by color along the first left column, according to the classes detailed in the top left legend.
In the “cluster-based” analysis, a partition of the dependent variables into 32 clusters (Supporting Table 1) was deemed to provide balance between dimensionality and stability (Supporting Figure 3). The logistic regression coefficients using the 32 “synthetic” variables is shown in Supporting Table 2.
Seventy-nine out of the 110 total features were eliminated prior to model fitting using the “high correlation” exclusion criteria, resulting in 31 variables used in the logistic regression without highly correlated features model architecture. These coefficients, as well as those obtained after LASSO fitting to the training set, are shown in Supporting Table 3. The best lambda on the cross-validation procedure that optimized the LASSO model performance was 0.0025 (i.e., optimal LASSO model) and the lambda yielding the simplest model within one standard error of the optimal LASSO accuracy was 0.012 (i.e., simplest LASSO model). Testing the four models against the validation set resulted in areas under the curve of 0.74 (CI 95%: 0.67 – 0.82), 0.74 (CI 95%: 0.67 – 0.81), 0.76 (CI 95%: 0.69 – 0.83), and 0.73 (CI 95%: 0.66 – 0.80) for the cluster-based LR model, the LR model without highly correlated features, optimal LASSO, and simplest LASSO models, respectively (Figure 4) (Bonferroni-corrected p-value: 0.99, all comparisons, Supporting Table 4). Table 2 shows the sensitivity, specificity, negative and positive predictive value using the best discriminator thresholds in each of the ROC curves.
Figure 4.
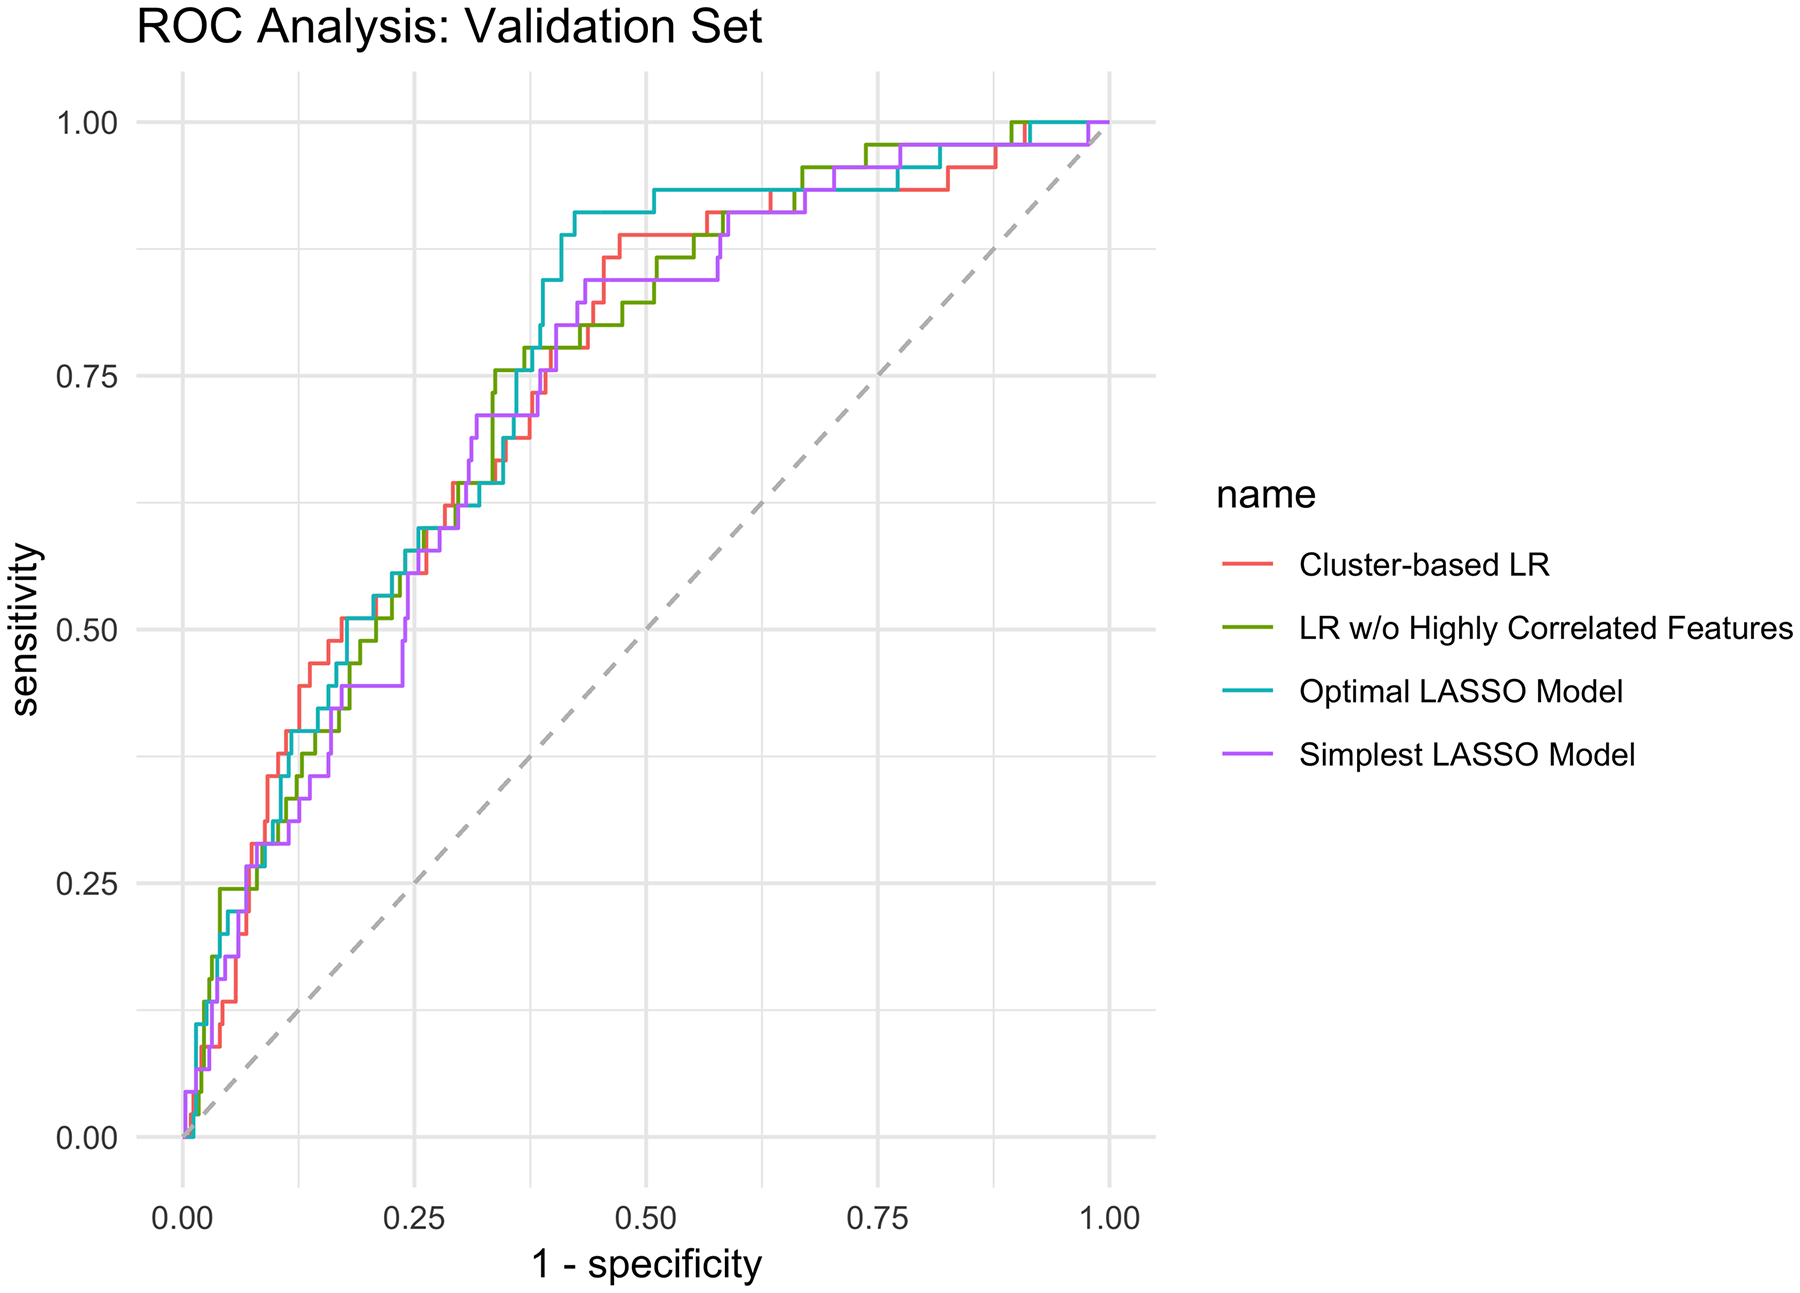
Receiver operating characteristic curve analysis of the predictive models against the validation set. LASSO, least absolute shrinkage and selection operator
Table 2.
Performance profile for predicting high-risk left ventricular hypertrophy (LVH). Cluster-based logistic regression (LR), LR without (w/o) highly correlated (HC) features, optimal and simplest least absolute shrinkage and selection operator (LASSO) models; average and 95% confidence intervals (within parentheses). The high-risk LVH prevalence in the validation set was 11%. AUC, area under the receiver operating characteristics curve; NPV, negative predictive value; PPV, positive predictive value
| Cluster-Based LR | LR w/o HC Features | Optimal LASSO | Simplest LASSO | |
|---|---|---|---|---|
| AUC | 0.74 (0.67 – 0.82) | 0.74 (0.67 – 0.81) | 0.76 (0.69 – 0.83) | 0.73 (0.66 – 0.80) |
| Sensitivity | 75.6% (60.0% – 91.1%) | 75.6% (64.4% – 86.7%) | 84.4% (66.6% – 95.6%) | 75.6% (62.2% – 88.9%) |
| Specificity | 65.7% (79.8% – 82.3%) | 66.6% (60.6% – 77.1%) | 62.0% (55.1% – 79.4%) | 67.4% (55.4% – 75.1%) |
| False Negatives | 14 (3.5%) | 11 (2.8%) | 7 (1.8%) | 13 (3.3%) |
| True Negatives | 228 (57.5%) | 232 (58.7%) | 214 (54.2%) | 239 (60.5%) |
| False Positives | 122 (30.9%) | 118 (29.9%) | 136 (34.4%) | 111 (28.1%) |
| True Positives | 31 (7.8%) | 34 (8.6%) | 38 (9.6%) | 32 (8.1%) |
| Accuracy | 65.6% (60.7% – 70.3%) | 67.3% (62.5% – 72.0%) | 63.8% (58.8% – 68.5%) | 68.6% (63.8% – 73.2%) |
4). Discussion
In this study, we devised and internally validated an end-to-end pipeline using automated segmentation, radiomic feature extraction, and machine learning to predict high-risk LVH phenotypes in a general population undergoing non-contrast CAC-CT. Our results support the hypothesis that there is currently underutilized data embedded in CAC-CT, which in turn could be used to opportunistically identify a subset of high-risk individuals.
The interest in Radiomics has bolstered with the growing necessity to minimize variability of interpretation and improve diagnostic accuracy of medical imaging in the era of precision medicine. Briefly, Radiomics consists in the extraction of numerous quantitative features from images, which can be used to detect disease, monitor progression or response to therapy (35). Although this field has been more deeply investigated in oncology, it has only recently been introduced in cardiovascular imaging (36). For instance, Radiomics was shown to identify high-risk coronary plaque features, potentially outperforming conventional methods (37, 38). In parallel, Radiomics applied to T1 mapping of the myocardium was also proven to be a promising technique for differentiating hypertensive cardiomyopathy from hypertrophic cardiomyopathy on CMR (39).
Left ventricular size consistently predicts cardiovascular mortality across diverse established diagnostic modalities, including electrocardiogram and echocardiogram (40–43). More recently, quantitative assessment of the left ventricular end-diastolic volume and mass using cardiac MR (29) identified subgroups with increased risk for heart failure or cardiac death in the DHS (8). However, such findings are not directly translatable, as cardiac MR is not generally indicated as a screening tool for cardiovascular risk assessment in the asymptomatic population.
In contrast, CAC-CT is an established tool used to screen asymptomatic persons with intermediate (5% to 20%) atherosclerotic cardiovascular disease risk (44, 45). Although the CAC score has been the main parameter extracted from CAC-CT, prior evidence had already showed the potential for prediction of left ventricular volume based on CT measurements (46). In another study, Nasir et al. tested the correlation of an area-based manual segmentation method on CAC-CT against cardiac MR-derived estimates of LV volume and LV mass in a large cohort of asymptomatic individuals; the authors found respective correlation coefficients of 0.73 and 0.74 for each of the cardiac MR parameters (p = 0.01 for both) (18). Furthermore, a subsequent study using the same manually-derived LV size estimates on CAC-CT was shown as a predictor of heart failure in the Multi-Ethnic Study of Atherosclerosis (MESA), independently from classic risk factors of CAC score (47). However, these prior approaches are limited by the potential impact of inter-reader variability of manual segmentation on the interpretations.
Our automated left-ventricular segmentation showed an average overlap of 0.86 when compared with expert manual segmentation of the left ventricle. This performance is comparable with the results of other multi-atlas segmentation algorithms with overlaps ranging from 0.83 to 0.88 depending on processing parameters and segmentation architecture (19). Despite the reasonable overlap between the automatic and manual segmentation, we only found moderate correlation between the CAC-CT calculated LV volume and LVEDV or LVESV obtained on CMR. These results could have been majorly impacted by the inherent acquisition of CAC-CT during the diastasis phase of diastole (i.e., between 65% and 85% of the RR interval). The main average biases of LV size estimated by CAC-CT in comparison with CMR values obtained at end-systole and end-diastole were +38.83 mL and −42.03 mL, respectively. Part of the additional error could be explained by imperfections in the segmentation algorithm, as we did not attempt to exclude outliers from the analysis.
In the last step of our pipeline, we used clustering and feature selection methods to derive four predictive models. We found that the performance of different methods was not significantly different between the models, with AUCs ranging from 0.73 to 0.76. If on one hand our approach could detect high-risk LVH phenotypes with very low false negative rates ranging from 1.8% to 3.5% in the validation cohort, the specificity was low across all models, with values between 62.0% and 67.4%, resulting in false positive rates of up to 34%. Although the results of this feasibility study support our hypothesis that computational methods can uncover underutilized prognostic information from CAC-CT, further technical developments and testing in larger cohorts of patients are still needed for improving the currently modest performance of this pipeline. Moreover, emerging machine learning algorithms, such as Deep Learning, may also aid in the identification of imaging features that are beyond human interpretation. For instance, in an interesting study, Lu et al. (48) developed a deep-learning-based risk score in a large set of chest radiographs (n = 41,856), which was capable of predicting all-cause mortality within the follow-up timeframe independently from known clinical risk factors and findings detected by radiologists on the radiographs. More specifically, the very high-risk group identified by the deep learning algorithm in the “Prostate, Lung, Colorectal, and Ovarian Cancer Screening Trial” and “National Lung Screening Trial” validation subsets had adjusted hazard ratios for cardiovascular death of 3.6 (95% confidence interval: 2.1–6.2] and 47.8 (95% confidence interval: 6.1–374.9), respectively (48).
These results pave the way for the future clinical implementation of a more comprehensive cardiovascular risk screening tool based on CAC-CT, a relatively inexpensive imaging exam. Based on traditional calcium scoring and LVH phenotyping, such tool could concurrently identify individuals at risk for future events related to both coronary syndromes and heart failure. In addition, given that our approach to LVH phenotyping is based on Python and other open source libraries, such as Simple ITK and Pyradiomics, as well as on non-”black-box” machine learning algorithms, external reproducibility would be facilitated.
One of the advantages of using linear models instead of “black-box” machine learning algorithms, such as deep learning, is the opportunity to understand the individual importance of each feature in the explanatory model in a humanly intelligible manner. Interestingly, first order statistics features such as the mean and median pixel value, as well as shape-based features, such as elongation, flatness, major axis length, maximum 2D diameter column and surface-volume ratio were the some of the features displaying statistical significance in the LR model without highly correlated features, which is aligned with observations of prior studies focusing on manually-extracted shape-based features to assess LV size on CAC-CT (18, 47). Understanding the importance of these features in our validation study pave the way for further refinements in methodology, which, in turn, could also improve future results.
We have shown that a completely automated machine learning based pipeline can be used to opportunistically screen for high-risk LVH in an asymptomatic population undergoing CAC-CT. Opportunistic imaging screening is an emerging concept consisting on the acquisition of clinically useful information without the need for additional imaging. For example, Pickhardt et al. (49) showed that osteoporosis could be opportunistically diagnosed based on measurements of the bone attenuation at L1 in individuals undergoing abdominal CT for other reasons. Most importantly, such approach can be even applied in a retrospective fashion across existing imaging archives. Our pipeline is scalable and could potentially identify individuals at risk for cardiovascular death using the currently underutilized data with a low-cost strategy and with no need for additional radiation exposure.
Our study has some limitations. First, we did not test the model against an external cohort, which would be desirable to determine the potential for clinical translation of such technique. Second, we have chosen a stepwise “non-black-box” approach to better understand the driving features related to the LVH phenotype prediction. There is an increasing number of available artificial intelligence approaches that could be alternatively used for this problem, and it is plausible that other approaches (e.g., Deep Learning) could have even outperformed our algorithm. Last, given the relative low number of patients with high-risk LVH in comparison with the whole cohort, which limits statistical power, we did not attempt to address the potential effect of confounding clinical variables, such as ethnicity. Further studies expanding the number and diversity of the population undergoing CAC-CT would be necessary to address these effects.
5). Conclusions
Machine learning can be used to leverage the prognostic capabilities of CAC-CT by uncovering underutilized data about LV phenotype. Our approach is scalable, reproducible, and easily translatable, and could potentially be used prospectively or retrospectively for opportunistic cardiovascular screening. External validation and testing in larger cohorts of patients are still needed for further refinement and confirmation of the applicability of this technique as a clinical tool.
Supplementary Material
Clinical Perspective:
Automatic extraction of quantitative data from calcium scoring computed tomography (CAC-CT) can identify individuals with left ventricular hypertrophy phenotypes associated with risk for future heart failure or death, providing a window of opportunity for treatment and prevention. The potential advantages of this tool include consistency, scalability, and low cost. Ultimately, this tool could further leverage the already established value of CAC-CT in cardiovascular risk screening.
9). Acknowledgements
The authors would like to acknowledge the support from Keith Hulsey, Ph.D. and Mereeja Varghese with database management, as well as from Yin Xi, Ph.D. with statistical consultancy.
8) Sources of Funding
Research reported in this publication was supported by the Donald W. Reynolds Foundation and the National Center for Advancing Translational Sciences of the National Institutes of Health” under award Number UL1TR001105. The content is solely the responsibility of the authors and does not necessarily represent the official views of the NIH.”
Footnotes
Supporting Materials
Submitted in a separate file per editorial request.
Disclosures
None.
10) References
- 1.Budoff MJ, Achenbach S, Blumenthal RS, Carr JJ, Goldin JG, Greenland P, Guerci AD, Lima JA, Rader DJ, Rubin GD, et al. Assessment of coronary artery disease by cardiac computed tomography: a scientific statement from the American Heart Association Committee on Cardiovascular Imaging and Intervention, Council on Cardiovascular Radiology and Intervention, and Committee on Cardiac Imaging, Council on Clinical Cardiology. Circulation. 2006;114:1761–1791. [DOI] [PubMed] [Google Scholar]
- 2.Hou ZH, Lu B, Gao Y, Jiang SL, Wang Y, Li W, Budoff MJ. Prognostic value of coronary CT angiography and calcium score for major adverse cardiac events in outpatients. JACC Cardiovasc Imaging. 2012;5:990–999. [DOI] [PubMed] [Google Scholar]
- 3.Budoff MJ, Mayrhofer T, Ferencik M, Bittner D, Lee KL, Lu MT, Coles A, Jang J, Krishnam M, Douglas PS, et al. Prognostic Value of Coronary Artery Calcium in the PROMISE Study (Prospective Multicenter Imaging Study for Evaluation of Chest Pain). Circulation. 2017;136:1993–2005. [DOI] [PMC free article] [PubMed] [Google Scholar]
- 4.Pelc NJ. Recent and future directions in CT imaging. Ann Biomed Eng. 2014;42:260–268. [DOI] [PMC free article] [PubMed] [Google Scholar]
- 5.Agatston AS, Janowitz WR, Hildner FJ, Zusmer NR, Viamonte M, Jr., Detrano R. Quantification of coronary artery calcium using ultrafast computed tomography. J Am Coll Cardiol. 1990;15:827–832. [DOI] [PubMed] [Google Scholar]
- 6.Bluemke DA, Kronmal RA, Lima JA, Liu K, Olson J, Burke GL, Folsom AR. The relationship of left ventricular mass and geometry to incident cardiovascular events: the MESA (Multi-Ethnic Study of Atherosclerosis) study. J Am Coll Cardiol. 2008;52:2148–2155. [DOI] [PMC free article] [PubMed] [Google Scholar]
- 7.Drazner MH, Rame JE, Marino EK, Gottdiener JS, Kitzman DW, Gardin JM, Manolio TA, Dries DL, Siscovick DS. Increased left ventricular mass is a risk factor for the development of a depressed left ventricular ejection fraction within five years: the Cardiovascular Health Study. J Am Coll Cardiol. 2004;43:2207–15. [DOI] [PubMed] [Google Scholar]
- 8.Garg S, de Lemos JA, Ayers C, Khouri MG, Pandey A, Berry JD, Peshock RM, Drazner MH. Association of a 4-Tiered Classification of LV Hypertrophy With Adverse CV Outcomes in the General Population. JACC Cardiovasc Imaging. 2015;8:1034–1041. [DOI] [PMC free article] [PubMed] [Google Scholar]
- 9.Zile MR, Gaasch WH, Patel K, Aban IB, Ahmed A. Adverse left ventricular remodeling in community-dwelling older adults predicts incident heart failure and mortality. JACC Heart Fail. 2014;2:512–522. [DOI] [PubMed] [Google Scholar]
- 10.Pandey A, Keshvani N, Ayers C, Correa A, Drazner MH, Lewis A, Rodriguez CJ, Hall ME, Fox ER, Mentz RJ, et al. Association of Cardiac Injury and Malignant Left Ventricular Hypertrophy With Risk of Heart Failure in African Americans: The Jackson Heart Study. JAMA Cardiol. 2019;4:51–58. [DOI] [PMC free article] [PubMed] [Google Scholar]
- 11.Aerts HJ, Velazquez ER, Leijenaar RT, Parmar C, Grossmann P, Carvalho S, Bussink J, Monshouwer R, Haibe-Kains B, Rietveld D, et al. Decoding tumour phenotype by noninvasive imaging using a quantitative radiomics approach. Nat Commun. 2014;5:4006. [DOI] [PMC free article] [PubMed] [Google Scholar]
- 12.Erickson BJ, Korfiatis P, Akkus Z, Kline TL. Machine Learning for Medical Imaging. Radiographics. 2017;37:505–515. [DOI] [PMC free article] [PubMed] [Google Scholar]
- 13.Giger ML. Machine Learning in Medical Imaging. J Am Coll Radiol. 2018;15:512–520. [DOI] [PubMed] [Google Scholar]
- 14.Victor RG, Haley RW, Willett DL, Peshock RM, Vaeth PC, Leonard D, Basit M, Cooper RS, Iannacchione VG, Visscher WA, et al. The Dallas Heart Study: a population-based probability sample for the multidisciplinary study of ethnic differences in cardiovascular health. Am J Cardiol. 2004;93:1473–1480. [DOI] [PubMed] [Google Scholar]
- 15.Paixao ARM, Neeland IJ, Ayers CR, Xing F, Berry JD, de Lemos JA, Abbara S, Peshock RM, Khera A. Defining coronary artery calcium concordance and repeatability - Implications for development and change: The Dallas Heart Study. J Cardiovasc Comput Tomogr. 2017;11:347–353. [DOI] [PubMed] [Google Scholar]
- 16.Garg S, de Lemos JA, Matulevicius SA, Ayers C, Pandey A, Neeland IJ, Berry JD, McColl R, Maroules C, Peshock RM, et al. Association of Concentric Left Ventricular Hypertrophy With Subsequent Change in Left Ventricular End-Diastolic Volume: The Dallas Heart Study. Circ Heart Fail. 2017;10: e003959. [DOI] [PubMed] [Google Scholar]
- 17.Fedorov A, Beichel R, Kalpathy-Cramer J, Finet J, Fillion-Robin JC, Pujol S, Bauer C, Jennings D, Fennessy F, Sonka M, et al. 3D Slicer as an image computing platform for the Quantitative Imaging Network. Magn Reson Imaging. 2012;30:1323–1341. [DOI] [PMC free article] [PubMed] [Google Scholar]
- 18.Nasir K, Katz R, Mao S, Takasu J, Bomma C, Lima JA, Bluemke DA, Kronmal R, Carr JJ, Budoff MJ. Comparison of left ventricular size by computed tomography with magnetic resonance imaging measures of left ventricle mass and volumes: the multi-ethnic study of atherosclerosis. J Cardiovasc Comput Tomogr. 2008;2:141–148. [DOI] [PubMed] [Google Scholar]
- 19.van Rikxoort EM, Isgum I, Arzhaeva Y, Staring M, Klein S, Viergever MA, Pluim JP, van Ginneken B. Adaptive local multi-atlas segmentation: application to the heart and the caudate nucleus. Med Image Anal. 2010;14:39–49. [DOI] [PubMed] [Google Scholar]
- 20.Python Software Foundation. Python: A dynamic, open source programming language 2015. [Available from: https://www.python.org. Access date: 06/29/2019]
- 21.Yaniv Z, Lowekamp BC, Johnson HJ, Beare R. SimpleITK Image-Analysis Notebooks: a Collaborative Environment for Education and Reproducible Research. J Digit Imaging. 2018;31:290–303. [DOI] [PMC free article] [PubMed] [Google Scholar]
- 22.Thirion JP. Image matching as a diffusion process: an analogy with Maxwell’s demons. Med Image Anal. 1998;2:243–260. [DOI] [PubMed] [Google Scholar]
- 23.Taha AA, Hanbury A. Metrics for evaluating 3D medical image segmentation: analysis, selection, and tool. BMC Med Imaging. 2015;15:29. [DOI] [PMC free article] [PubMed] [Google Scholar]
- 24.van Griethuysen JJM, Fedorov A, Parmar C, Hosny A, Aucoin N, Narayan V, Beets-Tan RGH, Fillion-Robin JC, Pieper S, Aerts HJWL. Computational Radiomics System to Decode the Radiographic Phenotype. Cancer Res. 2017;77:e104–e7. [DOI] [PMC free article] [PubMed] [Google Scholar]
- 25.Pyradiomics Community. Pyradiomics Documentation: Radiomic Features 2016. [Available from: https://pyradiomics.readthedocs.io/en/latest/features.html#radiomics-features-label. Access date: 06/29/2019]
- 26.Schulz-Menger J, Bluemke DA, Bremerich J, Flamm SD, Fogel MA, Friedrich MG, Kim RJ, von Knobelsdorff-Brenkenhoff F, Kramer CM, Pennell DJ, et al. Standardized image interpretation and post processing in cardiovascular magnetic resonance: Society for Cardiovascular Magnetic Resonance (SCMR) board of trustees task force on standardized post processing. J Cardiovasc Magn Reson. 2013;15:35. [DOI] [PMC free article] [PubMed] [Google Scholar]
- 27.Ostrzega E, Maddahi J, Honma H, Crues JV 3rd, Resser KJ, Charuzi Y, Berman DS. Quantification of left ventricular myocardial mass in humans by nuclear magnetic resonance imaging. Am Heart J. 1989;117:444–452. [DOI] [PubMed] [Google Scholar]
- 28.Alame AJ, Garg S, Kozlitina J, Ayers C, Peshock RM, Matulevicius SA, Drazner MH. Association of African Ancestry With Electrocardiographic Voltage and Concentric Left Ventricular Hypertrophy: The Dallas Heart Study. JAMA Cardiol. 2018;3:1167–1173. [DOI] [PMC free article] [PubMed] [Google Scholar]
- 29.Khouri MG, Peshock RM, Ayers CR, de Lemos JA, Drazner MH. A 4-tiered classification of left ventricular hypertrophy based on left ventricular geometry: the Dallas heart study. Circ Cardiovasc Imaging. 2010;3:164–171. [DOI] [PubMed] [Google Scholar]
- 30.Kuhn M. Building Predictive Models in R Using the caret Package. J Stat Softw. 2008;28:1–26.27774042 [Google Scholar]
- 31.Chavent M, Kuentz-Simonet V, Liquet B, Saracco J. ClustOfVar: An R Package for the Clustering of Variables. J Stat Softw. 2012;50:1–16.25317082 [Google Scholar]
- 32.Friedman J, Hastie T, Tibshirani R. Regularization Paths for Generalized Linear Models via Coordinate Descent. J Stat Softw. 2010;33:1–22. [PMC free article] [PubMed] [Google Scholar]
- 33.Bland JM, Altman DG. Statistical methods for assessing agreement between two methods of clinical measurement. Lancet. 1986;1:307–10. [PubMed] [Google Scholar]
- 34.Robin X, Turck N, Hainard A, Tiberti N, Lisacek F, Sanchez JC, Muller M. pROC: an open-source package for R and S+ to analyze and compare ROC curves. BMC Bioinformatics. 2011;12:77. [DOI] [PMC free article] [PubMed] [Google Scholar]
- 35.Gillies RJ, Kinahan PE, Hricak H. Radiomics: Images Are More than Pictures, They Are Data. Radiology. 2016;278:563–577. [DOI] [PMC free article] [PubMed] [Google Scholar]
- 36.Kolossvary M, Kellermayer M, Merkely B, Maurovich-Horvat P. Cardiac Computed Tomography Radiomics: A Comprehensive Review on Radiomic Techniques. J Thorac Imaging. 2018;33:26–34. [DOI] [PubMed] [Google Scholar]
- 37.Kolossvary M, Karady J, Szilveszter B, Kitslaar P, Hoffmann U, Merkely B, Maurovich-Horvat P. Radiomic Features Are Superior to Conventional Quantitative Computed Tomographic Metrics to Identify Coronary Plaques With Napkin-Ring Sign. Circ Cardiovasc Imaging. 2017;10:e006843. [DOI] [PMC free article] [PubMed] [Google Scholar]
- 38.Kolossvary M, Park J, Bang JI, Zhang J, Lee JM, Paeng JC, Merkely B, Narula J, Kubo T, Akasaka T, et al. Identification of invasive and radionuclide imaging markers of coronary plaque vulnerability using radiomic analysis of coronary computed tomography angiography. Eur Heart J Cardiovasc Imaging. 2019;20:1250–1258. [DOI] [PMC free article] [PubMed] [Google Scholar]
- 39.Neisius U, El-Rewaidy H, Nakamori S, Rodriguez J, Manning WJ, Nezafat R. Radiomic Analysis of Myocardial Native T1 Imaging Discriminates Between Hypertensive Heart Disease and Hypertrophic Cardiomyopathy. JACC Cardiovasc Imaging. 2019;12:1946–1954. [DOI] [PMC free article] [PubMed] [Google Scholar]
- 40.Kannel WB, Gordon T, Offutt D. Left ventricular hypertrophy by electrocardiogram. Prevalence, incidence, and mortality in the Framingham study. Ann Intern Med. 1969;71:89–105. [DOI] [PubMed] [Google Scholar]
- 41.Levy D, Garrison RJ, Savage DD, Kannel WB, Castelli WP. Prognostic implications of echocardiographically determined left ventricular mass in the Framingham Heart Study. N Engl J Med. 1990;322:1561–1566. [DOI] [PubMed] [Google Scholar]
- 42.Lee TH, Hamilton MA, Stevenson LW, Moriguchi JD, Fonarow GC, Child JS, Laks H, Walden JA. Impact of left ventricular cavity size on survival in advanced heart failure. Am J Cardiol. 1993;72:672–676. [DOI] [PubMed] [Google Scholar]
- 43.Abernethy M, Sharpe N, Smith H, Gamble G. Echocardiographic prediction of left ventricular volume after myocardial infarction. J Am Coll Cardiol. 1991;17:1527–32. [DOI] [PubMed] [Google Scholar]
- 44.Greenland P, Blaha MJ, Budoff MJ, Erbel R, Watson KE. Coronary Calcium Score and Cardiovascular Risk. J Am Coll Cardiol. 2018;72:434–47. [DOI] [PMC free article] [PubMed] [Google Scholar]
- 45.Arnett DK, Blumenthal RS, Albert MA, Buroker AB, Goldberger ZD, Hahn EJ, Himmelfarb CD, Khera A, Lloyd-Jones D, McEvoy JW, et al. 2019 ACC/AHA Guideline on the Primary Prevention of Cardiovascular Disease. Circulation. 2019;140:e563–e595. [DOI] [PMC free article] [PubMed] [Google Scholar]
- 46.Mao S, Budoff MJ, Oudiz RJ, Bakhsheshi H, Wang S, Brundage BH. A simple single slice method for measurement of left and right ventricular enlargement by electron beam tomography. Int J Card Imaging. 2000;16:383–90. [DOI] [PubMed] [Google Scholar]
- 47.Bittencourt MS, Blankstein R, Mao S, Rivera JJ, Bertoni AG, Shaw LJ, Blumenthal RS, Budoff MJ, Nasir K. Left ventricular area on non-contrast cardiac computed tomography as a predictor of incident heart failure - The Multi-Ethnic Study of Atherosclerosis. J Cardiovasc Comput Tomogr. 2016;10:500–506. [DOI] [PMC free article] [PubMed] [Google Scholar]
- 48.Lu MT, Ivanov A, Mayrhofer T, Hosny A, Aerts HJWL, Hoffmann U. Deep Learning to Assess Long-term Mortality From Chest Radiographs. JAMA Netw Open. 2019;2:e197416. [DOI] [PMC free article] [PubMed] [Google Scholar]
- 49.Pickhardt PJ, Pooler BD, Lauder T, del Rio AM, Bruce RJ, Binkley N. Opportunistic screening for osteoporosis using abdominal computed tomography scans obtained for other indications. Ann Intern Med. 2013;158:588–595. doi: 10.7326/0003-4819-158-8-201304160-00003 [DOI] [PMC free article] [PubMed] [Google Scholar]
Associated Data
This section collects any data citations, data availability statements, or supplementary materials included in this article.