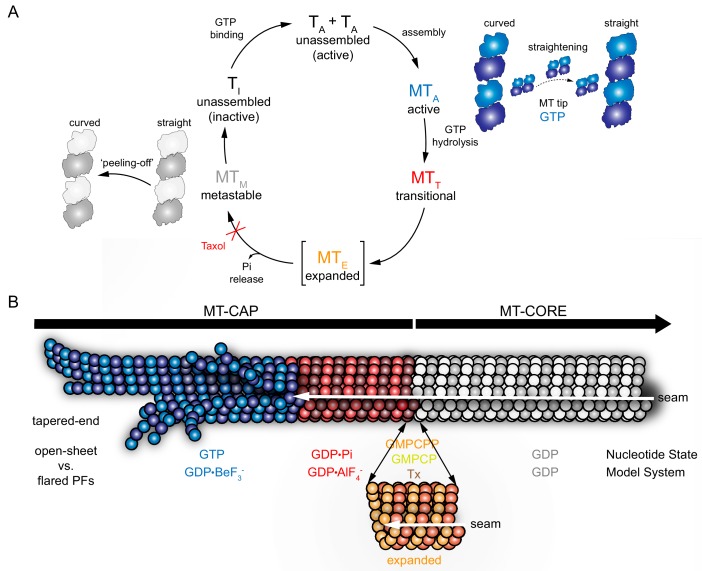
Figure 5. Cap model derived from MT model systems.
GTP-bound state (BeF3-, blue), transition state (AlFx, red), expanded state (GMPCPP, GMPCP, GDP-Tx, orange), and GDP-bound state (gray). (A) Schematic GTPase related conformational changes within the MT lattice. Tubulin activation upon GTP binding (TA) induces polymerization. During assembly (MTA), the formation of lateral contacts favors tubulin straightening, which allows GTP hydrolysis. GTPase activity drives MT through a transitional state (MTT), where the Pi is at the nucleotide-binding site before it is released. Expansion (orange) may be an intermediate transient step between GDP•Pi and GDP states, which may facilitates Pi release (MTE) and would be blocked in the presence of taxol. GDP-MT (MTM) shrinks through a ‘peeling-off’ disassembly in which tubulin reverts to the curved conformation, which is inactive (TI) in the GDP-bound state. (B) MT model illustrating specific lattice features of the GTPase cycle. This mosaic structure shows that: (i) the GTP-bound tip (blue) contains curved PFs/sheets that come together into a straight lattice due to the formation of lateral contacts, (ii) the post-hydrolysis GDP•Pi lattice (red) retains overall MT structure, (iii) hypothetically, lattice undergoes an energy-consuming expansion phase (orange) that contributes to Pi release, and (iv) in the GDP state (gray) subtle changes on the PF skew distinguish the metastable compact lattice or, (v) lattice reverts into its previous lower energy state (compaction), preventing the structure from returning to the cap architecture.

