

Abstract
Glaucoma is a silent progressive eye disease that is among the leading causes of irreversible blindness. Early detection and proper treatment of glaucoma can limit severe vision impairments associated with advanced stages of the disease. Periodic automatic screening can help in the early detection of glaucoma while reducing the workload on expert ophthalmologists. In this work, a wavelet-based glaucoma detection algorithm is proposed for real-time screening systems. A combination of wavelet-based statistical and textural features computed from the detected optic disc region is used to determine whether a retinal image is healthy or glaucomatous. Two public datasets having different resolutions were considered in the performance analysis of the proposed algorithm. An accuracy of 96.7% and area under receiver operating curve (AUC) of 94.7% were achieved for the high-resolution dataset. Analysis of the wavelet-based statistical and textural features using three different methods showed their relevance for glaucoma detection. Furthermore, the proposed algorithm is shown to be suitable for real-time applications as it requires less than 3 s for processing the high-resolution retinal images.
Keywords: Glaucoma, Retinal images, Wavelet transform, Gray-level co-occurrence matrix, Statistical features, Classification
Introduction
According to the World Health Organization, glaucoma is a leading cause of blindness worldwide accounting for over 12% of global blindness [1]. In 2010, it was estimated that 60.5 million people suffered from glaucoma, a figure expected to increase to 80 million by the year 2020 [2]. Generally, glaucoma is more common in elderly individuals with African and Hispanic origins than in Caucasians, specifically those suffering from severe nearsightedness, diabetes, or high blood pressure. Glaucoma causes progressive impairment of the optic nerve responsible for sending image signals from the eye to the brain. At its early stages, glaucoma has absolutely no effect on vision hence usually passes unnoticed by patients. In more advanced stages, glaucoma causes loss of peripheral sight that can progress to irreversible blindness. However, early diagnosis and proper treatment can help control glaucoma progression thus avoiding vision loss.
Periodic eye examination of candidate glaucoma patients is thus essential to facilitate the early detection of the disease. In an eye examination, a patient’s retinal image is captured then manually inspected by an ophthalmologist to determine whether or not glaucoma symptoms are present. Manual analysis of retinal images can be very time consuming [3]. In addition, the images should be inspected by highly trained ophthalmologists in order to assure accuracy of the performed diagnosis [4]. Periodic manual screening would hence cause a huge overload on expert ophthalmologists who would be required to examine a large number of patient images, most of which have no disease symptoms. Automatic screening systems have the potential to overcome these limitations by automatically capturing and processing retinal images, advising only patients with detected glaucoma symptoms to seek medical treatment.
In retinal images, the damage of the optic nerve associated with glaucoma can be depicted in the cupping of the optic disc, which is the increase of the cup size with respect to the optic disc, as well as in the change of its overall characteristics [5]. Automatic methods thus commonly rely on analysis of the optic disc region for glaucoma diagnosis. Generally, there are three types of glaucoma detection algorithms in literature: (1) structural, (2) generic, and (3) hybrid.
Structural glaucoma detection algorithms rely on the segmentation of both the optic disc and cup followed by the computation of structural measures to determine whether or not the disease is present. Common measures for glaucoma detection include the cup-to-disc ratio (CDR) [6–8], inferior superior nasal temporal (ISNT) rule [9], disk damage likelihood scale (DDLS) [10], and glaucoma risk index (GRI) [11], all which are computed using the vertical disc and cup heights [12]. The performance of structural glaucoma detection algorithms is thus highly dependent on the segmentation accuracy of the optic disc and cup from the retinal images. Consequently, the accurate detection of the boundaries of both the disc and cup is essential to ensure the efficiency of these methods [13]. However, in some cases, the cup and disc are hardly distinguishable which would make their accurate segmentation extremely challenging [8, 14]. Moreover, segmentation algorithms can be complex and time consuming making them unsuitable for real-time automatic retinal screening systems.
Generic methods are based on the intuition that the damage of the optic nerve associated with glaucoma affects the overall characteristics of the optic disc region. Generic methods thus rely on a combination of statistical and textural features, computed from either the spatial or wavelet domains of the image. Dua et al. [15] proposed using average wavelet energy computed from the retinal images’ level 1 detail subbands for glaucoma classification. They reported an accuracy of 93% using tenfold cross validation with support machine vector (SVM) classifier for a dataset consisting of 30 normal and 30 glaucomatous images. In another work, Singh et al. [16] calculated the mean and energy of the optic disc region's first wavelet level detail subbands for differentiating between normal and glaucomatous images.For both k nearest neighbor (kNN) and SVM classifiers, an accuracy of 94.7% was achieved using a 63-image dataset, where 70% of the data was used for training and the rest for testing. In their work, Singh et al. concluded that wavelet features extracted from the optic disc region were more clinically significant than features computed from the whole retinal image. They also showed that their method gave higher results than several other approaches from literature. Dey et al. [17] implemented a glaucoma detection algorithm using spatial textural features calculated from the gray-level run and co-occurrence matrices. An overall accuracy of 94% was achieved using tenfold cross-validated SVM classifier tested with a private dataset.
Hybrid approaches combine both structural measures, requiring optic disc and cup segmentation, along with generic textural and statistical features for glaucoma detection. Hybrid methods hence share the limitation of the structural glaucoma detection methods in that they can be prone to segmentation errors as well as being computationally expensive. Akram et al. [18] integrate spatial and spectral features along with cup-to-disc and rim-to-disc ratios for glaucoma detection. Their method resulted in accuracies between 85 and 95% for several public and private datasets. Vijapur et al. [19] implemented several structural measures along with wavelet energy features for glaucoma classification. The best performance was achieved by combining both the structural and wavelet features resulting in an accuracy of 86.7% using the SVM classifier on a public dataset consisting of 30 retinal images. Khalil et al. [20] used a combination of textural and intensity features along with several structural features calculated from the segmented optic disc and cup in order to classify glaucomatous retinal images. Their algorithm resulted in accuracies of 94% and 83% for the textural and structural features, respectively, using a tenfold cross-validated SVM classifier. These results show the superiority of textural over structural features for glaucoma classification.
Generic glaucoma detection algorithms thus have the potential to overcome the limitations of structural methods by being computationally inexpensive while giving reliable results. In literature, generic features were most commonly computed from the images’ spatial domain. Few researches have also computed generic features from the wavelet decomposition of the retinal images. However, wavelet-based generic glaucoma detection algorithms introduced in literature mainly relied on only a limited number of statistical features such as the mean and energy [15, 16].
In this work, a novel wavelet-based generic glaucoma detection algorithm is proposed that relies on a combination of both textural and statistical features. Wavelet transform is a multiresolution technique that has the advantage of being localized in both time and frequency [21]. Wavelet decomposition separates an image’s edge and luminance information in its detail and approximation subbands, respectively. Detail subbands mainly include information related to the retinal vessels which are of low relevance to glaucoma detection. On the other hand, approximation subbands include the image’s illumination and textural information. Consequently, only the retinal images’ approximation subbands were considered in the proposed algorithm. Initially, the optic disc region was detected from the image’s red channel approximation subband. Next, several statistical and textural features were computed from the detected optic disc region’s green and blue approximation subbands. Feature selection was then employed to find the most relevant features and the reduced feature set was used to classify two publicly available retinal image datasets of different resolutions into healthy or glaucomatous. Finally, perfromance and timing analysis along with comparisons to other methods were perfromed demonstrating the superiority of the proposed glaucoma detection algorithm.
Materials
In this work, balanced subsets of two publicly available retinal image datasets were used to evaluate the performance of the proposed method.
GlaucomaDB [20]: includes 33 healthy and 33 glaucomatous images taken with a TopCon TRC 50EX camera originally having a resolution of 1504 × 1000 pixels. However, images publicly provided within this dataset only include the optic disc and a small surrounding region. The cropped image sizes vary slightly among them but are generally less than 200 × 200 pixels.
High-resolution fundus (HRF) image database [22, 23]: consists of 15 healthy and 15 glaucomatous retinal images captured using a Canon CR-1 fundus camera at a resolution of 3504 × 2336 pixels. All images within the HRF dataset were taken at a 45o field of view (Fig. 1a). In order to increase the processing speed of the proposed algorithm, the HRF images were initially cropped to separate only the part including the optic disc and surrounding region. Images were cropped by first excluding the black image edges. Next, the retinal image was divided into three rows and three columns and only the block containing the optic disc was considered for further processing. The considered region thus had a resolution of 870 × 780 pixels (Fig. 1b).
Fig. 1.

Retinal image from the HRF dataset a before and b after cropping
Methods
Glaucoma is associated with the damage of the optic disc resulting in the change of its overall characteristics within the retinal image [5]. Optic discs are generally characterized by their bright yellowish appearance as opposed to the reddish-orange retinal image. Figure 2 shows an example of the red, green, and blue channels of a cropped retinal image from the HRF dataset. The optic disc is seen to be most distinguishable in the retinal image’s red channel. However, the green and blue channels demonstrate a larger contrast between the disc and cup. Consequently, in this work, the red channel was used for optic detection whereas the green and blue channels were used for the feature extraction. The proposed wavelet generic glaucoma detection algorithm is summarized in Fig. 3 and its details are given within this section.
Fig. 2.

The a red, b green, and c blue channels of the optic disc region (for an image from the HRF dataset)
Fig. 3.
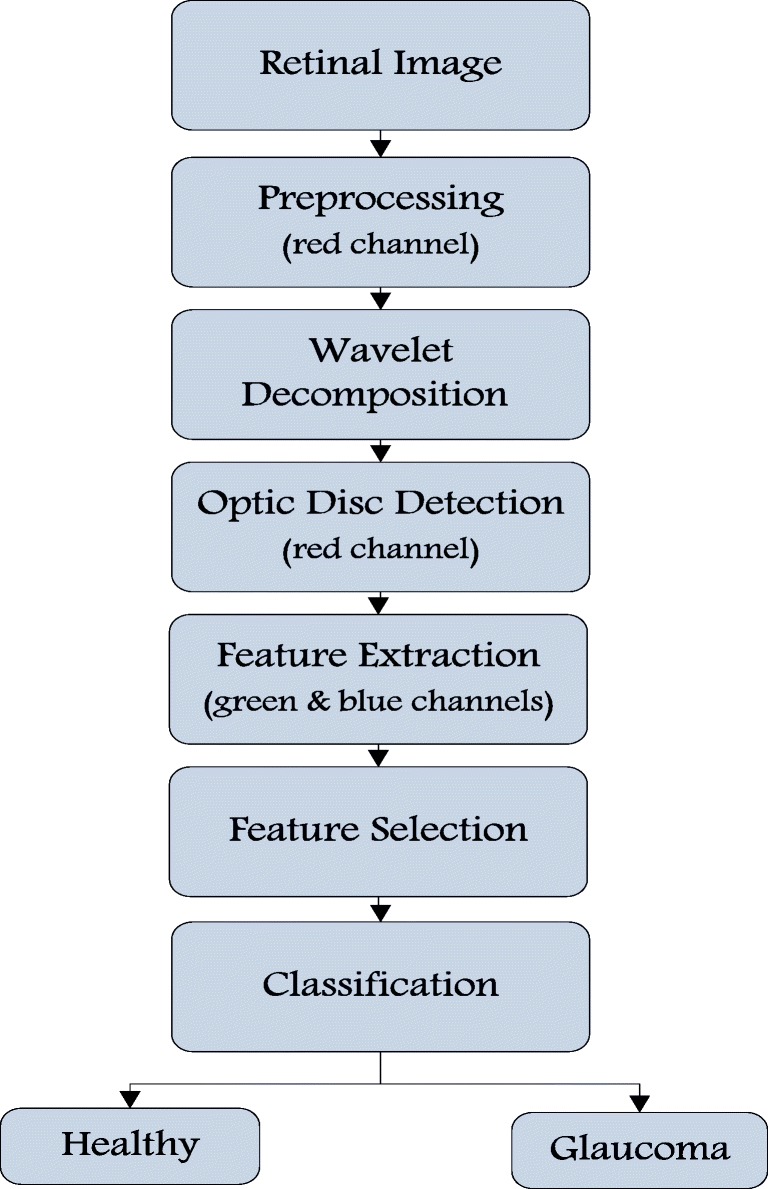
Flowchart of the proposed glaucoma detection algorithm
Preprocessing
Several enhancement techniques were implemented to make the red channel more suitable for optic disc detection. Initially, the illumination of the red channel was normalized by subtracting its mean from all the channel pixels. Next, unsharp masking [24] and contrast-limited adaptive histogram equalization (CLAHE) [25] were performed in order to increase the overall contrast of the red channel hence enhancing the appearance of the optic disc with respect to the image background (Fig. 4c).
Fig. 4.

a Cropped retinal color image from the HRF dataset. b Cropped image’s red channel. c Preprocessed red channel. d Approximation subband of the preprocessed red channel. e Clean optic disc mask created by thresholding of the preprocessed red channel. f Detected optic disc identified on the green approximation subband
Wavelet Decomposition
Wavelet transform is a multiresolution technique that can separate the edge and illumination information of an image in its detail and approximation subbands, respectively. Wavelet detail subbands contain information conveying the sharpness of the retinal structures whereas the wavelet approximation subbands mainly include the luminance information of the structures [26]. In this work, we are interested in the illumination characteristics of the optic disc in order to determine whether the inspected retinal image is healthy or glaucomatous. Accordingly, retinal images were decomposed using Daubechies4 wavelet and only the approximation channel subbands were considered in all subsequent processing. Specifically, the second and fourth wavelet subbands were considered for the GlaucomaDB and cropped HRF images, respectively, in order to account for the size difference between the two datasets [27]. Accordingly, the resolution of the final processed images for both datasets was ~ 55 × 60 pixels.
Optic Disc Detection
Initially, image thresholding of the preprocessed red channel’s approximation subband was performed to generate a binary image including the highest intensity pixels within the retinal image. The threshold was chosen to be the nth quantile of the approximation subband where n is dependent on image size, taken as 80 and 90 for the GlaucomaDB and HRF datasets, respectively. Next, the binary image was cleaned by removing regions whose area was less than 6% of the total image size representing high-intensity pixels within the background of the retinal image that are not part of the optic disc. The cleaned binary image hence only includes the optic disc mask (Fig. 4e). Finally, the BoundingBox function in MATLAB [28] was used to identify the center, radius, and rectangular borders of the optic disc from the cleaned binary image (Fig. 4f). The rectangular borders of the detected optic disc were then employed to crop the optic disc from both the green and blue approximation subbands to be used for feature extraction (Fig. 5). In this work, the approximation subbands were normalized prior to feature computation in order to account for the luminance variations within different retinal images [29].
Fig. 5.
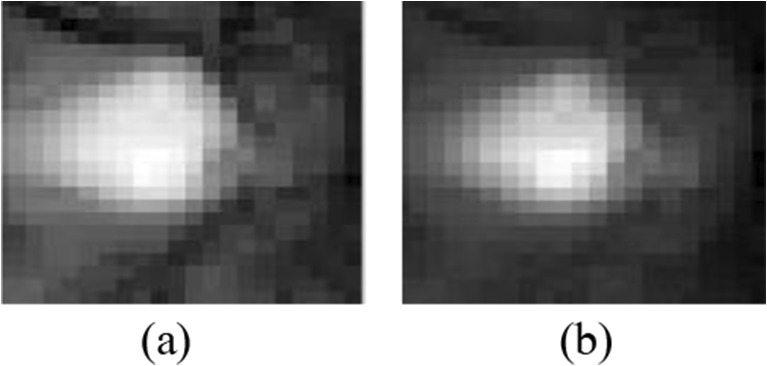
Final cropped optic disc region in the a green and b blue approximation subbands
Features Extraction
A healthy optic disc is typically orange to pink in appearance becoming paler in color for glaucomatous retinas whereas the optic cup, located in the center of the optic disc, is relatively brighter and more yellowish [12]. Generally, glaucomatous images are characterized by enlarged cup size with respect to the optic disc. Figure 6 shows examples of normal and glaucomatous images demonstrating the difference in size and color between healthy and abnormal optic discs.
Fig. 6.
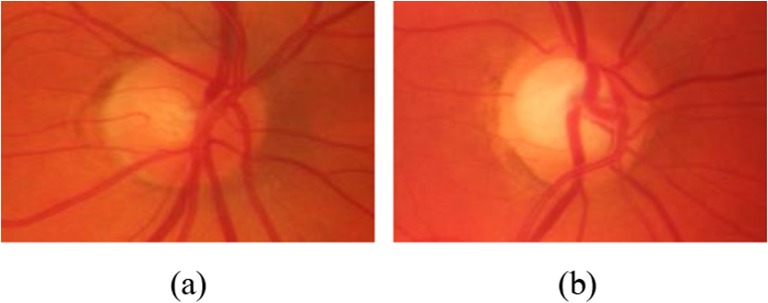
Examples of a healthy and b glaucomatous optic discs from the HRF dataset
In this work, a combination of wavelet-based textural and statistical features was computed from the green and blue normalized approximation subbands of the detected optic disc region (Fig. 5) in order to thoroughly characterize the optic disc for glaucoma classification. Feature selection was then used to remove the insignificant features in order to improve the overall classification performance.
Textural Features
Texture features are widely implemented in medical image analysis to give useful information about the characteristics of certain objects or regions of interest within an image. Gray-level co-occurrence matrices (GLCM) are among the most commonly used methods for texture feature computations. GLCM describes image texture by showing how often specific pixel pairs occur in an image, thus giving information about the pixel arrangement of color intensities in that image. In this work, preliminary ten textural features were implemented for specification of the optic disc characteristics: contrast, energy, entropy, dissimilarity, correlation, homogeneity, cluster shade, cluster prominence, difference variance, and information measure of correlation [30, 31].
Contrast and difference variance were used to measure the image’s contrast whereas the cluster shade and cluster prominence emulated human perception [30]. Furthermore, the information measure of correlation, energy, entropy, dissimilarity, homogeneity, and correlation measures were used to represent the image’s homogeneity. All features were calculated from the gray-level co-occurrence matrices in four directions (0o, 45o, 90o, 135o), then averaged in order to efficiently describe the textural characteristics of the detected optic disc. The GLCM are specified as p(i, j) where i and j indicate the row and column within a certain matrix. The GLCM textural features were calculated using the following equations:
where μx, μy, σx and σy are the means and standard deviations for the rows and columns of p(i, j), whereas px(i) and py(j) are the ith and jth elements in the marginal x and y probability matrices of p(i, j) and
Statistical Features
Glaucoma affects the overall illumination characteristics within the optic disc as a result of the associated optic cup enlargement [32]. Initially seven different statistical features were considered: mean, variance, skewness, kurtosis, energy, entropy, and super pixels. The mean and skewness described the overall intensity of the detected optic disc region whereas the variance and kurtosis measured its illumination discrepancy. The energy and wavelet Shannon entropy [33] evaluated the information content within the optic disc region. Super pixels refer to the highest intensity pixels within a specific region of interest, specifically the pixels whose value is larger than or equal to 0.9. The number of super pixels is thus associated with the increase in cup size characteristic of glaucoma.
Feature Selection
In order to study the relevance of the proposed wavelet textural and statistical features for glaucoma classification, three different analyses were performed: two-sample t test, Relief algorithm [34], and Information Gain [35]. The two-sample t test is a statistical test used to determine whether the average difference between two feature classes is significant or if it is mostly due to random chance. The Relief algorithm weights each of the different features according to its relevance to a specific class. Initially, all weights are set to zero and then weights are updated iteratively in accordance with their significance. Information Gain is an entropy-based method that evaluates the discriminatory potential of features in different classes by measuring their information content.
Results
The proposed glaucoma classification algorithm was tested using two different retinal image datasets, GlaucomaDB and HRF. All features were computed using the MATLAB software (Mathworks, Inc., Natick, MA, USA). For feature selection, the two-sample t test was performed in MATLAB whereas Weka [36] implementations of the Relief and Information Gain algorithms were utilized.
The kNN classifier was chosen for classification as it is easy to tune and gives consistent results as well as being efficiently used for glaucoma classification in literature. In all experiments, the k parameter was varied over the range from 1 to 15 and best classification results were reported. All classifications were performed using fivefold cross-validation in Weka.
Reduced Feature Vector
All three feature selection methods were found to give highly consistent results for both the GlaucomaDB and the HRF datasets. Among the wavelet-based textural features, the correlation, information measure, and cluster prominence computed from the green approximation subband were generally found to be the most significant followed by the contrast, dissimilarity, difference variance, and cluster shade. As for the statistical features, the variance, entropy, and super pixels from both the green and blue approximation subbands were the most relevant for glaucoma detection. The rest of the features had negligible association with the glaucoma detection problem hence were removed from the final feature vector.
Classification Results
Performance analysis was made by calculating the sensitivity, specificity, accuracy, and area under the receiver operating characteristic curve (AUC). Sensitivity, specificity, and accuracy indicate the percentage of correctly classified images within the diseased class, the healthy class, and both classes, respectively, whereas the AUC shows how good a test can distinguish between the healthy and diseased classes. Tables 1 and 2 show the confusion matrices of the GlaucomaDB and HRF, respectively. Table 3 summarizes the performance metrics for the two datasets.
Table 1.
Confusion matrix of the GlaucomaDB
| Healthy | Glaucoma | |
|---|---|---|
| Healthy | 30 | 3 |
| Glaucoma | 4 | 29 |
Table 2.
Confusion matrix of the HRF dataset
| Healthy | Glaucoma | |
|---|---|---|
| Healthy | 15 | 0 |
| Glaucoma | 1 | 14 |
Table 3.
Summary of performance metrics for the GlaucomaDB and the HRF datasets
| Sensitivity (%) | Specificity (%) | Accuracy (%) | AUC (%) | |
|---|---|---|---|---|
| GlaucomaDB | 87.9 | 90.9 | 89.4 | 92.2 |
| HRF | 93.3 | 100 | 96.7 | 94.7 |
For the GlaucomaDB, the proposed glaucoma classification algorithm was able to correctly detect 29 out of 33 glaucoma cases and 30 out of 33 normal cases hence achieving a sensitivity of 87.9%, a specificity of 90.9%, and an overall accuracy of 89.4%. More superior results were achieved when using the HRF dataset where all healthy images as well as all but one glaucomatous images were accurately classified. A sensitivity of 93.3%, specificity of 100%, and overall accuracy of 96.7% were hence achieved. Moreover, AUCs of 92.2% and 94.7% were attained for the GlaucomaDB and the HRF datasets, respectively.
Timing Analysis
The proposed glaucoma classification algorithm is intended for real-time systems; consequently, rapid processing times are very important. For the high-resolution HRF dataset in which images are of size 3504 × 2336 pixels, image cropping, preprocessing, wavelet decomposition and feature extraction all required less than 3 s per image. On the other hand, for the GlaucomaDB having a resolution of ~200 × 200 pixels, complete analysis and feature computation required less than 0.25 s per image.
Discussion
In this work, wavelet textural and statistical features computed from retinal images’ approximation subbands were shown to be suitable for glaucoma detection.
Wavelet features were previously shown to be computationally inexpensive when used for retinal image processing [37] making them attractive for implementation within real-time systems. Wavelet decomposition involves subsequent image down sampling; hence, image resolution is halved with every wavelet decomposition resulting in much faster feature computation times for the lower wavelet levels. A strong merit of the proposed glaucoma detection algorithm is thus its fast processing speed resulting from adopting lower wavelet levels for feature computations. In this work, high-resolution retinal images of size 3504 × 2336 pixels required less than 3 s for preprocessing, optic disc detection, and feature extraction. Previous glaucoma classification methods have reported significantly larger run times. For example in [16], approximately 30 s were required for optic disc segmentation, blood vessel inpainting, and feature extraction for images of resolution 1696 × 2544 pixels which is approximately 10 times slower than the proposed algorithm, and for smaller images.
Glaucoma detection algorithms reported in literature commonly use private datasets for their evaluation. Moreover, a limited number of glaucoma classified datasets are publically available. Consequently, a comparison of different glaucoma detection algorithms is somewhat challenging [38]. Nevertheless, most related works report an accuracy that is usually within the range from 85 to 95% [12]. In this work, accuracies of 89.4% and 96.7% were achieved for the balanced subsets of the GlaucomaDB and HRF datasets, respectively, using fivefold cross-validated kNN classifier. In [18], a hybrid glaucoma detection algorithm resulted in accuracies of 90.8% and 91.1% for the complete GlaucomaDB and HRF datasets, respectively. Another approach in [19] reported accuracies of 80% and 86.7% when using the CDR and hybrid features, respectively, using the balanced HRF dataset. The proposed wavelet-based feature detection algorithm is thus shown to give superior results specifically for the high-resolution HRF dataset.
Wavelet features have the advantage of capturing both the spatial and frequency information of an image making them effective for glaucoma classification [16, 39]. Wavelet-based glaucoma detection algorithms in literature usually relied on only the detail subbands within the first wavelet level for feature computation. In this work, the wavelet textural and statistical features were computed from the retinal images’ approximation subbands under the intuition that approximation subbands convey more information related to the optic disc’s luminance and texture [26]. Furthermore, multilevel wavelet decomposition was used to reduce information related to the blood vessels, which are of minimal relevance to glaucoma detection.
In literature, structural methods are commonly employed for automatic glaucoma detection in retinal images. However, generic methods have been shown to give reliable results for glaucoma detection, at times exceeding the performance of structural methods [20]. In this work, wavelet-based textural and statistical features were used for glaucoma diagnosis. Feature selection showed that wavelet statistical features were more significant for glaucoma classification than the wavelet textural features. Moreover, statistical features calculated from both the green and blue channels were found to be closely relevant. Overall, the five most significant features in both datasets were found to be the variance, super pixels along with the GLCM correlation, information measure, and cluster prominence. Consequently, feature ranking showed that although wavelet features computed from the approximation subbands have the potential to efficiently classify between healthy and glaucomatous retinal images, not all features were equally relevant. In order to enhance the performance of the glaucoma detection algorithm, future work involves exploring the significance of more wavelet-based textural and statistical features.
Conclusions
Early detection and treatment of glaucoma with the aid of automatic screening systems can limit the increasing number of irreversible blindness occurring in progressive stages of the disease. In this work, a wavelet-based generic glaucoma detection algorithm is implemented that is intended for automatic screening systems. A combination of statistical and textural wavelet features was computed from the green and blue approximation subbands of the optic disc segmented region. An accuracy of 96.7% was achieved by the proposed method using the kNN classifier. Several statistical analyses performed showed the relevance of wavelet-based statistical and textural features calculated from the approximation subbands for glaucoma classification. The proposed algorithm also has the advantage of being computationally inexpensive requiring less than 3 s for processing and analysis of high-resolution retinal images.
Compliance with Ethical Standards
Conflict of Interest
The author declares that there is no conflict of interest.
Footnotes
Publisher’s Note
Springer Nature remains neutral with regard to jurisdictional claims in published maps and institutional affiliations.
References
- 1.World Health Organization: Blindness and vision impairment prevention. Available at: http://www.who.int/blindness/causes/priority/en/. Accessed May 2018.
- 2.Bright Focus Foundation: Glaucoma: facts & figures. Available at: https://www.brightfocus.org/glaucoma/article/glaucoma-facts-figures. Accessed May 2018.
- 3.Kumar BN, Chauhan RP, Dahiya N. Detection of glaucoma using image processing techniques: A critique. Semin Ophthalmol. 2018;33(2):275–228. doi: 10.1080/08820538.2016.1229801. [DOI] [PubMed] [Google Scholar]
- 4.Almazroa A, Burman R, Raahemifar K, Lakshminarayanan V. Optic disc and optic cup segmentation methodologies for glaucoma image detection: A survey. Journal of ophthalmology. 2015;2015:1–28. doi: 10.1155/2015/180972. [DOI] [PMC free article] [PubMed] [Google Scholar]
- 5.Kavya N, Padmaja KV: Glaucoma detection using texture features extraction. Proceedings of the 51st IEEE Asilomar Conference on Signals, Systems, and Computers, 1471–1475, 2017.
- 6.Dey N et al.: Optical cup to disc ratio measurement for glaucoma diagnosis using harris corner. In: 3rd IEEE International Conference on Computing Communication & Networking Technologies (ICCCNT), pp. 1–5, 2012.
- 7.Dutta MK et al.: Glaucoma detection by segmenting the super pixels from fundus colour retinal images. In: International IEEE Conference on Medical Imaging, m-Health and Emerging Communication Systems (MedCom), pp. 86–90, 2014.
- 8.Nath MK, Dandapat S. Differential entropy in wavelet subband for assessment of glaucoma. Int J Imaging Syst Technol. 2012;22(3):161–165. [Google Scholar]
- 9.Nawaldgi S, Lalitha YS and Reddy M: A novel adaptive threshold and ISNT rule based automatic glaucoma detection from color fundus images. In: Satapathy S, Bhateja V, Raju K, Janakiramaiah B Eds. Data Engineering and Intelligent Computing. Advances in Intelligent Systems and Computing, vol 542. Singapore: Springer, 2018.
- 10.Spaeth GL. Systems for staging the amount of optic nerve damage in glaucoma: A critical review and new material. Surv Ophthalmol. 2006;51(4):293–315. doi: 10.1016/j.survophthal.2006.04.008. [DOI] [PubMed] [Google Scholar]
- 11.Bock R, Meier J, Nyúl LG, Hornegger J, Michelson G. Glaucoma risk index: Automated glaucoma detection from color fundus images. Med Image Anal. 2010;14(3):471–481. doi: 10.1016/j.media.2009.12.006. [DOI] [PubMed] [Google Scholar]
- 12.Thakur N, Juneja M. Survey on segmentation and classification approaches of optic cup and optic disc for diagnosis of glaucoma. Biomed Signal Process Control. 2018;42:162–189. [Google Scholar]
- 13.Youssif AA, Ghalwash AZ, Ghoneim AA. Optic disc detection from normalized digital fundus images by means of a vessels’ direction matched filter. IEEE Trans Med Imaging. 2008;27(1):11–18. doi: 10.1109/TMI.2007.900326. [DOI] [PubMed] [Google Scholar]
- 14.Bechar ME, et al. Semi-supervised superpixel classification for medical images segmentation: Application to detection of glaucoma disease. Multidim Syst Sign Process. 2018;29(3):979–998. [Google Scholar]
- 15.Dua S, Acharya UR, Chowriappa P, Sree SV. Wavelet-based energy features for glaucomatous image classification. IEEE Trans Inf Technol Biomed. 2012;16(1):80–87. doi: 10.1109/TITB.2011.2176540. [DOI] [PubMed] [Google Scholar]
- 16.Singh A, Dutta MK, ParthaSarathi M, Uher V, Burget R. Image processing based automatic diagnosis of glaucoma using wavelet features of segmented optic disc from fundus image. Comput Methods Prog Biomed. 2016;124:108–120. doi: 10.1016/j.cmpb.2015.10.010. [DOI] [PubMed] [Google Scholar]
- 17.Dey A, Dey KN: Automated glaucoma detection from fundus images of eye using statistical feature extraction methods and support vector machine classification. In: Bhattacharyya S, Sen S, Dutta M, Biswas P, Chattopadhyay H Eds. Industry Interactive Innovations in Science, Engineering and Technology. Lecture Notes in Networks and Systems, vol 11. Singapore: Springer, 2018.
- 18.Akram MU, Tariq A, Khalid S, Javed MY, Abbas S, Yasin UU. Glaucoma detection using novel optic disc localization, hybrid feature set and classification techniques. Australas Phys Eng Sci Med. 2015;38(4):643–655. doi: 10.1007/s13246-015-0377-y. [DOI] [PubMed] [Google Scholar]
- 19.Vijapur NA, Kunte RSR. Sensitized glaucoma detection using a unique template based correlation filter and undecimated isotropic wavelet transform. J Med Biol Eng. 2017;37(3):365–373. [Google Scholar]
- 20.Khalil T, Usman Akram M, Khalid S, Jameel A. Improved automated detection of glaucoma from fundus image using hybrid structural and textural features. IET Image Process. 2017;11(9):693–700. [Google Scholar]
- 21.Mallat SG. A theory for multiresolution signal decomposition: The wavelet representation. IEEE Trans Pattern Anal Mach Intell. 1989;11(7):674–693. [Google Scholar]
- 22.Budai A, Bock R, Maier A, Hornegger J, Michelson G. Robust Vessel Segmentation in Fundus Images. Int J Biomed Imaging. 2013;2013:1–11. doi: 10.1155/2013/154860. [DOI] [PMC free article] [PubMed] [Google Scholar]
- 23.HRF Dataset website link: https://www5.cs.fau.de/research/data/fundus-images/ Accessed March 2018.
- 24.Jain AK: Fundamentals of digital image processing. Upper Saddle River: Prentice-Hall, Inc., 1989.
- 25.Zuiderveld K: Contrast limited adaptive histogram equalization. Chapter VIII.5, Graphics Gems IV. Heckbert PS Eds. Cambridge: Academic Press, 1994, pp 474–485.
- 26.Abdel-Hamid L, el-Rafei A, el-Ramly S, Michelson G, Hornegger J. Retinal image quality assessment based on image clarity and content. J Biomed Opt. 2016;21(9):96007. doi: 10.1117/1.JBO.21.9.096007. [DOI] [PubMed] [Google Scholar]
- 27.Abdel-Hamid L, et al. Performance dependency of retinal image quality assessment algorithms on image resolution: Analyses and solutions. SIViP. 2017;12(1):9–16. [Google Scholar]
- 28.Maths Work: Regionprops. Available at http://www.math-works.com/help/images/ref/regionprops.html. Accessed May 2018.
- 29.Abdel-Hamid L, el-Rafei A, Michelson G. No-reference quality index for color retinal images. Computers in biology and medicine. 2017;90:68–75. doi: 10.1016/j.compbiomed.2017.09.012. [DOI] [PubMed] [Google Scholar]
- 30.Haralick RM, Shanmugam K. Textural features for image classification. IEEE Trans Syst Man Cybern. 1973;SMC-3(6):610–621. [Google Scholar]
- 31.Conners RW. Segmentation of a high-resolution urban scene using texture operators. Comput Vision Graph Image Processing. 1984;25:273–310. [Google Scholar]
- 32.Abdel-Hamid L: Glaucoma detection using statistical features: comparative study in RGB, HSV and CIEL*a*b* color model. Proceeding of the 10th SPIE International Conference on Graphic and Image Processing (ICGIP2018), In Press.
- 33.Coifman RR, Wickerhauser MV. Entropy-based algorithms for best basis selection. IEEE Trans. Inf. Theory. 1992;38(2):713–718. [Google Scholar]
- 34.Kira K, Rendell LA: A practical approach to feature selection. Proceedings of the 9th International Workshop on Machine Learning, pp. 249–256, 1992.
- 35.Quinlan JR: C4.5: Programs for machine learning. San Francisco: Morgan Kaufmann Publishers, 1993.
- 36.Hall M, Frank E, Holmes G, Pfahringer B, Reutemann P, Witten IH. The WEKA data mining software: An update. ACM SIGKDD Explor. Newsl. 2009;11(1):10–18. [Google Scholar]
- 37.Abdel Hamid LS et al.: No-reference wavelet based retinal image quality assessment. Proceedings of the 5th Eccomas Thematic Conference on Computational Vision and Medical Image Processing (VipIMAGE), pp. 123–129, 2015.
- 38.Salam AA et al.: Benchmark data set for glaucoma detection with annotated cup to disc ratio. Proceedings of IEEE International Conference Signals and Systems (ICSigSys), pp. 227–233, 2017.
- 39.Kausu TR, Gopi VP, Wahid KA, Doma W, Niwas SI. Combination of clinical and multiresolution features for glaucoma detection and its classification using fundus images. Bioprocess Biosyst Eng. 2018;38(2):329–341. [Google Scholar]