

Abstract
Scheduling of CT and MR exams requires reasonable estimates for expected scan duration. However, scan-time variability and efficiency gains from combining multiple exams are not quantitatively well characterized. In this work, we developed an informatics approach to quantify typical duration, duration variability, and multiple-procedure efficiency on a large scale, and used the approach to analyze 48,766 CT- and MR-based neuroradiological exams performed over one year. We found MR exam durations demonstrated higher absolute variability, but lower relative variability and lower multiple-procedure efficiency, compared to CT exams (p < 0.001). Our approach enables quantification of real-world operational performance and variability to inform optimal patient scheduling, efficient resource utilization, and sustainable service planning.
Keywords: Computed tomography, Magnetic resonance, Current Procedural Terminology
Introduction
Due to increasing clinical demand [1–3] and decreasing reimbursement [4–8], radiology departments have developed considerable interest in optimization of workflow and resource utilization [9–13]. These efforts are bolstered by understanding the time required for various radiological exams. However, an accurate understanding of these time requirements is complicated by the fact that workhorse cross-sectional modalities such as computed tomography (CT) and magnetic resonance (MR) imaging exhibit variability in exam duration in the real world which has not been well characterized quantitatively. In this study, we describe an informatics approach to large-scale characterization of scan duration variability and compute actual scan durations for neuroradiological CT and MR exams representing 44 different Current Procedural Terminology (CPT) codes performed over one year at a large academic medical center. Typical scan duration, duration variability, and efficiencies arising from consolidation of multiple scans into a single exam encounter were examined. Further, we determined lower bounds for the number of exams of any given procedure type that can be expected to finish within a given period of continuous scanning. The method and results herein may help to inform realistic patient scheduling, efficient resource utilization, and service line planning.
Materials and Methods
We reviewed anonymized data from the radiology information system (RIS) of our large academic medical center. Each radiology exam performed at our institution is recorded in the RIS database with accompanying metadata including CPT code, associated exams, and timestamps corresponding to exam start and exam end. These data were recorded prospectively and contemporaneously by hospital staff as part of standard clinical operating procedure. The RIS database was filtered for diagnostic imaging exams containing at least one CPT code listed in Table 1 and performed between June 27, 2016, and June 30, 2017. Exams comprised CT and MR procedures—either without (“wo”), with (“w”), or without-and-with (“wo/w”) intravenous contrast—of anatomical regions of the head, neck, and spine.
Table 1.
CPT codes represented in this study
| CPT code | Description |
|---|---|
| 70450 | CT brain without contrast |
| 70460 | CT brain with contrast |
| 70470 | CT brain without-and-with contrast |
| 70480 | CT orbit without contrast |
| 70481 | CT orbit with contrast |
| 70482 | CT orbit without-and-with contrast |
| 70486 | CT face without contrast |
| 70487 | CT face with contrast |
| 70488 | CT face without-and-with contrast |
| 70490 | CT neck without contrast |
| 70491 | CT neck with contrast |
| 70492 | CT neck without-and-with contrast |
| 72125 | CT cervical spine without contrast |
| 72126 | CT cervical spine with contrast |
| 72127 | CT cervical spine without-and-with contrast |
| 72128 | CT thoracic spine without contrast |
| 72129 | CT thoracic spine with contrast |
| 72130 | CT thoracic spine without-and-with contrast |
| 72131 | CT lumbar spine without contrast |
| 72132 | CT lumbar spine with contrast |
| 72133 | CT lumbar spine without-and-with contrast |
| 70496 | CTA head without-and-with contrast |
| 70498 | CTA neck without-and-with contrast |
| 70551 | MR brain without contrast |
| 70552 | MR brain with contrast |
| 70553 | MR brain without-and-with contrast |
| 70540 | MR orbit/face/neck without contrast |
| 70542 | MR orbit/face/neck with contrast |
| 70543 | MR orbit/face/neck without-and-with contrast |
| 72141 | MR cervical spine without contrast |
| 72142 | MR cervical spine with contrast |
| 72156 | MR cervical spine without-and-with contrast |
| 72146 | MR thoracic spine without contrast |
| 72147 | MR thoracic spine with contrast |
| 72157 | MR thoracic spine without-and-with contrast |
| 72148 | MR lumbar spine without contrast |
| 72149 | MR lumbar spine with contrast |
| 72158 | MR lumbar spine without-and-with contrast |
| 70544 | MRA head without contrast |
| 70545 | MRA head with contrast |
| 70546 | MRA head without-and-with contrast |
| 70547 | MRA neck without contrast |
| 70548 | MRA neck with contrast |
| 70549 | MRA neck without-and-with contrast |
CPT Current Procedural Terminology, CTA CT angiography, MRA MR angiography
Exam duration was defined as the difference between recorded start time and end time. Exams having ambiguous start time or end time, or end time earlier than start time, were presumed to reflect recording errors and excluded from analysis. Median, interquartile range (IQR), and coefficient of quartile variation (CQV, defined as (Q3 − Q1)/(Q3 + Q1), where Q3 and Q1 are the third and first quartiles, respectively [14]) of exam durations were calculated for each CPT code. IQR was considered a measure of absolute variability, while CQV was regarded as a measure of relative variability. Differences in each statistic between exam types were tested for statistical significance by random permutation testing, with α = 0.001 chosen as a conservative threshold of statistical significance to account for multiple comparisons.
For exams involving multiple procedures (i.e., having more than one CPT code), the amount of time saved by consolidating procedures was evaluated by comparing observed durations of multiple-coded exams to their expected durations, the latter defined as the cumulative time required if each component procedure had been performed separately and sequentially as a single-procedure exam. Expected multiple-procedure exam durations were derived through summation of the probability distribution for exam duration for each single-procedure exam duration obtained from their corresponding distributions. Differences between expected and observed median, IQR, and CQV of multiple-coded durations were also tested for statistical significance using random permutation testing.
This study was approved by the local institutional review board.
Results
Scan Number
A total of 49,812 radiologic exams comprising 37,479 unique patient encounters were recorded during our study period. After removal of excluded exams, 48,766 remained. Overall, 79.75% (38,893/48,766) of exams comprised a single CPT code, while 14.48% (7059/48,766) involved two CPT codes and 5.77% (2814/48,766) involved three or more codes (Table 2).
Table 2.
Number of unique diagnostic radiologic exams analyzed and grouped by the number of CPT codes assigned to each exam
| Number of CPT codes assigned to exam | Number of exams |
|---|---|
| 1 | 38,893 |
| 2 | 7059 |
| 3 | 2188 |
| 4 | 522 |
| 5 | 87 |
| ≥ 6 | 17 |
| Total | 48,766 |
CPT Current Procedural Terminology
Duration of Single-Coded Exams
Durations of single-coded exams are shown in Fig. 1. Among these, the median (IQR) scan duration was 7 (6) min for CT wo exams but 12 (7) min for both CT w and CT wo/w exams. Use of intravenous contrast was associated with significantly longer duration of single-coded CT exams (p < 0.001). For MR-based exams, median (IQR) scan duration was 30 (14) min for MR wo and 47 (17) min for MR wo/w. Use of intravenous contrast was also associated with significantly longer duration of single-coded MR exams (p < 0.001).
Fig. 1.
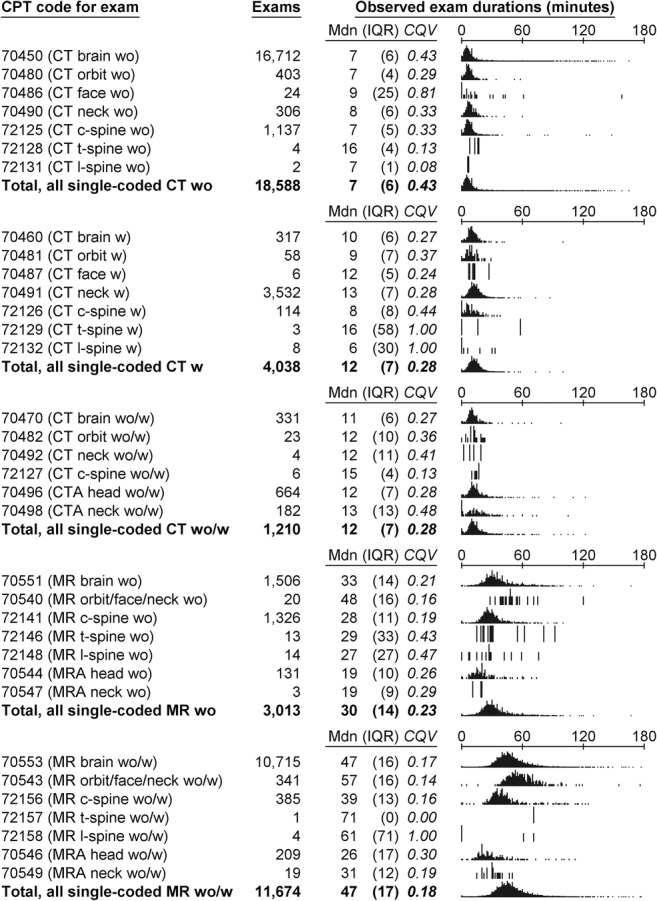
Single-procedure (i.e., single-coded) exam durations. CPT, Current Procedural Terminology; CT, computed tomography; CTA, CT angiography; MR, magnetic resonance; MRA, MR angiography; w, with contrast; wo, without contrast; wo/w, without-and-with contrast; Mdn, median; IQR, interquartile range; CQV, coefficient of quartile variation
Single-coded MR-based exams were significantly longer (p < 0.001) and had higher absolute variability (p < 0.001) in duration than their CT-based counterparts performed on the same anatomical regions. For example, median (IQR) scan duration was 33 (14) min for MR brain wo compared to 7 (6) min for CT brain wo. With addition of intravenous contrast, scan duration was 47 (16) min for MR brain wo/w compared to 11 (6) for CT brain wo/w. Despite higher absolute variability, single-coded MR exams had lower relative variability in duration than their CT-based counterparts (p < 0.001).
Duration of Double-Coded Exams
Durations of double-coded exams are shown in Fig. 2. Median (IQR) scan duration was 9 (6) min for double-coded CT wo exams, 15 (11) min for double-coded CT w exams, and 13 (9) min for double-coded CT wo/w exams. Use of intravenous contrast was associated with significantly longer duration of double-coded CT exams (p < 0.001). For MR-based exams, median (IQR) scan duration was 52 (20) min for double-coded MR wo exams and 70 (26) min for double-coded MR wo/w exams. Use of intravenous contrast was also associated with significantly longer duration of double-coded MR exams (p < 0.001). Moreover, double-coded MR exams were significantly longer (p < 0.001) and had higher absolute variability (p < 0.001), but lower relative variability (p < 0.001), in duration than their CT-based counterparts.
Fig. 2.

Double-procedure (i.e., double-coded) exam durations. Exam types occurring fewer than 10 times are not shown. CPT, Current Procedural Terminology; CT, computed tomography; CTA, CT angiography; MR, magnetic resonance; MRA, MR angiography; w, with contrast; wo, without contrast; wo/w, without-and-with contrast; Mdn, median; IQR, interquartile range; CQV, coefficient of quartile variation
Observed durations for double-coded exams were significantly shorter (p < 0.001) than what was expected had their component procedures been performed as single-coded exams. Median (IQR) expected durations were 17 (10) min for double-coded CT wo exams, 22 (18) min for double-coded CT w exams, and 25 (12) min for double-coded CT wo/w exams, resulting in observed time savings due to procedure consolidation of 8, 7, and 2 min, respectively (p < 0.001 for each), corresponding to 47%, 32%, and 8% of expected scan duration, respectively. Similarly, expected durations were 58 (34) min for double-coded MR wo exams and 91 (40) min for double-coded MR wo/w exams, resulting in observed time savings of 6 and 21 min, respectively (p < 0.001 for each), corresponding to 10% and 23% of expected scan duration, respectively.
Duration of Triple-Coded Exams
Durations of triple-coded exams are shown in Fig. 3. Median (IQR) scan duration was 13 (10) min for triple-coded CT wo exams and 14 (9) min for triple-coded CT w exams. No instances of triple-coded CT wo/w exams were identified. Use of intravenous contrast was not associated with significantly longer duration of triple-coded CT exams (p = 0.783), though this result is limited by a comparatively small sample size. For MR-based exams, median (IQR) scan duration was 62 (27) min for triple-coded MR wo exams and 84 (34) min for triple-coded MR wo/w exams. Use of intravenous contrast was associated with significantly longer duration of triple-coded MR exams (p < 0.001). Triple-coded MR exams were longer (p < 0.001) and had higher absolute variability (p < 0.001), but lower relative variability (p < 0.001), in duration than their CT-based counterparts.
Fig. 3.

Triple-procedure (i.e., triple-coded) exam durations. Exam types occurring fewer than 10 times are not shown. CPT, Current Procedural Terminology; CT, computed tomography; CTA, CT angiography; MR, magnetic resonance; MRA, MR angiography; w, with contrast; wo, without contrast; wo/w, without-and-with contrast; Mdn, median; IQR, interquartile range; CQV, coefficient of quartile variation
Observed durations for triple-coded exams were significantly shorter (p < 0.001) than what was expected had their component procedures been performed as single-coded exams. Median (IQR) expected durations were 25 (11) min for triple-coded CT wo exams and 33 (26) min for triple-coded CT w exams, resulting in observed time savings due to procedure consolidation of 12 min (p < 0.001) and 19 min (p < 0.001), respectively, corresponding to 48% and 58% of expected scan duration, respectively. Similarly, expected durations were 86 (38) min for triple-coded MR wo exams and 139 (53) min for triple-coded MR wo/w exams, resulting in observed time savings of 24 and 55 min, respectively (p < 0.001), corresponding to 28% and 40% of expected scan duration, respectively.
Aggregate Duration of Exams Over Long Periods
Duration of CT-based exams tended to be more right-skewed and heavy-tailed than for MR-based exams (Fig. 4), resulting from a greater number of outliers with CT. For any specified period of continuous scanning, the number of single-coded scans which could be completed in 95% of cases within that period is shown in Fig. 5. For example, 33 CT head wo exams (CPT 70450) or 10 MR brain wo exams (CPT 70551) could be completed within 8 h of back-to-back scanning in 95% of cases, though the median expected scan time is one hour less for the former compared to the latter (Fig. 6). When extended to 24 h of scanning, 117 CT head wo or 32 MR brain wo exams could be completed in 95% of cases.
Fig. 4.

Representative Q-Q plot of CT head wo exam durations against MR brain wo exam durations. Line of identity and interquartile line are shown. CT, computed tomography; MR, magnetic resonance; wo, without contrast
Fig. 5.
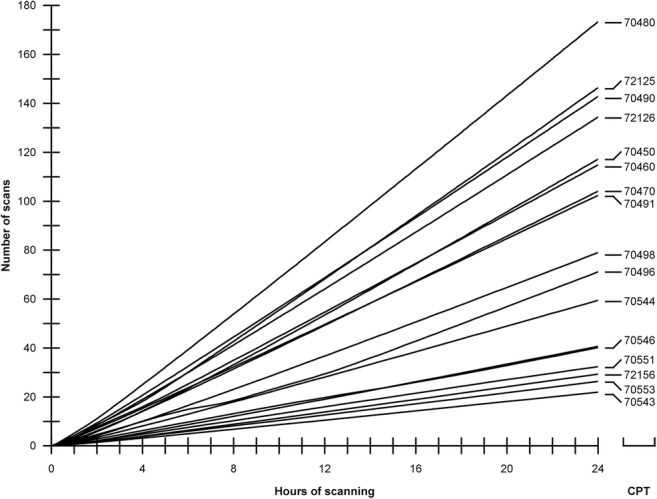
Number of scans that could be completed in 95% of cases within a given period of continuous scanning, assuming uninterrupted single-procedure exams
Fig. 6.

Expected time required for 33 consecutive CT head wo exams compared to 10 consecutive MR brain wo exams. CT, computed tomography; MR, magnetic resonance; wo, without contrast; closed triangle, median cumulative exam time; open triangle, 95th percentile of cumulative exam time
Discussion
Here, we have presented a novel approach for measuring real-world duration of radiological studies at a large scale and applied this method to approximately 50,000 neuroradiological CT and MR exams to understand variability in scan duration. Our main findings were the following: (1) MR exam durations exhibit higher absolute variability but lower relative variability than their CT counterparts, (2) consolidating multiple CPT codes into a single encounter produces greater relative time savings for CT than MR, and (3) the use of intravenous contrast increases CT and MR exam durations by similar proportions. We also generated empiric distributions of exam duration for 44 CPT codes, quantifying intra-code variability as well as expected number of exams that can be reliably completed within uninterrupted periods of scanning.
Acquisition time of a scan is influenced by scan type and additional patient-, disease-, and facility-related factors (Table 3). Scan type, which incorporates imaging modality, anatomical region, and use of intravenous contrast, is captured by CPT coding. Patient-related factors include airway intubation, which can complicate patient positioning, language barriers, and poor venous accessibility, among others. Disease-related factors affect selection of acquisition sequences, which is an important source of variability within any CPT code. For example, brain MRI without-and-with contrast for pre-operative evaluation of a brain tumor uses the same “70553” CPT code as brain MRI without-and-with contrast for headache, but the former often involves more imaging sequences. Facility-related factors include individual technologist efficiency, institutional protocols, and availability of assistants, among others.
Table 3.
Factors affecting scan time
| Scan type |
Imaging modality Anatomical region Use of intravenous contrast |
| Patient-related |
Airway intubation affecting positioning Language barriers Venous accessibility |
| Disease-related | Selection of acquisition sequences |
| Facility-related |
Technologist efficiency Institutional protocol Assistant availability |
While attempts to extract patient- and disease-related factors from electronic medical records to inform realistic patient scheduling have been reported [10, 11, 13], at most institutions, only an anticipated CPT code is known at the time of exam scheduling. CPT code is therefore a logical basis by which to estimate scan time and forecast resource utilization. However, an oft-assumed caveat is that exams sharing CPT codes may differ significantly in actual duration, which is confirmed in our findings.
Our data yielded several counterintuitive results. Despite having greater absolute variability on a per-exam basis, MR exam duration is in fact less variable overall compared to CT exam duration when adjusted for its longer median. Between these two modalities, a finding of higher absolute variability in MR was not surprising given the extensive capacity of MR for customization of pulse sequences and acquisition parameters. However, we did not expect to see CT exams having greater overall (relative) variability, which we speculate may be due to non-imaging causes such as patient positioning, scan prescription, and apparatus manipulation, all of which may have exaggerated effects on overall exam duration when the actual imaging duration is short. Scan-time variability therefore turns out to have the greatest impact on scheduling for CT, not MR. Additionally, we expected the administration of intravenous contrast would lead to greater prolongation of MR exams than CT exams due to the need to append additional post-contrast sequences to the non-contrast portion of MR studies. Yet, we found MR and CT exams are about equally affected.
Due to the large daily number of exams performed on modern clinical scanners, aggregated scan-time variability over long periods of continuous operation must be considered. For instance, the median duration of 7 min for CT head wo and 33 min for MR brain wo may naively suggest about five CT exams can be scheduled for every MR. In reality, the ratio is lower due to greater relative variability of CT exams, as only 33 CT head wo exams can be reliably completed during 8 h of continuous scanning, compared to 10 MR brain wo exams. Disparate aggregate variability reflects operational risk for clinical practices as inaccurate estimation of scan time leads to unexpected exam delays and displaces routine exams to on-call hours, increasing labor costs [1] and interpretive burden for on-call radiologists [2, 3] while decreasing patient satisfaction [15–18] and patient-perceived value [19]. Accurate appraisal of scan duration is also necessary for hospitals and physician groups when determining sustainability of expanded clinical service lines [10, 20–24].
Real-world assessment of exam duration also provides an objective basis for determining fair technical reimbursement, which has generated controversy in recent years due in part to perceived inaccuracies in estimates of time required to perform radiological imaging [4, 5]. Such considerations are relevant for both CT and MR, as technical reimbursement based strictly upon CPT code without reference to actual exam protocol or clinical indication fails to capture important modifying characteristics of these exams.
A final discussion point relates to controversial multiple-procedure payment reduction (MPPR) policies [6–8]. In analyzing exams to objectively quantify multiple-procedure efficiencies in real-world practice, time savings due to consolidating procedures were identified for both CT and MR. Overall relative savings were much lower for MR than for CT, likely because MR exams over different body regions tend not to impactfully reduce the total number of sequences acquired, whereas CT exams spanning multiple body regions may often be performed as a single acquisition. Thus, CT and MR warrant separate consideration of cost efficiency resulting from aggregation. An important caveat here is that scanner time is one of several contributors to total exam cost; other sources of technical and professional cost, such as ongoing data storage or image interpretation, may not exhibit similar efficiencies of aggregation.
Our study has some limitations. First, start and end times may be recorded inconsistently due to lack of rigorous definitions during data entry. “Start time” can be reasonably interpreted in several ways (e.g., first image acquired, patient on table, or patient in room), and similarly for end time. While the large number of studies included in this work mitigates the effect of this ambiguity, it nonetheless remains a challenge of using real-world data. Second, the quantitative details of our analysis are accurate at our own institution but may not reflect performance at facilities with different practices. Generalizing the quantitative results of our analysis requires control of many more aspects of the scan process than was feasible in our study design. Nevertheless, our method of analysis can be easily adopted at other centers interested in acquiring local data to inform local practices, and the general trends we have identified in our data (e.g., that consolidation of multiple procedures produces greater relative time savings for CT than MR) can provide a useful blueprint for other institutions even if the numerical details differ. Finally, actual imaging protocols are not always reflected accurately in CPT codes, due to inconsistencies in real-world practice as well as limitations in the CPT vocabulary. Ideal data for this study would have contained exact protocol notes but were unfortunately not available. On the other hand, such data are not usually available in practice when determining a strategy for scheduling, and so our data reflect what is used in the real world.
In conclusion, we have shown that real-world scan duration can be quantified on a large scale using a straightforward informatics approach based on timestamps recorded during routine clinical activity. In the context of neuroradiological exams, we found that MR exams had higher absolute variability per exam but significantly lower overall variability in duration than their CT counterparts. We also reported that addition of intravenous contrast increases the duration of neuroradiological CT and MR exams by a proportionally similar amount despite increasing protocol requirements for the latter. Lastly, we found that consolidating multiple CPT codes into a single encounter produces greater relative time savings for CT than MR. The techniques and associated insights we describe in this work can be used to inform smart scheduling, operational assessment, and service line planning.
Abbreviations
- CPT
Current Procedural Terminology
- CT
Computed tomography
- MR
Magnetic resonance
- CTA
Computed tomography angiography
- MRA
Magnetic resonance angiography
- w
With contrast
- wo
Without contrast
- wo/w
Without-and-with contrast
- IQR
Interquartile range
- CQV
Coefficient of quartile variation
Compliance with Ethical Standards
Conflict of Interest
The authors declare that they have no competing interests.
Footnotes
Publisher’s Note
Springer Nature remains neutral with regard to jurisdictional claims in published maps and institutional affiliations.
References
- 1.Carroll TJ. Trends in on-call workload in an academic medical center radiology department 1998-20021. Acad Radiol. 2003;10(11):1312–1320. doi: 10.1016/S1076-6332(03)00381-7. [DOI] [PubMed] [Google Scholar]
- 2.Kansagra AP, Liu K, Yu JP. Disruption of radiologist workflow. Curr Probl Diagn Radiol. 2016;45(2):101–106. doi: 10.1067/j.cpradiol.2015.05.006. [DOI] [PubMed] [Google Scholar]
- 3.Yu JP, Kansagra AP, Mongan J. The radiologist’s workflow environment: evaluation of disruptors and potential implications. J Am Coll Radiol. 2014;11(6):589–593. doi: 10.1016/j.jacr.2013.12.026. [DOI] [PubMed] [Google Scholar]
- 4.Forman HP. MRI and CT imaging: how fast can reimbursement be cut? AJR Am J Roentgenol. 2006;187(3):601–602. doi: 10.2214/AJR.06.0915. [DOI] [PubMed] [Google Scholar]
- 5.Moser JW. The deficit reduction act of 2005: policy, politics, and impact on radiologists. J Am Coll Radiol. 2006;3(10):744–750. doi: 10.1016/j.jacr.2006.05.009. [DOI] [PubMed] [Google Scholar]
- 6.Duszak R Jr, Silva E 3rd, Kim AJ, Barr RM, Donovan WD, Kassing P, McGinty G, Allen B Jr. Professional efficiencies for diagnostic imaging services rendered by different physicians: analysis of recent medicare multiple procedure payment reduction policy. J Am Coll Radiol. 2013;10(9):682–688. doi: 10.1016/j.jacr.2013.02.019. [DOI] [PubMed]
- 7.Allen B, Jr, Donovan WD, McGinty G, Barr RM, Silva E, 3rd, Duszak R, Jr, Kim AJ, Kassing P. Professional component payment reductions for diagnostic imaging examinations when more than one service is rendered by the same provider in the same session: an analysis of relevant payment policy. J Am Coll Radiol. 2011;8(9):610–616. doi: 10.1016/j.jacr.2011.06.012. [DOI] [PubMed] [Google Scholar]
- 8.Rehani B, Basu P, Ellenbogen PH, Sherin C, Cooper JJ. The threat to radiologists from the multiple-procedure payment reduction. J Am Coll Radiol. 2013;10(4):237–238. doi: 10.1016/j.jacr.2012.12.017. [DOI] [PubMed] [Google Scholar]
- 9.Elkhuizen SG, van Sambeek JR, Hans EW, Krabbendam KJ, Bakker PJ. Applying the variety reduction principle to management of ancillary services. Health Care Manage Rev. 2007;32(1):37–45. doi: 10.1097/00004010-200701000-00006. [DOI] [PubMed] [Google Scholar]
- 10.Boland GW. Enhancing CT productivity: strategies for increasing capacity. AJR Am J Roentgenol. 2008;191(1):3–10. doi: 10.2214/AJR.07.3208. [DOI] [PubMed] [Google Scholar]
- 11.Carpenter AP, Leemis LM, Papir AS, Phillips DJ, Phillips GS. Managing magnetic resonance imaging machines: support tools for scheduling and planning. Health Care Manag Sci. 2011;14(2):158–173. doi: 10.1007/s10729-011-9153-z. [DOI] [PubMed] [Google Scholar]
- 12.Vasanawala SS, Desser TS. Accommodation of requests for emergency US and CT: applications of queueing theory to scheduling of urgent studies. Radiology. 2005;235(1):244–249. doi: 10.1148/radiol.2351040289. [DOI] [PubMed] [Google Scholar]
- 13.Vermeulen IB, Bohte SM, Elkhuizen SG, Lameris H, Bakker PJ, La Poutré H. Adaptive resource allocation for efficient patient scheduling. Artif Intell Med. 2009;46(1):67–80. doi: 10.1016/j.artmed.2008.07.019. [DOI] [PubMed] [Google Scholar]
- 14.Bonett D. Confidence interval for a coefficient of quartile variation. Comput Stat Data Anal. 2006;50(11):2953–2957. doi: 10.1016/j.csda.2005.05.007. [DOI] [Google Scholar]
- 15.Salazar G, Quencer K, Aran S, Abujudeh H. Patient satisfaction in radiology: qualitative analysis of written complaints generated over a 10-year period in an academic medical center. J Am Coll Radiol. 2013;10(7):513–517. doi: 10.1016/j.jacr.2013.03.013. [DOI] [PubMed] [Google Scholar]
- 16.Itri JN. Patient-centered radiology. Radiographics. 2015;35(6):1835–1846. doi: 10.1148/rg.2015150110. [DOI] [PubMed] [Google Scholar]
- 17.Reynolds A. Patient-centered care. Radiol Technol. 2009;81(2):133–147. [PubMed] [Google Scholar]
- 18.Rosenkrantz AB, Pysarenko K. The service encounter in radiology: acing the “moments of truth” to achieve patient-centered care. Acad Radiol. 2015;22(2):259–264. doi: 10.1016/j.acra.2014.09.009. [DOI] [PubMed] [Google Scholar]
- 19.Boland GW. Diagnostic imaging centers for hospitals: a different business proposition for outpatient radiology. J Am Coll Radiol. 2007;4(9):581–583. doi: 10.1016/j.jacr.2007.03.011. [DOI] [PubMed] [Google Scholar]
- 20.Rubin GD, Patel BN. Financial forecasting and stochastic modeling: predicting the impact of business decisions. Radiology. 2017;283(2):342–358. doi: 10.1148/radiol.2017161800. [DOI] [PubMed] [Google Scholar]
- 21.Medverd JR, Prabhu SJ, Lam DL. Business of radiology: financial fundamentals for radiologists. AJR Am J Roentgenol. 2013;201(5):W683–W690. doi: 10.2214/AJR.13.10838.. [DOI] [PubMed] [Google Scholar]
- 22.Lu L, Li J, Gisler P. Improving financial performance by modeling and analysis of radiology procedure scheduling at a large community hospital. J Med Syst. 2011;35(3):299–307. doi: 10.1007/s10916-009-9366-6. [DOI] [PubMed] [Google Scholar]
- 23.Nisenbaum HL, Birnbaum BA, Myers MM, Grossman RI, Gefter WB, Langlotz CP. The costs of CT procedures in an academic radiology department determined by an activity-based costing (ABC) method. J Comput Assist Tomogr. 2000;24(5):813–823. doi: 10.1097/00004728-200009000-00026. [DOI] [PubMed] [Google Scholar]
- 24.Anzai Y, Heilbrun ME, Haas D, Boi L, Moshre K, Minoshima S, Kaplan R, Lee VS. Dissecting costs of CT study: application of TDABC (time-driven activity-based costing) in a tertiary academic center. Acad Radiol. 2017;24(2):200–208. doi: 10.1016/j.acra.2016.11.001. [DOI] [PubMed] [Google Scholar]