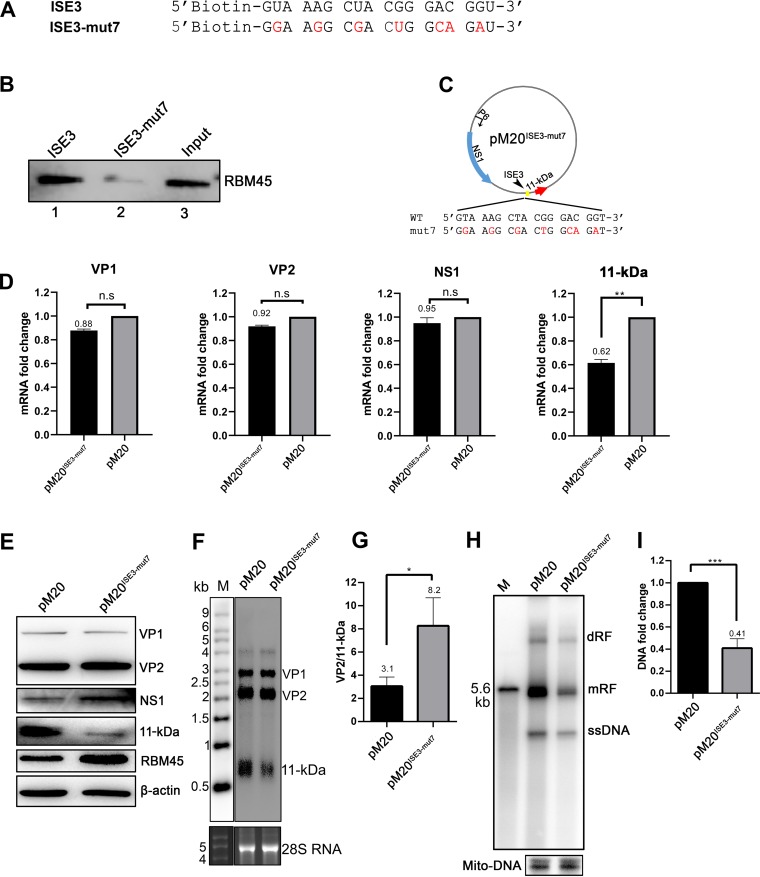
FIG 8.
A B19V M20 infectious clone that harbors silent mutations of ISE3 expressed a low level of the mRNA spliced at the D2 and A2-2 sites and of 11-kDa protein in transfected cells. (A) ISE3 and ISE3 mutant 7 (ISE3-mut7) RNA sequences. The two RNAs shown were used in the binding experiment. (B) RNA pulldown assay. Biotinylated ISE3 and ISE3-mut7 were incubated with RBM45-His protein and then pulled down by using streptavidin beads. The RNA-bound proteins were eluted and analyzed by Western blotting for RBM45, as indicated. Approximately 4% of the RBM45-His protein was loaded as input (lane 3). (C) Diagram of pM20ISE3-mut7. Silent mutations in the ISE3 of the M20 clone (pM20ISE3-mut7) are diagrammed and shown with 7 mutations in red, while the coded amino acids of the VP1/2 protein remained unchanged. (D and E) RNA and protein analyses. UT7/Epo-S1 cells were transfected with either M20ISE3-mut7 or the parent M20 clone. (D) RT-qPCR. At 2 days posttransfection, total RNA was extracted from treated UT7/Epo-S1 cells and reverse transcribed. cDNA was used for quantification of the mRNAs that encode the VP1, VP2, NS1, and 11-kDa proteins by the use of qPCR. Quantified viral mRNA levels were normalized to the level of β-actin mRNA, and the value representing mRNA quantified from M20-transfected control UT7/Epo-S1 cells was arbitrarily set to 1. (E) Western blotting. At 2 days posttransfection, cells were lysed and run for Western blotting for expression of viral proteins as indicated. β-Actin was used as a loading control. (F and G) Northern blotting of viral mRNAs. At 2 days posttransfection, total RNA was extracted from treated UT7/Epo-S1 cells and was subjected to Northern blotting using a cap probe. The detected viral mRNA bands are indicated. The Millennium RNA marker (M; Invitrogen) was loaded and blotted with a probe that hybridizes to it. Ethidium bromide staining of the RNA gel shows the 28S ribosome RNA. (F) The levels of VP2 and 11-kDa mRNAs were quantified, and the ratio of VP2/11-kDa mRNA was calculated from three independent experiments. (H and I) Southern blotting (viral DNA replication). At 2 days posttransfection, Hirt DNA samples were prepared from UT7/Epo-S1 cells and were subjected to Southern blot analysis. The results of pM20 digestion performed with SalI were loaded as a size marker. (H) The blots shown were probed with the M20 probe (top) and the Mito-DNA probe (bottom) and are representative. dRF, mRF, and ssDNA, double replicative form, monomer replicative form, and single-stranded DNA, respectively. (I) The intensity of RF DNA band was quantified and normalized to the level of the mitochondrial DNA (Mito-DNA) of each sample. The value representing viral RF DNA in UT7/Epo-S1 cells transfected with pM20 was arbitrarily set to 1. Relative fold change of the viral RF DNA in UT7/Epo-S1 cells transfected with pM20ISE3-mut7 is shown with averages and standard deviations of results from three repeated experiments.

