FIG 6.
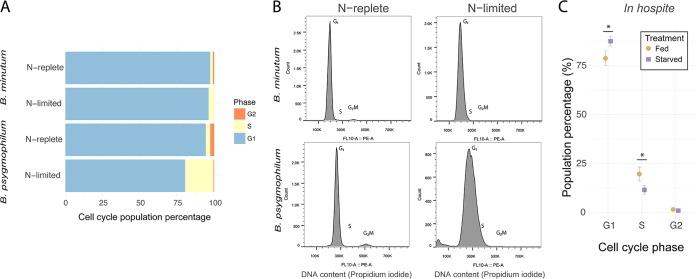
Cell cycles of B. minutum and B. psygmophilum in culture and in hospite. (A) Stacked horizontal bar graphs represent cell cycle percentages (blue = G1, yellow = S, orange = G2/M) of Breviolum cultures grown under nitrogen-replete and nitrogen-limited conditions. (B) Representative cell cycle profiles of nitrogen-replete and nitrogen-limited cultures are shown for both Breviolum cultures. (C) To examine the effect of nutrition on Breviolum populations in hospite, cell cycle percentages of B. minutum symbionts were measured from fed (brown circles) and starved (purple squares) Aiptasia hosts. The population percentages of symbionts are shown for each cell cycle phase (G1, S, and G2). Asterisks represent significant differences (two-sample t test, P < 0.05).

