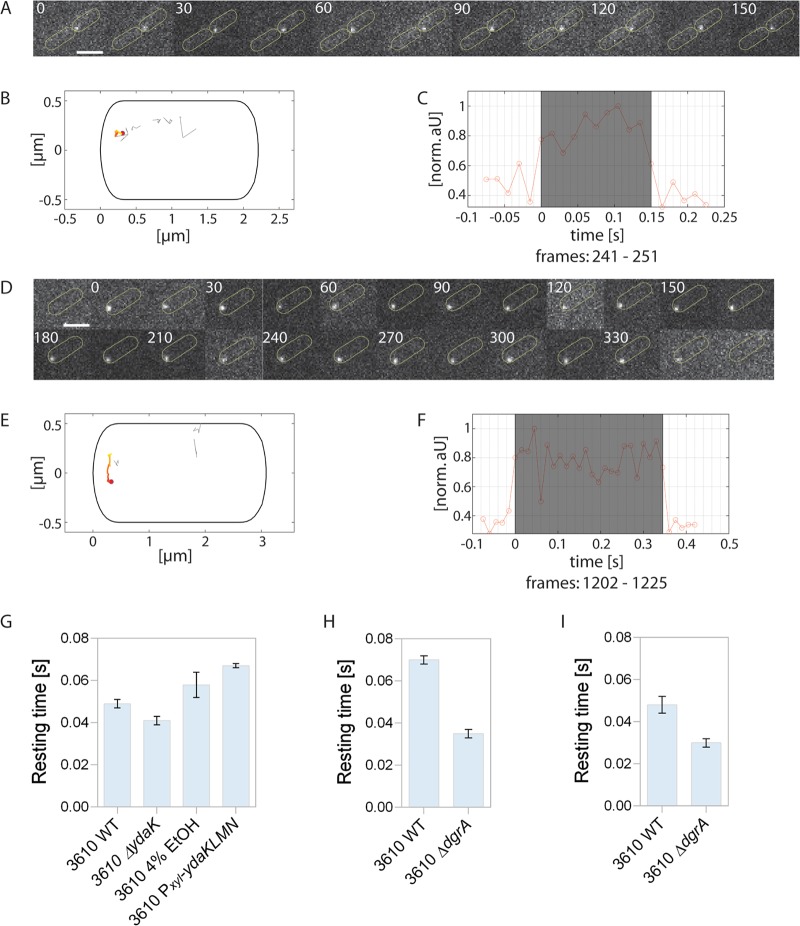
FIG 2.
Single-molecule tracking of exponentially growing DgcK-mVenus in B. subtilis 3610 wild-type cells. (A) Representative static molecule of DgcK-mVenus in the wild type localized at the cell pole (D), and dynamic track of DgcK-mVenus moving along the cell pole. Scale bars correspond to 2 μm. (B, E) Corresponding projections of all tracks in these cells showing the static (B) or mobile (E) track in a color-coded manner. The origin is highlighted in red and the end in yellow. All other tracks in the same cell are displayed in gray. (C, F) Normalized intensity profile of the track shaded in gray. (G to I) Average dwell times of DgcK-mVenus and DgcP-mVenus in different B. subtilis NCIB 3610 strains. (G) The bar plots depict the change in the average dwell times (calculated with “SMM Track”) of DgcK-mVenus in the NCIB 3610 wild type (3610 WT), in a ydaK deletion strain (3610 ΔydaK), and in two strains overexpressing ydaK (3610 4% EtOH, cells stressed with 4% ethanol for 30 min; 3610 Pxyl-ydaKLMN, NCIB 3610 with Pxyl-ydaKLMN). The absence of YdaK leads to a decrease of the dwell time, whereas overexpression leads to an increase. (H, I) Dwell times of DgcK-mVenus (H) or DgcP-mVenus (I) in a stain lacking the c-di-GMP receptor dgrA (3610 ΔdgrA) and in the NCIB 3610 wild type. All data are from three biological replicates.

