Abstract
Association of Coagulation factor V (F5) polymorphisms with the occurrence of many types of cancers has been widely reported, but whether it is of prognostic relevance in some cancers remain to be resolved. The RNA-sequencing dataset was downloaded from The Cancer Genome Atlas (TCGA). The potential of F5 genes to predict the survival time of gastric cancer (GC) patients was investigated using univariate and multivariate survival analysis whereas “Kaplan-Meier plotter” (KM-plotter) online tools were employed to validate the outcomes. TCGA data revealed that F5 mRNA levels were significantly upregulated in gastric cancer samples. Survival analysis confirmed that high levels of F5 mRNA correlated with short overall survival (OS) in gastric cancer patients, and the area under the curve (AUC) values of 1-, 2-, and 5-year OS rate were 0.554, 0.593, and 0.603, respectively. Survival analysis by KM-plotter indicated that the high expression of F5 mRNA was significantly associated with a shorter OS compared with the low expression level in all patients with GC, and this was also the case for patients in stage III (hazard ratio (HR) = 1.78, P = 0.017). These findings suggest that the F5 gene is significantly upregulated in GC tumour tissues, and may be a potential prognostic biomarker for GC.
1. Introduction
Gastric cancer is the 5th most common malignancy globally and is the 3rd most lethal among all cancers; its incidence varies across regions [1]. Despite recent advances in the diagnosis and treatment methods of cancer, stomach cancer remains the 2nd leading cause of death among all cancers in China [2]. Moreover, it has inconsistent therapeutic response and prognosis at various stages because of high tumour heterogeneity. Investigation of the molecular mechanism of cancer invasion, metastasis, occurrence, and prognosis from a genomics perspective, which might provide highly sensitive treatment approaches, is therefore highly desirable. This may lead to the identification of new prognostic and diagnostic indicators and therapeutic targets.
F5 (Coagulation factor V) is a circulating high molecular weight (330 kDa) procofactor which plays a role in the blood coagulation cascade. When activated, it functions as a cofactor that activates coagulation factor X to convert prothrombin to thrombin [3]. In malignancy, activation of coagulation and fibrinolysis is frequently detected. Increasing evidence has indicated that activation of the coagulation system is associated with a higher risk of invasion, metastases, and eventually, worse outcome. In other words, activation of the coagulation system is beneficial to tumour development [4]. Miller et al. found that long-term activation of the coagulation pathway promotes tumourigenesis in the digestive tract in males [5]. Numerous studies have investigated the association of the F5 polymorphism with the risk of multiple cancers, such as colorectal cancer and gastric cancer [6]. So far, fewer studies have investigated the relationship between F5 and cancer prognosis, including gastric cancer, in which changes in the coagulation-fibrinolytic system are often present. The association of the F5 expression level with the survival time of patients with basal breast cancer has been reported by a single study by Tinholt et al. [7]. Accumulating evidence suggests that various clotting system factors may influence the prognosis of cancer patients [4, 8–12]. However, the role and mechanism of F5 gene expression in the prognosis of cancers are still unknown.
The Cancer Genome Atlas (TCGA) database contains molecular data of more than 20,000 primary cancers and paired adjacent samples covering 33 cancer types. An RNA-sequencing (RNA-Seq) dataset from TCGA was used to determine the impact potential of the F5 gene to predict the prognosis of GC patients. The “Kaplan-Meier plotter” database, which contains the gene expression profile of 1,400 GC patients and follow-up information from the Gene Expression Omnibus (GEO) were used to validate the results obtained from TCGA database.
2. Materials and Methods
2.1. Survival Analysis and Diagnostic Value of the F5 Gene
The RNA-Seq count dataset and matched clinical information of stomach adenocarcinoma (STAD) were downloaded from TCGA (https://portal.gdc.cancer.gov/; December 15, 2018) [13], and then the RNA-Seq count dataset was normalized by the DESeq package [14]. The data of GC patients was subcategorized to two groups based on the median of the gene expression level. The prognostic value of the F5 expression and the clinical characteristics were initially evaluated using the logrank test and univariate Cox regression model to identify significant prognostic factors for GC. Multivariate Cox regression was performed to confirm the role of genes by adjusting for age, TNM stage, radiation therapy, targeted molecular therapy, and residual tumour. Subsequently, stratified analysis was conducted based on the clinical parameters to further investigate the relationship between differential expression of this gene and clinical parameters by univariate and multivariate analyses. Lastly, the KM-plotter database (http://kmplot.com/private/; June 15, 2019), which automatically subgroups the submitted gene into high- and low-risk groups by the median value, was used to generate KM survival plots for the F5 gene with multiple clinical parameters such as stage TNM, Lauren classification, differentiation, and HER2 status. Next, a survival risk map was plotted and a receiver operating characteristic (ROC) curve analyses were performed to evaluate the accuracy of F5 in distinguishing adjacent or tumour tissues. The prediction accuracy of the F5 was determined by survivalROC in R software.
2.2. Comprehensive Analysis of Genome-Wide Coexpression of F5
To further explore the expression-regulation relationship between F5 gene and other genes, genome-wide coexpression analysis was carried out using corrplot package in the R 3.5.1 platform. Coexpression relationships were deemed significant using the standard P value < 0.05 and |r| > 0.2 as the cut-off values. Subsequently, the DAVID (https://david.ncifcrf.gov/home.jsp) database was used for Gene Ontology (GO) and Kyoto Encyclopedia of Genes and Genomes (KEGG) enrichment analyses to determine the biological processes associated with these genes [15].
2.3. GSEA Analysis
The data were categorised into high- and low-expression groups based on the median expression level of F5 gene and GSEA (http://www.broadinstitute.org/gsea/index.jsp) was then performed to explore the potential biological mechanisms that underlie the prognostic role of F5 [16, 17]. c2(v6.2) and c5(v6.2), obtained from a gene set database, were used to investigate the biological processes in patients with high or low expression of F5 genes. Biological processes were considered to be significantly enriched if they met a threshold of normalized P < 0.05.
2.4. Statistical Analysis
Logrank test was used to calculate OS and the P values for clinical characteristics including F5 gene. Factors with P value < 0.05 were included in the multivariate Cox regression analysis. Hazard ratio (HR) and 95% confidence intervals (CI) were calculated to determine the relative risk for different influencing factors. All statistical analyses were performed using SPSS v.22.0 software (IBM Corp, Armonk, NY, USA) and R3.5.1. P < 0.05 was considered statistically significant.
3. Results
3.1. The Expression Level and Diagnostic Value of F5 in Gastric Cancer
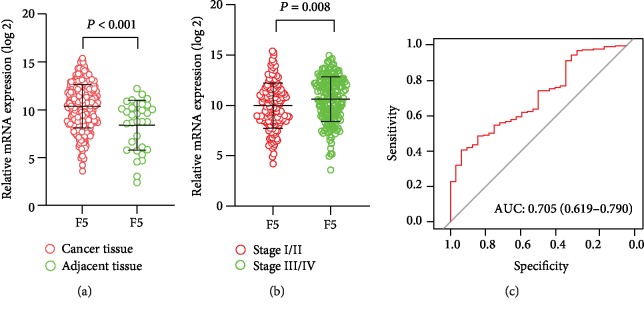
The RNA-Seq dataset of 351 GC patients from TCGA were included in current study. The distribution of F5 gene differed significantly between adjacent tissues and tumour tissues, as well as in different stages as revealed by the scatter diagram (Figures 1(a) and 1(b)). The ability of F5 to distinguish adjacent tissues from tumour tissues was medium (AUC (95%CI) = 0.705 (0.619−0.790) and Figure 1(c)).
Figure 1.
Distribution of F5 genes in different gastric cancer tissues and tumour stages. The receiver operating characteristic curves (ROC) of the F5 gene were used to distinguish gastric cancer tissue from normal tissues in The Cancer Genome Atlas (TCGA). (a) Gene expression of the F5 gene in cancer tissues and adjacent tissues; (b) F5 gene expression in different stages of gastric cancer; (c) receiver operating characteristic curves (ROC) of F5 were used to distinguish gastric cancer tissue from adjacent normal tissues. F5: Coagulation factor V.
3.2. Survival Analyses Using F5 Gene
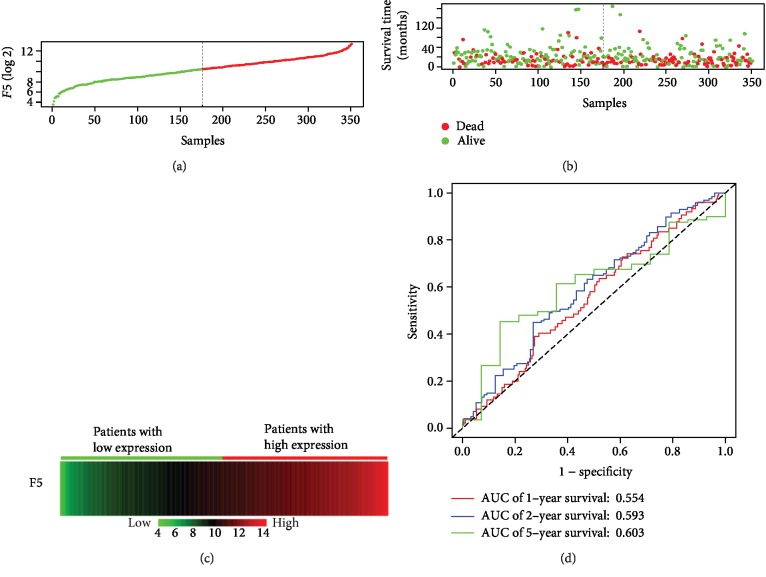
The baseline information of 351 GC patients is listed in Table 1. The clinical features including age (n (<60) = 108 vs. n (≥60) = 240), TNM stage (n (stage I) = 47 vs. n (stage II) = 109 vs. n (stage III) = 147 vs. n (stage IV = 35)), Pathological M (n (M1) = 312 vs. n (M0) = 24), Pathological T (n (T1/2) = 91 vs. n (T3/4) = 256), cancer status (n (no) = 206 vs. n (yes) = 118), radiation therapy (n (yes) = 62 vs. n (no) = 266) and targeted molecular therapy (n (yes) = 151 vs. n (no) = 175) were obtained and included in the multivariate Cox regression model after univariate survival analysis (Table 1). It was found that the high expression of the F5 gene was significantly correlated with the shorter survival rate of GC patients, poor prognosis (high vs. low; median survival time (MST): 22 months vs. 38 months), and high risk of death (crude P = 0.024, crude HR (95%CI) = 1.457 (1.048, 2.025), Table 1, Figure 2; adjusted P = 0.036, adjusted HR (95%CI) = 1.533 (1.029, 2.284), Table 2)). The results of gene expression and survival time of the patients and the expression heat map of F5 gene are presented in Figures 3(a)–3(c). The stratified results are shown in Table 3. Compared with the low-expression group, the high-expression group, comprising patients with pathological T3/4 (adjusted P = 0.03), pathological M0 (adjusted P = 0.049), stage IV (adjusted P = 0.031), GC patients treated with radiation therapy (adjusted P = 0.016), targeted molecular therapy (adjusted P = 0.03) and cancer-free survival (adjusted P = 0.007), had poorer prognosis. Notably, combining these clinical features and F5 improved the prognostic accuracy for GC OS. Time-dependent ROC curves were plotted to assess the prediction accuracy of F5 gene for prognosis of GC patients. The AUC of the time-dependent ROC curve at 1, 2, 5-year survival was medium as shown in Figure 3(d) (AUC: 0.554, 0.593, and 0.603, respectively).
Table 1.
Correlation between OS and clinicopathologic features of GC patients.
| Variables | Events/total (n = 351) | MST (months) | HR (95% CI) | Logrank P value |
|---|---|---|---|---|
| F5 | ||||
| Low | 64/176 | 38 | 1 | |
| High | 80/175 | 22 | 1.457 (1.048, 2.025) | 0.024 |
| Missing | 0 | |||
| Age (years) | ||||
| <60 | 36/108 | 60 | 1 | |
| ≥60 | 108/240 | 26 | 1.549 (1.061, 2.263) | 0.022 |
| Missing | 3 | |||
| Gender | ||||
| Female | 100/226 | 29 | 1 | |
| Male | 44/125 | 35 | 0.784 (0.55, 1.118) | 0.178 |
| Missing | 0 | |||
| Pathological T | ||||
| T 1/2 | 28/91 | 70 | 1 | |
| T 3/4 | 112/256 | 26 | 1.730 (1.138, 2.269) | 0.009 |
| Missing | 4 | |||
| Pathological N | ||||
| N0/N1 | 70/168 | 29 | 1 | |
| N2/N3 | 69/173 | 29 | 0.996 (0.714, 1.390) | 0.98 |
| Missing | 10 | |||
| Pathological M | ||||
| M0 | 13/24 | 13 | 1 | |
| M1 | 125/312 | 35 | 1.955 (1.103, 3.467) | 0.019 |
| Missing | 15 | |||
| TNM stage | ||||
| Stage I | 11/47 | 73 | 1 | |
| Stage II | 34/109 | 56 | 1.608 (0.813, 3.182) | <0.001 |
| Stage III | 69/147 | 26 | 2.435 (1.286, 4.61) | |
| Stage IV | 22/35 | 16 | 3.789 (1.836, 7.819) | |
| Missing | 13 | |||
| Histologic grade | ||||
| G1/G2 | 50/136 | 43 | 1 | |
| G3 | 90/206 | 26 | 1.366 (0.966, 1.932) | 0.077 |
| Missing | 9 | |||
| Radiation therapy | ||||
| Yes | 19/62 | NA | 1 | |
| No | 116/266 | 26 | 2.322 (1.418, 3.802) | 0.001 |
| Missing | 23 | |||
| Targeted molecular therapy | ||||
| Yes | 56/151 | 43 | 1 | |
| No | 78/175 | 26 | 1.489 (1.055, 2.1) | 0.022 |
| Missing | 25 | |||
| Tumour location | ||||
| Cardia | 36/84 | 26 | 1 | |
| Body | 50/123 | 28 | 0.916 (0.596, 1.407) | 0.919 |
| Antrum | 52/130 | 35 | 0.936 (0.611, 1.432) | |
| Missing | 14 | |||
| Histology | ||||
| Intestinal | 64/160 | 38 | 1 | |
| Diffuse | 24/61 | 60 | 1.001 (0.625, 1.603) | 0.057 |
| Signet ring cell | 8/11 | 13 | 2.515 (1.204, 5.251) | |
| Others | 48/118 | 26 | 1.287 (0.884, 1.875) | |
| Missing | 1 | |||
| MSI status | ||||
| MSS | 99/240 | 28 | 1 | |
| MSI-L | 22/51 | 29 | 1.263 (0.794, 2.007) | 0.225 |
| MSI-H | 23/59 | 35 | 0.756 (0.48, 1.191) | |
| Missing | 1 | |||
| Cancer status | ||||
| No | 35/206 | NA | 1 | |
| Yes | 86/118 | 17 | 5.526 (3.695, 8.264) | <0.001 |
| Missing | 27 |
Abbreviations: F5—Coagulation factor V; HR—hazard ratio; MST—median survival time; OS—overall survival; GC—gastric cancer.
Figure 2.
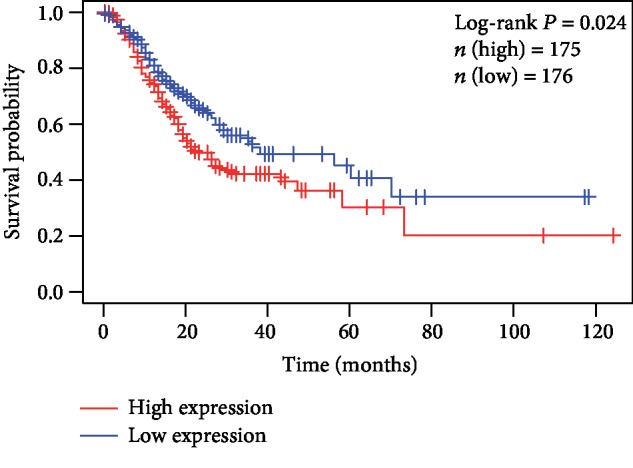
Kaplan-Meier survival curves of the F5 gene in gastric cancer datasets from The Cancer Genome Atlas (TCGA).
Table 2.
Multivariate analyses of F5 in the prediction of gastric cancer overall survival.
| Variables | HR (95% CI) | P value |
|---|---|---|
| F5 (high vs. low) | 1.533 (1.029, 2.284) | 0.036 |
| Age (years) (≥60 vs. <60) | 1.581 (1.029, 2.429) | 0.037 |
| Pathological M (M1 vs. M0) | 1.129 (0.407, 3.132) | 0.816 |
| Pathological T (T3/4 vs. T1/2) | 1.051 (0.559, 1.978) | 0.877 |
| TNM stage | ||
| Stage II vs. stage I | 2.058 (0.727, 5.830) | 0.174 |
| Stage III vs. stage I | 2.562 (0.895, 7.330) | 0.079 |
| Stage IV vs. stage I | 3.014 (0.931, 9.758) | 0.066 |
| Radiation therapy (no vs. yes) | 1.467 (0.771, 2.791) | 0.243 |
| Targeted molecular therapy (no vs. yes) | 1.367 (0.861, 2.170) | 0.185 |
| Cancer status (yes vs. no) | 5.193 (3.296, 8.183) | <0.001 |
Abbreviations: F5—Coagulation factor V; HR—hazard ratio; CI—confidence interval; T—tumour; N—node; M—metastasis.
Figure 3.
Prognostic value of F5 in patients' dataset from TCGA cohort (n = 351). (a) F5 gene distribution; (b) patient overall survival status and survival time. The dotted line divides the patients into low-expression and high-expression groups based on median gene expression. (c) Gene expression heat map of the F5 expression profiles. Rows represent the F5 gene, and columns represent patients. As the gene expression of F5 rose, the death number of the high-expression group increased, while the OS decreased. (d) Receiver operating characteristic curve was used to predict overall survival in gastric cancer patients based on F5 expression level. TCGA: The Cancer Genome Atlas; F5: Coagulation factor V.
Table 3.
Stratified analysis of F5 genes and OS in GC patients.
| Group | Low | High | Crude HR (95% CI) | Crude P value | Adjusted HR (95% CI) | Adjusted P valuea |
|---|---|---|---|---|---|---|
| Age (years) | ||||||
| <60 | 53 | 55 | 1.315 (0.68, 2.545) | 0.416 | 1.878 (0.883, 3.994) | 0.102 |
| ≥60 | 121 | 119 | 1.459 (0.996, 2.136) | 0.052 | 1.446 (0.949, 2.202) | 0.086 |
| Pathological T | ||||||
| T 1/2 | 52 | 39 | 1.332 (0.632, 2.805) | 0.451 | 1.164 (0.483, 2.806) | 0.735 |
| T 3/4 | 120 | 136 | 1.39 (0.96, 2.01) | 0.81 | 1.56 (1.043, 2.334) | 0.03 |
| Pathological M | ||||||
| M0 | 11 | 13 | 0.418 (0.128, 1.37) | 0.15 | 13.597 (1.012, 182.75) | 0.049 |
| M1 | 159 | 153 | 1.373 (0.965, 1.953) | 0.078 | 1.357 (0.925, 1.991) | 0.119 |
| TNM stage | ||||||
| Stage I | 28 | 19 | 1.726 (0.51, 5.839) | 0.38 | 7.483 (0.732, 76.529) | 0.09 |
| Stage II | 59 | 50 | 1.28 (0.652, 2.513) | 0.474 | 1.235 (0.625, 2.438) | 0.544 |
| Stage III | 68 | 79 | 1.439 (0.891, 2.324) | 0.137 | 1.318 (0.798, 2.177) | 0.281 |
| Stage IV | 14 | 21 | 1.852 (0.71, 4.83) | 0.207 | 3.856 (1.135, 13.101) | 0.031 |
| Radiation therapy | ||||||
| Yes | 30 | 32 | 3.389 (1.207, 9.522) | 0.021 | 4.607 (1.323, 16.035) | 0.016 |
| No | 137 | 129 | 1.282 (0.89, 1.847) | 0.182 | 1.345 (0.913, 1.981) | 0.133 |
| Targeted molecular therapy | ||||||
| Yes | 85 | 66 | 1.558 (0.919, 2.641) | 0.099 | 1.885 (1.065, 3.338) | 0.03 |
| No | 82 | 93 | 1.3 (0.829, 2.04) | 0.254 | 1.35 (0.839, 2.17) | 0.216 |
| Cancer status | ||||||
| No | 108 | 98 | 2.515 (1.25, 5.061) | 0.01 | 2.852 (1.327, 6.127) | 0.007 |
| Yes | 54 | 64 | 1.366 (0.884, 2.112) | 0.161 | 1.277 (0.801, 2.037) | 0.304 |
aAdjusted for age, TNM stage, radiation therapy, and targeted molecular therapy; the missing patients of these clinical parameters are the same as Table 1. Abbreviations: F5—Coagulation factor V; HR—hazard ratio; OS—overall survival; GC—gastric cancer.
3.3. KM-Plotter Survival Analyses
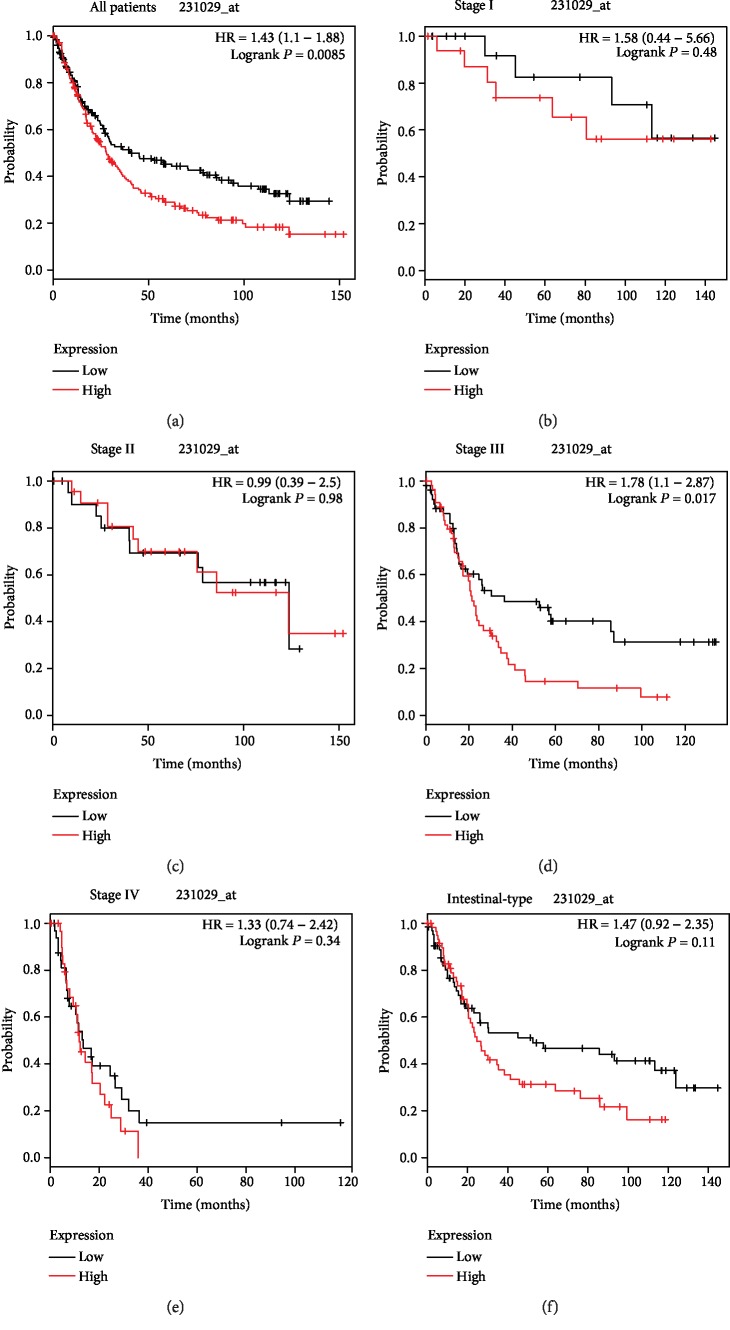
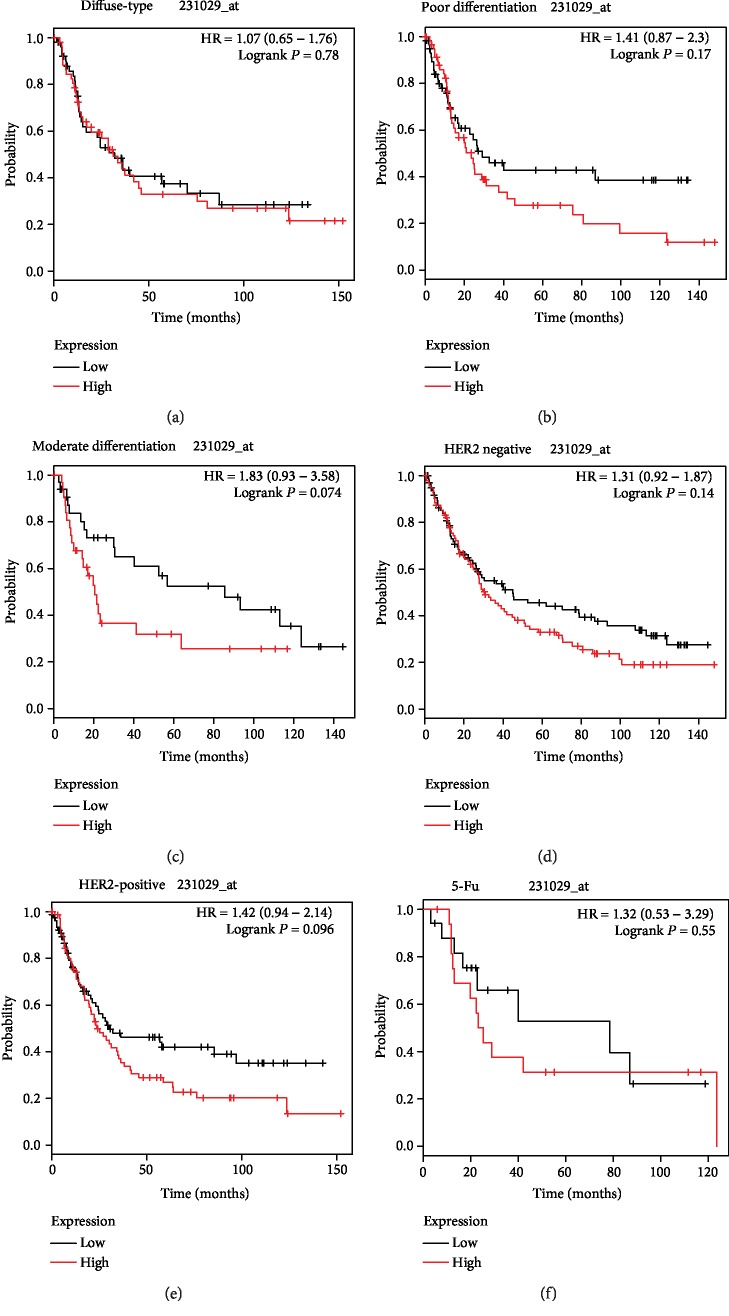
Subsequently, the F5 gene was submitted to the KM-plotter online website. The affymetrix ID 231029_at was employed to further explore the prognostic potential of the F5 gene by assessing its correlation with various clinical variables of GC patients. As shown in Figure 4 and Table 4, a favourable OS was observed in all GC patients with a high expression of the F5 gene (HR (95%CI) = 1.43 (1.1 − 1.88), P = 0.0085, Figure 4(a)). GC samples were subcategorized according to the variables for survival analysis. Briefly, samples were divided into TNM stage, Lauren classification, differentiation, etc. It was found that the F5 gene could predict the prognosis of subjects in stage III (HR (95%CI) = 1.78 (1.1 − 2.87), P = 0.017, Figure 4(d)). However, the remaining clinical features had no statistical significance on OS between the high F5 gene expression and low-expression groups (Figures 4(b), 4(c), 4(e), and 4(f) and Figures 5(a)–5(f)).
Figure 4.
Prognostic value of the F5 (231029_at) expression determined by the Kaplan-Meier plotter tool. Overall survival curves for (a) all patients and patients in (b) stage I, (c) stage II, (d) stage III, (e) and stage IV, and (f) their intestinal type. F5: Coagulation factor V.
Table 4.
The prognostic value of the mRNA expression of F5 in various clinical features GC patients from KM-plotter.
| Group | Low | High | HR (95% CI) | P value |
|---|---|---|---|---|
| All | 177 | 171 | 1.43 (1.1−1.88) | 0.0085 |
| Histology | ||||
| Intestinal | 65 | 63 | 1.47 (0.92−2.35) | 0.11 |
| Diffuse | 52 | 53 | 1.07 (0.65−1.76) | 0.78 |
| Mixed | 11 | 11 | 1.84 (0.45−7.44) | 0.39 |
| TNM stage | ||||
| Stage I | 17 | 17 | 1.58 (0.44−5.66) | 0.48 |
| Stage II | 22 | 22 | 0.99 (0.39−2.5) | 0.98 |
| Stage III | 54 | 55 | 1.78 (1.1−2.87) | 0.017 |
| Stage IV | 34 | 32 | 1.33 (0.74−2.42) | 0.34 |
| HER2 status | ||||
| Negative | 99 | 96 | 1.31 (0.92−1.87) | 0.14 |
| Positive | 78 | 75 | 1.42 (0.94−2.14) | 0.096 |
| Differentiation | ||||
| Poorly | 60 | 61 | 1.41 (0.87−2.3) | 0.17 |
| Moderately | 34 | 33 | 1.83 (0.93−3.58) | 0.074 |
| Well | 2 | 3 | ||
| 5-Fu treatment | 17 | 17 | 1.32 (0.53–3.29) | 0.55 |
Abbreviations: F5—Coagulation factor V; HR—hazard ratio; OS—overall survival; GC—gastric cancer, T—tumour; N—node; M—metastasis.
Figure 5.
Prognostic value of the F5 (231029_at) expression determined by the Kaplan-Meier plotter tool. Overall survival curves for (a) diffuse-type, (b) poor differentiation, (c) moderate differentiation, (d) HER2-negative, (e) HER2-positive, and (f) 5-Fu treatment gastric cancer. F5: Coagulation factor V.
3.4. Genome-Wide Coexpression Analysis Result
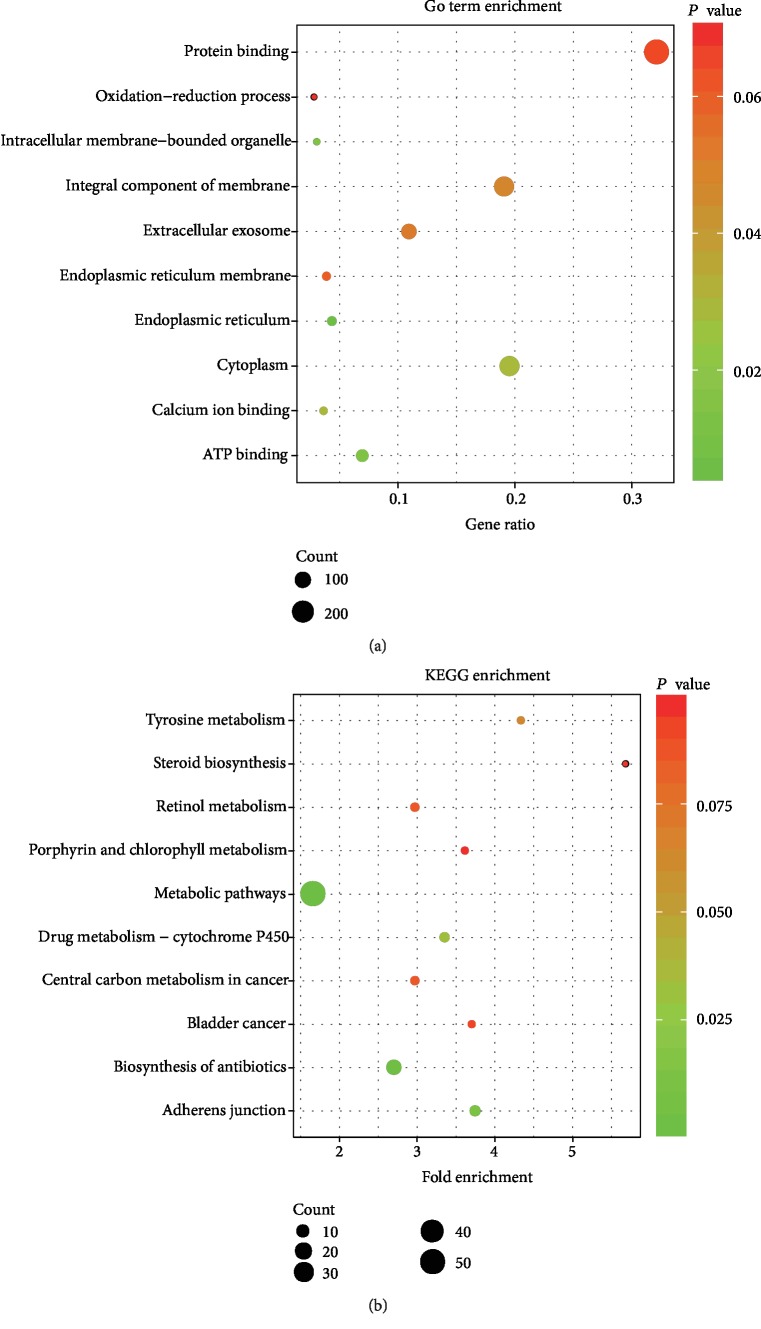
A total of 590 coexpressed genes were identified by coexpression analysis, and the results of the enrichment analysis are presented in Figure 6. Notably, the GO analysis indicated that coexpression of the F5 gene was mainly enriched in protein binding, cytoplasm, integral component of the membrane, extracellular exosome, ATP binding, and oxidation-reduction process (Figure 6(a)). KEGG analysis revealed that the F5 gene was enriched in pathways such as metabolic pathways, biosynthesis of antibiotics, drug metabolism-cytochrome P450, and adherens junction (Figure 6(b)).
Figure 6.
GO and KEGG analysis of genes coexpressed with F5. (a) GO enrichment analysis. (b) KEGG enrichment analysis. The “count” represents the number of genes significantly enriched in GO and KEGG. F5: coagulation factor V; GO: Gene Ontology; KEGG: Kyoto Encyclopedia of Genes and Genomes.
3.5. GSEA
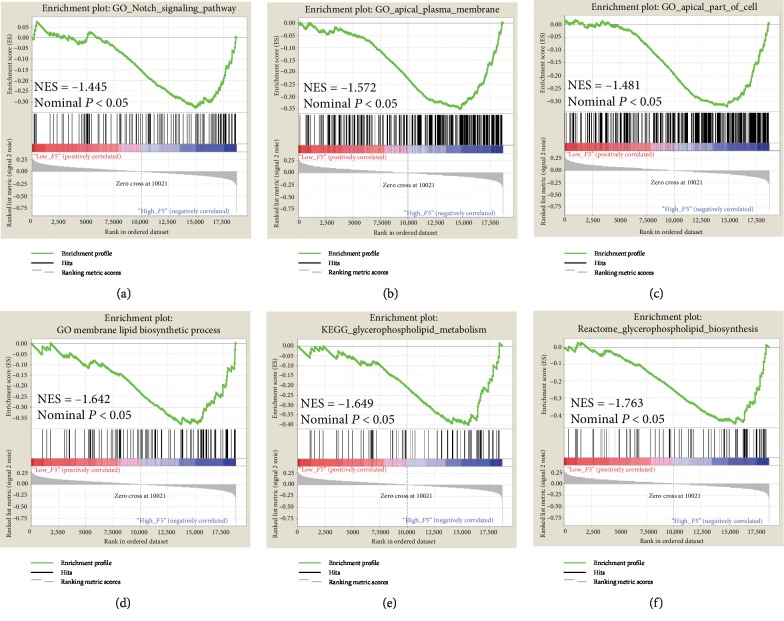
The results of single gene set enrichment analysis are shown in Figure 7. In the c5 category, the F5 gene was enriched in the Notch signalling pathway (Figure 7(a)), apical plasma membrane (Figure 7(b)), apical part of cell (Figure 7(c)), and membrane lipid biosynthetic process (Figure 7(d)) in the GO dataset, while in the c2 category, the F5 gene was associated with reactome glycerophospholipid biosynthesis (Figure 7(e)) and glycerophospholipid metabolism (Figure 7(f)) in the KEGG dataset. This indicates that the potential mechanisms of F5 are likely mediated through their influence on the tight junction among cells and the glycerophospholipid metabolism pathway.
Figure 7.
GSEA analysis of F5 in gastric cancer patients using TCGA database. The GO terms including (a) “Notch signaling pathway,” (b) “apical plasma membrane,” (c) “apical part of cell,” and (d) “membrane lipid biosynthetic process” and the KEGG terms including (e) “reactome glycerophospholipid biosynthesis” and (f) “glycerophospholipid metabolism” were enriched in the F5 high-expression phenotype. F5: Coagulation factor V; GO: Gene Ontology; KEGG: Kyoto Encyclopedia of Genes and Genomes; ES: enrichment score; GSEA: gene set enrichment analysis; NES: normalized enrichment score.
4. Discussion
Previous studies have reported that cancer-induced hemostatic activity promotes tumour growth and metastasis in patients. It has also been demonstrated that tissue factor (TF) regulates VEGF synthesis and enhances its level in tumour cells [4, 18] [19]. Activation of F5, a Janus-faced protein in the coagulation cascade, not only promotes the production of thrombin as the cofactor of FXa but also inactivates FVIIIa and FVa as anticoagulant cofactors of the activated protein C (APC) [3, 20]. So far, few studies have explored the prognostic value of the F5 gene expression in cancer patients. This study reveals that the high expression of F5 in gastric cancer predicts poor survival time.
F5 has been found to be an oncogene. Tinholt et al. analysed a cohort of 1100 breast cancer samples from TCGA and found that the expression of F5 mRNA was about 2-fold higher in breast tumours compared to normal tissues, and its expression increased in patients with late stage tumours [7]. Klee et al. also found that the F5 gene was upregulated in cancer tissue compared to nonneoplastic prostate tissue [21]. Here, we show that F5 is highly expressed in gastric cancer tissue and this strongly correlates with advanced TNM stage and shorter OS. The ROC curve reveals that the F5 gene can distinguish tumour from normal tissues with an AUC of 0.705. These findings indicate that F5 may be a possible therapeutic target for GC.
A couple of previous studies have reported the F5 gene as a risk marker of cancer. For instance, Vossen et al. demonstrated that the F5 gene polymorphism is associated with the susceptibility to colorectal cancer in a German population compared with controls, and similar results were obtained for breast cancer [22, 23]. However, other researchers found that F5 is not a risk factor for cancers such as gynaecological and oral cancers and gliomas [24–28]. Thus, it is likely that F5 may contribute to tumourigenesis. Interestingly, our study shows that the high expression of F5 is correlated with a poor OS in GC, and this contradicts a previous study in which high F5 expression improved OS for the basal type of tumours in breast cancer according to the KM-plotter website [7]. However, this could have been caused by failure to exclude other confounding factors and the use of only univariate survival analysis in the study. A comprehensive analysis of F5 in gastric cancer is therefore advocated. Further analysis using the KM-plotter survival analysis was performed revealing that the high expression of F5 correlated with shorter OS for all GC samples and stage III GC. Remarkably, no statistical significance is observed in the rest of the clinical features in the KM-plotter database, but the HR of these variables is higher than one, indicating a high risk of death. For patients in stage III, the P value of survival analysis determined by KM-plotter was less than 0.05, but not for TCGA. Yet, the overall risk of stage III patients from TCGA was also higher than one (HR = 1.318), and it is similar to that from the KM-plotter website (HR = 1.78). As the sample size increases, the P value may be less than 0.05. Hence, this needs further clarification through large scale clinical trials. The time-dependent ROC revealed that F5 could predict the OS in GC. These findings show that F5 may be an independent prognostic factor that negatively predicts survival time in GC patients.
The GSEA is a platform used to identify biological processes. Here, GSEA analysis showed that the high expression of F5 was related to the activation of the Notch signalling pathway and the promotion of membrane lipid biosynthetic process, apical plasma membrane, apical junction complex, reactome glycerophospholipid biosynthesis, and glycerophospholipid metabolism. Genome-wide coexpression analysis indicated that the coexpressed genes play important roles in an integral component of the membrane and metabolic pathways. Several studies have demonstrated the relationship between these biological mechanisms and cancer prognosis. A previous meta-analysis has implicated the participation of the activated Notch signalling pathway in the progression of gastric cancer [29]. Li et al. also showed that the activation of the Notch signalling pathway regulates the development and progression of gastric cancer [30]. Tight junctions (TJ) located between cells play important roles in paracellular solute transport and cell polarity maintenance. Therefore, defects in TJ structure and function trigger cancer initiation and development [31]. Our results show that the F5 gene is enriched in tight junction-related pathways, such as the apical junction complex. It is well known that the fatty acid metabolism pathway contributes to the development of cancer [32]. Shu et al. found that abnormal metabolic regulation of glycerophospholipids is associated with the pathogenesis of colorectal cancer [33]. Inhibition of glycerophospholipid biosynthesis by a key enzyme of lysophosphatidic acid acyltransferase β (LPAAT-β) may be a potential therapeutic target for osteosarcoma patients [34]. Henderson et al. found that glycerophospholipid metabolism is enhanced in melanocyte neoplasia in zebrafish where it accelerates tumour progression [35]. Enrichment analysis results show that biosynthesis and metabolism of glycerophospholipids are among the biological pathways involved in cancer progression. Therefore, we speculate that F5, as a potential oncogene, may affect the prognosis of cancer patients through these biological pathways and overexpression of F5 would lead to poor prognosis in GC.
The current study has some limitations. Firstly, the outcomes of survival analysis need further verification because all the research data used were from an open database. Secondly, the mechanism of F5 regulation in tumourigenesis and the progression of gastric cancer were not further explored. Thirdly, the KM plotter data was from multiple databases and the samples were probably collected at different places using different protocols. Fourthly, as TCGA cohort was unable to obtain the clinical information of postoperative chemotherapy of gastric cancer patients, we could not find the relationship between the expression level of the F5 gene and the prognosis of gastric cancer patients receiving postoperative chemotherapy. Meanwhile, as only 34 gastric cancer patients treated with postoperative chemotherapy were provided on the KM-plotter website and the sample size was small, the significant correlation between the expression level of F5 and the prognosis of gastric cancer patients treated with 5-FU-based chemotherapy could not be observed.
Despite these limitations, this is the first study to reveal the association of F5 mRNA expression with the clinical outcome of GC patients. Univariate and multivariate survival analyses reveal that F5 is an independent prognostic factor for OS of GC patients. This conclusion was verified on the KM-plotter website. Thus, F5 may serve as a potential therapeutic target in GC. The genome-wide coexpression and GSEA analysis were also used to reveal the biological pathways that underlie the prognostic role of the F5 gene for OS in GC patients, which can provide guidance for the exploration of its mechanism in the future. Once these results are confirmed, we anticipate that F5 will be applied in clinical settings to monitor the prognosis and develop management and therapeutic strategies for GC.
5. Conclusions
In conclusion, the current findings show that the F5 gene is upregulated in GC tumour tissues and may be a potential prognostic biomarker for GC. However, these results require further verification.
Acknowledgments
The authors thank the contributors of the KM-plotter (http://kmplot.com/analysis/index.php?p=service& cancer=gastric) and TCGA (https://cancergenome.nih.gov/) for sharing the gastric cancer data on open access. This work was supported in part by the Self-Raised Scientific Research Fund of the Health and Family Planning Commission of Guangxi Zhuang Autonomous Region (Z2014253) and the Scientific Research Fund of the Health and Family Planning Commission of Guangxi Zhuang Autonomous Region (S2017096).
Data Availability
The data used to support the findings of this study are available from the corresponding author.
Conflicts of Interest
The authors declare that they have no conflicts of interest.
References
- 1.Torre L. A., Bray F., Siegel R. L., Ferlay J., Lortet-Tieulent J., Jemal A. Global cancer statistics, 2012. CA: a Cancer Journal for Clinicians. 2015;65(2):87–108. doi: 10.3322/caac.21262. [DOI] [PubMed] [Google Scholar]
- 2.Chen W., Zheng R., Baade P. D., et al. Cancer statistics in China, 2015. CA: a Cancer Journal for Clinicians. 2016;66(2):115–132. doi: 10.3322/caac.21338. [DOI] [PubMed] [Google Scholar]
- 3.Cramer T. J., Gale A. J. The anticoagulant function of coagulation factor V. Thrombosis and Haemostasis. 2012;107(1):15–21. doi: 10.1160/TH11-06-0431. [DOI] [PubMed] [Google Scholar]
- 4.Tas F., Ciftci R., Kilic L., Serilmez M., Karabulut S., Duranyildiz D. Clinical and prognostic significance of coagulation assays in gastric cancer. Journal of Gastrointestinal Cancer. 2013;44(3):285–292. doi: 10.1007/s12029-013-9490-x. [DOI] [PubMed] [Google Scholar]
- 5.Miller G. J., Bauer K. A., Howarth D. J., Cooper J. A., Humphries S. E., Rosenberg R. D. Increased incidence of neoplasia of the digestive tract in men with persistent activation of the coagulant pathway. Journal of Thrombosis and Haemostasis. 2004;2(12):2107–2114. doi: 10.1111/j.1538-7836.2004.01011.x. [DOI] [PubMed] [Google Scholar]
- 6.Tinholt M., Sandset P. M., Iversen N. Polymorphisms of the coagulation system and risk of cancer. Thrombosis Research. 2016;140:S49–S54. doi: 10.1016/S0049-3848(16)30098-6. [DOI] [PubMed] [Google Scholar]
- 7.Tinholt M., Garred Ø., Borgen E., et al. Subtype-specific clinical and prognostic relevance of tumor-expressed F5 and regulatory F5 variants in breast cancer: the CoCaV study. Journal of Thrombosis and Haemostasis. 2018;16(7):1347–1356. doi: 10.1111/jth.14151. [DOI] [PubMed] [Google Scholar]
- 8.Koizume S., Jin M. S., Miyagi E., et al. Activation of cancer cell migration and invasion by ectopic synthesis of coagulation factor VII. Cancer Research. 2006;66(19):9453–9460. doi: 10.1158/0008-5472.CAN-06-1803. [DOI] [PubMed] [Google Scholar]
- 9.Bazzarelli A. K., Scheer A. S., Tai L. H., et al. Tissue factor pathway inhibitor gene polymorphism -33T→C predicts improved disease-free survival in colorectal cancer. Annals of Surgical Oncology. 2016;23(7):2274–2280. doi: 10.1245/s10434-016-5169-4. [DOI] [PubMed] [Google Scholar]
- 10.Ay C., Dunkler D., Pirker R., et al. High D-dimer levels are associated with poor prognosis in cancer patients. Haematologica. 2012;97(8):1158–1164. doi: 10.3324/haematol.2011.054718. [DOI] [PMC free article] [PubMed] [Google Scholar]
- 11.Sakurai M., Satoh T., Matsumoto K., et al. High pretreatment plasma D-dimer levels are associated with poor prognosis in patients with ovarian cancer independently of venous thromboembolism and tumor extension. International Journal of Gynecological Cancer. 2015;25(4):593–598. doi: 10.1097/IGC.0000000000000415. [DOI] [PMC free article] [PubMed] [Google Scholar]
- 12.Leppert U., Eisenreich A. The role of tissue factor isoforms in cancer biology. International Journal of Cancer. 2015;137(3):497–503. doi: 10.1002/ijc.28959. [DOI] [PubMed] [Google Scholar]
- 13.The Cancer Genome Atlas Research Network. Comprehensive molecular characterization of gastric adenocarcinoma. Nature. 2014;513(7517):202–209. doi: 10.1038/nature13480. [DOI] [PMC free article] [PubMed] [Google Scholar]
- 14.Anders S., Huber W. Differential expression analysis for sequence count data. Genome Biology. 2010;11(10):p. R106. doi: 10.1186/gb-2010-11-10-r106. [DOI] [PMC free article] [PubMed] [Google Scholar]
- 15.Dennis G., Jr., Sherman B. T., Hosack D. A., et al. DAVID: database for annotation, visualization, and integrated discovery. Genome Biology. 2003;4(5) doi: 10.1186/gb-2003-4-5-p3. [DOI] [PubMed] [Google Scholar]
- 16.Mootha V. K., Lindgren C. M., Eriksson K. F., et al. PGC-1alpha-responsive genes involved in oxidative phosphorylation are coordinately downregulated in human diabetes. Nature Genetics. 2003;34(3):267–273. doi: 10.1038/ng1180. [DOI] [PubMed] [Google Scholar]
- 17.Subramanian A., Tamayo P., Mootha V. K., et al. Gene set enrichment analysis: a knowledge-based approach for interpreting genome-wide expression profiles. Proceedings of the National Academy of Sciences of the United States of America. 2005;102(43):15545–15550. doi: 10.1073/pnas.0506580102. [DOI] [PMC free article] [PubMed] [Google Scholar]
- 18.Falanga A., Marchetti M., Vignoli A., Balducci D. Clotting mechanisms and cancer: implications in thrombus formation and tumor progression. Clinical Advances in Hematology & Oncology. 2003;1(11):673–678. [PubMed] [Google Scholar]
- 19.Rickles F. R., Shoji M., Abe K. The role of the hemostatic system in tumor growth, metastasis, and angiogenesis: tissue factor is a bifunctional molecule capable of inducing both fibrin deposition and angiogenesis in cancer. International Journal of Hematology. 2001;73(2):145–150. doi: 10.1007/bf02981930. [DOI] [PubMed] [Google Scholar]
- 20.Nicolaes G. A., Dahlback B. Factor V and thrombotic Disease. Arteriosclerosis, Thrombosis, and Vascular Biology. 2002;22(4):530–538. doi: 10.1161/01.ATV.0000012665.51263.B7. [DOI] [PubMed] [Google Scholar]
- 21.Klee E. W., Bondar O. P., Goodmanson M. K., et al. Candidate serum biomarkers for prostate adenocarcinoma identified by mRNA differences in prostate tissue and verified with protein measurements in tissue and blood. Clinical Chemistry. 2012;58(3):599–609. doi: 10.1373/clinchem.2011.171637. [DOI] [PMC free article] [PubMed] [Google Scholar]
- 22.Vossen C. Y., Hoffmeister M., Chang-Claude J. C., Rosendaal F. R., Brenner H. Clotting factor gene polymorphisms and colorectal cancer risk. Journal of Clinical Oncology. 2011;29(13):1722–1727. doi: 10.1200/JCO.2010.31.8873. [DOI] [PubMed] [Google Scholar]
- 23.Tinholt M., Viken M. K., Dahm A. E., et al. Increased coagulation activity and genetic polymorphisms in the F5, F10 and EPCRgenes are associated with breast cancer: a case-control study. BMC Cancer. 2014;14(1) doi: 10.1186/1471-2407-14-845. [DOI] [PMC free article] [PubMed] [Google Scholar]
- 24.Pihusch R., Danzl G., Scholz M., et al. Impact of thrombophilic gene mutations on thrombosis risk in patients with gastrointestinal carcinoma. Cancer. 2002;94(12):3120–3126. doi: 10.1002/cncr.10590. [DOI] [PubMed] [Google Scholar]
- 25.Sciacca F. L., Ciusani E., Silvani A., et al. Genetic and plasma markers of venous thromboembolism in patients with high grade glioma. Clinical Cancer Research. 2004;10(4):1312–1317. doi: 10.1158/1078-0432.ccr-03-0198. [DOI] [PubMed] [Google Scholar]
- 26.Vairaktaris E., Yapijakis C., Wiltfang J., et al. Are factor V and prothrombin mutations associated with increased risk of oral cancer? Anticancer Research. 2005;25(3c):2561–2565. [PubMed] [Google Scholar]
- 27.Battistelli S., Stefanoni M., Genovese A., Vittoria A., Cappelli R., Roviello F. Prevalence of factor V Leiden and prothrombin G20210A in patients with gastric cancer. World Journal of Gastroenterology. 2006;12(26):4179–4180. doi: 10.3748/wjg.v12.i26.4179. [DOI] [PMC free article] [PubMed] [Google Scholar]
- 28.Tormene D., Beltramello P., Perlati M., et al. The risk of cancer progression in women with gynecological malignancies and thrombophilic polymorphisms: a pilot case-control study. Clinical and Applied Thrombosis/Hemostasis. 2009;15(5):535–539. doi: 10.1177/1076029608317941. [DOI] [PubMed] [Google Scholar]
- 29.Du X., et al. Role of Notch signaling pathway in gastric cancer: a meta-analysis of the literature. World Journal of Gastroenterology. 2014;20(27):9191–9199. doi: 10.3748/wjg.v20.i27.9191. [DOI] [PMC free article] [PubMed] [Google Scholar]
- 30.Li W., Wang D., Sun X., Zhang Y., Wang L., Suo J. ADAM17 promotes lymph node metastasis in gastric cancer via activation of the Notch and Wnt signaling pathways. International Journal of Molecular Medicine. 2019;43(2):914–926. doi: 10.3892/ijmm.2018.4028. [DOI] [PMC free article] [PubMed] [Google Scholar]
- 31.Hu C., Zhou Y., Liu C., Kang Y. A novel scoring system for gastric cancer risk assessment based on the expression of three CLIP4 DNA methylation-associated genes. International Journal of Oncology. 2018;53(2):633–643. doi: 10.3892/ijo.2018.4433. [DOI] [PMC free article] [PubMed] [Google Scholar]
- 32.Currie E., Schulze A., Zechner R., Walther T. C., Farese RV Jr Cellular fatty acid metabolism and cancer. Cell Metabolism. 2013;18(2):153–161. doi: 10.1016/j.cmet.2013.05.017. [DOI] [PMC free article] [PubMed] [Google Scholar]
- 33.Shu X., Xiang Y. B., Rothman N., et al. Prospective study of blood metabolites associated with colorectal cancer risk. International Journal of Cancer. 2018;143(3):527–534. doi: 10.1002/ijc.31341. [DOI] [PMC free article] [PubMed] [Google Scholar]
- 34.Springett G. M., Bonham L., Hummer A., et al. Lysophosphatidic acid acyltransferase-beta is a prognostic marker and therapeutic target in gynecologic malignancies. Cancer Research. 2005;65(20):9415–9425. doi: 10.1158/0008-5472.CAN-05-0516. [DOI] [PubMed] [Google Scholar]
- 35.Henderson F., Johnston H. R., Badrock A. P., et al. Enhanced fatty acid scavenging and glycerophospholipid metabolism accompany melanocyte neoplasia progression in zebrafish. Cancer Research. 2019;79(9):2136–2151. doi: 10.1158/0008-5472.CAN-18-2409. [DOI] [PubMed] [Google Scholar]
Associated Data
This section collects any data citations, data availability statements, or supplementary materials included in this article.
Data Availability Statement
The data used to support the findings of this study are available from the corresponding author.


