

Abstract
Neuronal loss is the best neuropathological substrate that correlates with cortical atrophy and dementia in Alzheimer's disease (AD). Defective GABAergic neuronal functions may lead to cortical network hyperactivity and aberrant neuronal oscillations and in consequence, generate a detrimental alteration in memory processes. In this study, using immunohistochemical and stereological approaches, we report that the two major and non‐overlapping groups of inhibitory interneurons (SOM‐cells and PV‐cells) displayed distinct vulnerability in the perirhinal cortex of APP/PS1 mice and AD patients. SOM‐positive neurons were notably sensitive and exhibited a dramatic decrease in the perirhinal cortex of 6‐month‐old transgenic mice (57% and 61% in areas 36 and 35, respectively) and, most importantly, in AD patients (91% in Braak V–VI cases). In addition, this interneuron degenerative process seems to occur in parallel, and closely related, with the progression of the amyloid pathology. However, the population expressing PV was unaffected in APP/PS1 mice while in AD brains suffered a pronounced and significant loss (69%). As a key component of cortico‐hippocampal networks, the perirhinal cortex plays an important role in memory processes, especially in familiarity‐based memory recognition. Therefore, disrupted functional connectivity of this cortical region, as a result of the early SOM and PV neurodegeneration, might contribute to the altered brain rhythms and cognitive failures observed in the initial clinical phase of AD patients. Finally, these findings highlight the failure of amyloidogenic AD models to fully recapitulate the selective neuronal degeneration occurring in humans.
Keywords: Alzheimer, GABA, human brain, interneuron, parvalbumin, somatostatin, transentorhinal cortex, transgenic mouse
Abbreviations
- Abeta
amyloid‐beta
- AD
Alzheimer's disease
- ANOVA
analysis of variance
- DAB
diaminobenzidine tetrahydrochloride
- GABA
gamma‐aminobutyric acid
- hAPP
human amyloid precursor protein
- nNOS
neuronal nitric oxide synthase
- SOM
somatostatin
- SD
standard deviation
- PBS
phosphate‐buffered saline
- PV
parvalbumin
- WT
wildtype
Introduction
Alzheimer's disease (AD) is characterized by cognitive deficits that are correlated with aberrant neuronal network activity, which might relate to dysfunction of GABAergic neurons 2, 60. Inhibitory signal plays a fundamental role in the generation of cerebral rhythmic oscillations, so a defective inhibition, because of the loss or low activity of GABAergic interneurons, can lead to networks abnormalities. Impaired inhibition has been proposed as a potential mechanism of network hyperactivity, and human studies indicate that network hyperactivity is an early event in AD pathogenesis which could produce a detrimental alteration in cognitive functions 60, 84.
The two prominent and non‐overlapping groups of inhibitory interneurons, the fast‐spiking parvalbumin (PV)‐expressing neurons, which provide powerful perisomatic inhibition of pyramidal cells and the somatostatin (SOM)‐expressing neurons, which confer distal dendritic inhibition, are critically involved in memory and learning processes 42, 58, 87. The contribution of the loss/dysfunction of these GABAergic subpopulations to AD pathophysiology is not resolved yet. Loss of SOM neurons has been described in the frontal cortex 44 and olfactory regions 67, 68 of AD patients. However, reports are controversial regarding PV interneurons ranging from substantial loss to unchanged, or even increased, amounts of these cells 35, 54, 67, 70. This controversy could be because of the brain region analyzed and/or to the lack of stereological approaches for the cell quantification. We have previously reported a differential vulnerability of these interneurons (marked loss of SOM neurons and preservation of PV cell density) by stereology in both the hippocampus and entorhinal cortex of an AD model 55, 63, 82. Here, we extended our analysis to another cortical region early affected by AD pathology, the perirhinal cortex. This is a subregion of the parahippocampal gyrus composed of two subdivisions, Brodmann areas 35 and 36, also known as transentorhinal cortex and ectorhinal cortex, respectively, and represents an important component of the medial temporal memory system, linking sensory association cortices with the hippocampal formation 78. This cortical region plays an essential role in higher cognitive functions including episodic memory (recollection), semantic memory (familiarity) and visual perceptual processing systems 19, 41, 56, indeed, lesions of the perirhinal cortex lead to recognition memory impairment 22, 33, 78. Despite its relevance in memory processes, and the fact that the area 35 of the perirhinal cortex is the first cortical region to be affected by neurofibrillary pathology in AD patients (Braak I stage) 9, 10 the perirhinal cortex has been, however, surprisingly understudied at the neuropathological level in AD patients or animal models, and no studies have been performed so far to determine the AD‐associated GABAergic neuronal vulnerability in this cortical region.
In the present study we analyzed, by immunohistochemistry and stereological methods, the two main and non‐overlapping inhibitory neuronal populations, SOM neurons and PV neurons, in the perirhinal cortex of APP/PS1 mice and AD patients. Our data demonstrated that SOM and PV interneurons presented different vulnerability to the AD‐like pathology. SOM cells exhibited a dramatic decline in both APP/PS1 mice and AD individuals. However, the population expressing PV was unaffected in the amyloidogenic model while in patients suffered a marked degenerative process. The high vulnerability of these GABAergic interneurons in AD brains may have substantial functional repercussions on local inhibitory mechanisms and memory function, contributing to the recognition memory failure in AD patients.
Materials and Methods
Transgenic mice
Transgenic APP751SwedLond/PS1M146L mice (APP/PS1) were used. Characterization of these transgenic mice have been previously reported 5, 8, 55, 63, 72, 82. These APP/PS1 mice were obtained by crossing heterozygotic Thy1‐APP751SL (Swedish‐K670N, M671L‐ and London‐V717I‐FAD mutations) mice with homozygous PS1M146L mice (Charles River, France). Both lines were maintained on a C57BL/6 J background. Non‐transgenic (wildtype; WT) mice of the same genetic background and ages were used as controls. After deep anesthesia with sodium pentobarbital (60 mg/kg), 4‐, 6‐ and 12‐month‐old APP/PS1 (n = 6/age) and WT (n = 8/age) mice were perfused transcardially with 4% paraformaldehyde, 75mM of lysine, 10mM of sodium metaperiodate in 0.1M of phosphate buffer (PB), pH 7.4. Brains were post‐fixed overnight in the same fixative at 4°C, cryoprotected in 30% of sucrose and then sectioned (40 μm thickness) in the coronal plane on a freezing microtome. All animal experiments were performed in accordance with the Spanish and the European Union regulations (RD53/2013 and 2010/63/UE) and approved by the Animal Research Committee from the University of Malaga (Spain). Experiments and procedures with animals were designed to minimize the animal suffering and reduce the number of animals used.
Human samples
Human brain autopsy specimens (parahippocampal gyrus) were obtained from the Neurological Tissue Bank of IDIBELL‐Hospital of Bellvitge (Barcelona, Spain). Samples (see Table S1 for demographic information) included cognitively normal subjects with no (Braak 0; n = 2; mean age 52 ± 8.2 years) or early (Braak II; n = 5; mean age 82.2 ± 4.1 years) tau pathology, more advanced tau pathology but clinically not demented individuals (Braak III–IV; n = 6; mean age 76.5 ± 7.3 years) and demented AD patients (Braak V–VI; n = 6; mean age 75.3 ± 13.9 years). The middle age Braak 0 individuals (free of any known neurological or psychiatric illness and no pathological diagnostic criteria) and the aged Braak II individuals were used as controls. Samples were fixed in cold 4% of paraformaldehyde in 0.1 M PB for 24–48 h, cryoprotected in sucrose, stored at −80°C, sectioned (30 µm thickness) on a freezing microtome and serially collected in wells containing 0.1 M of phosphate buffer saline (PBS) and 0.02% of sodium azide. The utilization of post‐mortem human samples was approved by the biobank and local ethic committees following Spanish legislation.
Anatomical boundaries
The perirhinal cortex belongs to the parahippocampal region within the temporal medial lobe and it is composed in both rodent and primates of two cytoarchitectonically distinct areas, a smaller and medially situated area 35 and a much larger, laterally situated area 36 78. In mice, as in primates, perirhinal cortex surrounds the posterior portion of the rhinal sulcus and it is delimited medially by the entorhinal cortex and laterally by temporal association areas. The posterior boundary is formed by the postrhinal cortex (parahippocampal cortex in primates). In humans, perirhinal cortex is mainly located in and around rhinal and collateral sulci, including much of the inferotemporal gyrus ventrally, and also extends anteriorly to include the medial portion of the temporal lobe 23.
In the present study we analyzed both the perirhinal areas 35 and 36 of the mouse cortex, and the medial portion of the perirhinal cortex (area 35 or transentorhinal cortex) in the human samples. The mouse perirhinal cortex was identified in Nissl‐stained sections (see Figure S1A a1–a4) by its cytoarchitecture and location using the mouse brain atlas as reference 61. In addition, the distinct immunostaining pattern with the 6E10 monoclonal antibody displayed by areas 35 and 36 as well as the adjoining cortical regions, also provided us a very useful tool for distinguishing anatomical landmarks of the specific analyzed regions (see Figure S1B b1 and b2). This antibody labels human APP (full‐length and fragments including Abeta 14), showing in the transgenic APP/PS1 mice a layer‐specific immunostaining in area 36 (APP‐positive neurons in deep layers V and VI) distinct from area 35 (APP‐positive neurons in layers II–III and VI). On the contrary, for delimitation of the human perirhinal cortex (Figure S3) we used adjacent Nissl‐staining sections along with a human brain atlas 51. Immunostaining for Abeta with the OC antibody (see below) was also very helpful to delimitate the boundaries between adjacent brain areas.
Immunohistochemistry
Antigen retrieval (80°C for 30 min in 50 mM citrate buffer, pH 6.0) was first performed, and free‐floating sections were then treated to inhibit endogenous peroxidase (3% hydrogen peroxide/3% methanol in PBS) and to block endogenous avidin, biotin and biotin‐binding proteins. For light microscopy, sections were incubated with the primary antibody over 24–72 h at room temperature. The antibodies used in this study were: anti‐somatostatin (SOM) goat polyclonal (1:1000 dilution; Santa Cruz Biotechnology), anti‐parvalbumin (PV) rabbit polyclonal (1:5000 dilution, Swant); anti‐neuronal nitric oxide synthase (nNOS) rabbit polyclonal (1:1000 dilution, Sigma‐Aldrich); anti‐NeuN mouse monoclonal (1:1000 dilution, Merck‐Millipore); anti‐human amyloid precursor protein (hAPP) rabbit polyclonal (1:20000 dilution, Sigma‐Aldrich); anti‐hAPP/Amyloid‐beta (Abeta) mouse monoclonal 6E10 antibody (1:1500 dilution; Sigma‐Aldrich); anti‐Abeta42 rabbit polyclonal (1:40 dilution; Biosource); anti‐oligomeric/fibrillar Abeta rabbit polyclonal OC (1:5000 dilution; Merck Millipore); anti‐phospho‐tau (p‐Tau) monoclonal AT8 (1:500 dilution, Thermo Fisher). Tissue‐bound primary antibody was then detected by incubating with the corresponding biotinylated secondary antibody (1:500 dilution, Vector Laboratories), and then with streptavidin conjugated horseradish peroxidase (1:2000 dilution, Sigma‐Aldrich). The peroxidase reaction was visualized with 0.05% of 3‐3′‐diaminobenzidine tetrahydrochloride (DAB), 0.03% of nickel ammonium sulfate and 0.01% of hydrogen peroxide in PBS. Specificity of the immune reactions was controlled by omitting the primary antisera. Sections were mounted on gelatin‐coated slides, air‐dried, dehydrated in graded ethanol, cleared in xylene and coverslipped with DPX (BDH) mounting medium. For human sections, single immunoperoxidase labeling was carried out as described above, and for double immunoperoxidase staining the first peroxidase reaction was developed with DAB and nickel ammonium sulfate (dark blue end product) while the second immunoperoxidase reaction was developed with DAB only (brown reaction end product). For double immunofluorescence, sections were first sequentially incubated with the indicated primary antibodies followed by the corresponding Alexa 488/568 secondary antibodies (1:1000 dilution; Invitrogen). Sections were mounted onto gelatin‐coated slides, coverslipped with 0.01 M PBS containing 50% of glycerin and 3% of triethylenediamine and then examined under a confocal laser microscope (Leica SP5) or Olympus BX‐61 epifluorescent microscope.
Image analysis
Immunofluorescence cell counts
To analyze the colocalization between SOM‐positive cells and APP‐positive or nNOS‐positive cells, immunofluorescence sections were used. Confocal images (Leica SP5 microscope) from 4‐month‐old APP/PS1 mice (n = 3; 5 sections/animal) were processed using Visilog 6.3 analysis program (Noesis, France). Images were acquired on matching areas per section at 20X magnification. Single‐labeled SOM‐cells or nNOS‐cells, and double‐labeled SOM/APP‐cells or SOM/nNOS‐cells were defined by thresholding and converted to binary images. For each image, the total particles were counted and dystrophic neurites were manually excluded from the analysis. Values from each image were summed to obtain a total number of positive cells.
SOM dystrophies‐plaque analysis
Abeta plaques that presented SOM‐positive dystrophic neurites were analyzed using Visilog 6.3 analysis program (Noesis, France). Bright field microscopy images of SOM immunolabeled sections with Congo‐red counterstain from 4, 6 and 12‐months old APP/PS1 mice (n = 3/age, 5 sections/animal) were taken using an Olympus BX‐61 microscope and 10X objective. The perirhinal areas 35 and 36 were manually outlined in each image and the total area was measured. The total number of Abeta plaques associated with SOM‐positive dystrophies was counted and values from each section were averaged to obtain a mean plaques/mm2 for each animal.
Plaque and p‐Tau loading
For plaque load, thioflavin‐S stained (0.015% in 50% ethanol; Sigma) or Abeta42‐immunostained sections were analyzed. For p‐Tau load, AT8‐immunostained sections were used. Sections were visualized under an Olympus BX‐61 microscope and 4x objective. Images were acquired with an Olympus DP71 high‐resolution digital camera and settings were adjusted at the start of the experiment and maintained for uniformity. Digital images from APP/PS1 mice (n = 4/age; four sections per mouse) or human samples (n = 5–6/Braak stage; two sections per individual) were analyzed using Visilog 6.3 analysis program (Noesis, France). The plaque area (Thioflavin‐S positive or Abeta42 immunostained) or p‐Tau immunolabeled area (AT8‐positive) within the perirhinal cortex was identified by level threshold and color images were converted to binary images. The cortical area in each 4x image was manually outlined. Plaque or p‐Tau loading (%) was calculated and defined as (sum labeled area measured/ sum cortical area analyzed) x 100. The sums were taken over all slides sampled and a single burden was computed for each specimen. The mean and standard deviation (SD) of the corresponding loadings were determined using all the available data. Quantitative comparisons were carried out on sections processed at the same time with same batches of solutions.
Plaque size morphometric analysis
Sections stained with Thioflavin‐S from 4, 6 and 12‐months old APP/PS1 mice (n = 4/age, four sections/animal) were analyzed using the nucleator method with isotropic probes by the NewCAST software package from Olympus stereological system. Perirhinal cortex was analyzed using a counting frame of 7066 µm2 and step length of 137 µm. For individual plaque measurement a 40X objective was used. Number of plaques/mm2 falling into four surface categories (ranging from <200 µm2 to >2000 µm2) was calculated. Each analysis was done by a single examiner blinded to sample identities.
Stereological analysis
Immunopositive cells in mice and human brain sections were stereologically quantified as previously reported 5, 39, 55, 63, 71, 82 using an Olympus BX61 microscope interfaced with a computer and an Olympus DP71 digital camera, and the NewCAST (Computer Assisted Stereological Toolbox) software package (Olympus, Denmark). For mice studies (n = 3–8/age/genotype) SOM‐, PV‐ and nNOS‐positive cells were counted through the rostrocaudal extent of the perirhinal cortex (between Bregman coordinates −1.34 mm and −4.04 mm). Neurons were quantified in every seventh section (with a distance of 280 μm), and an average of 7–8 sections was measured in each animal. Cortical boundaries were defined according a standard mouse stereotaxic brain atlas 61, in adjacent series of sections stained with cresyl violet. The cortical area was defined using a 4x objective and the number of neurons was counted using a 100x/1.35 objective. We used the optical 3 μm from the upper surfaces as look‐up and those 3–13 μm from the surfaces as reference sections. A counting frame of 902.5 μm2 with step lengths of 42.49 µm was used. For human tissue studies, immunoreactive cells were counted (n = 3–5/Braak stage; 5–6 sections/individual) in every sixth section (with a distance of 180 µm) through the rostrocaudal extent of the perirhinal cortex (area 35) situated between Bregman stereotaxic coordinates 17 mm and 35 mm, according to the Atlas of the Human Brain 51. The anatomical boundaries were defined using a 2X objective and the number of the cells was counted using a 100X/1.35 objective. We used a counting frame of 1722 µm2 with step lengths of 131.23 µm. The numerical density (ND; cells/mm3) was calculated using the following formula: ND = Q/(∑A × h/SV), where “Q” is the number of disector‐counted somatic profiles, “∑A” is the area of the counting frame, “h” is the height of the optical dissector (10 μm) and SV is the volumetric shrinkage factor of the sample. Finally, the numerical density was calculated as described above for mice sections. An investigator who was blind to the experimental conditions performed neuronal profile counting.
Statistical analysis
Normality data were assessed using the Kolmogorov–Smirnov test. Normally distributed data were expressed as mean ± SD. The comparison between two groups was done by two‐tailed t‐test, and for comparing several groups and ages, we used one‐way ANOVA, followed by Tukey post‐hoc multiple comparison test. For both tests, the significance was set at 95% of confidence. SigmaStat 3.5 and GraphPad Prism 7 statistics software were used in all the cases.
Results
Early loss of highly disease‐sensitive SOM interneurons in APP/PS1 perirhinal cortex
We have previously reported that SOM‐positive interneuron population was substantially reduced in the hippocampus and the entorhinal cortex of our APP/PS1 transgenic model at early ages 55, 63, 82. Thus, we now analyzed the vulnerability of this GABAergic interneuron subset in the perirhinal cortex. SOM‐positive neurons were found throughout cortical layers II–VI of areas 35 and 36 (Figure 1A a1–a3), however, they seemed to be more abundant in the deep layer (IV–VI) of both perirhinal areas. Most SOM‐positive neurons displayed a multipolar morphology with several primary dendritic processes (see inset in Figure 1A a1). Neuropil staining was stronger in the area 36 than 35 (Figure 1A a4 and a5, respectively). Distribution pattern of SOM‐positive neurons was very similar in both WT and APP/PS1 mice (Figure 1A a1 and a2, respectively). However, transgenic mice displayed abundant SOM‐positive dystrophic neurites (Figure 1A a2 and a3; see a6 for detail) which were closely associated with amyloid plaques as evidenced in Congo red counterstained sections (Figure 1A a7). Although no significant differences in the amount of Abeta plaques (plaques/mm2) associated with SOM‐positive dystrophies were found between areas 35 and 36 at any age analyzed, this was significantly higher at 12 months compare to 4 or 6 months of age (6.2 ± 2.3 and 5.6 ± 2.4 at 4‐month‐old, vs. 12.5 ± 2.2 and 9.7 ± 1.4 at 6 month‐old or 33.9 ± 5.5 and 25.2 ± 5.8 plaques/mm2 at 12 month‐old in areas 35 and 36, respectively; n = 3, 5 sections/animal, ANOVA F(2,19) = 53.7, P < 0.0001; Tukey P < 0.005). Noteworthy, in our quantitative analysis all identified SOM‐positive dystrophies were associated with amyloid plaques. Besides the close association between SOM‐positive dystrophic axons and amyloid plaques, these interneurons do not accumulate Abeta (see Figure 1A a8–a10) since they do not express the mutated human APP transgene 55, 63. We corroborated this in double SOM/APP immunofluorescence staining in 4‐month‐old APP/PS1 mice and none double SOM/APP cells were found in area 35 or 36 (from a total of 1028 and 1060 SOM‐positive cells analyzed in each perirhinal area, respectively; n = 3, 5 sections/animal). An apparent diminution of the SOM‐positive neurons, especially in the deeper layers, was detected in APP/PS1 mice at 6 months of age. The stereological study showed that there was a statistically significant decrease in the numerical density (cells/mm3) of these interneurons in APP/PS1 mice at 6 months of age compared to age‐matched WT selectively in the deep layers of both areas 36 and 35 (−56.97 ± 8.92% and −60.73 ± 10.08%, respectively; see Figure 1B b1). Changes in the number of SOM‐positive cells in WT animals was also detected at 12 months of age in the deep layers of both areas 36 and 35 (−36.35 ± 20.65% and −35.52 ± 16.52%, respectively). The decrease in SOM‐positive neurons in 6‐month‐old APP/PS1 mice was also significant when compared to 4‐month‐old mice (−55.99 ± 9.13% and −57.28 ± 10.96% in the deep layers of both areas 36 and 35, respectively). Interestingly, this decrease did not progress further at 12 months of age. By contrast, no significant differences were observed in the number of SOM‐positive neurons in the superficial layers (I–III) at any age analyzed (Figure 1B b2). Therefore, these data demonstrated a significant and early reduction of the SOM‐positive population selectively in the deep layers of the perirhinal cortex in the transgenic APP/PS1 mice. Moreover, our data indicate that distinct disease‐sensitive SOM‐positive neuronal subpopulations should be present in the perirhinal cortex of these transgenic animals, at least, one highly vulnerable which is early affected and another more resistant to the disease progression that remains until, at least, 12 months of age.
Figure 1.
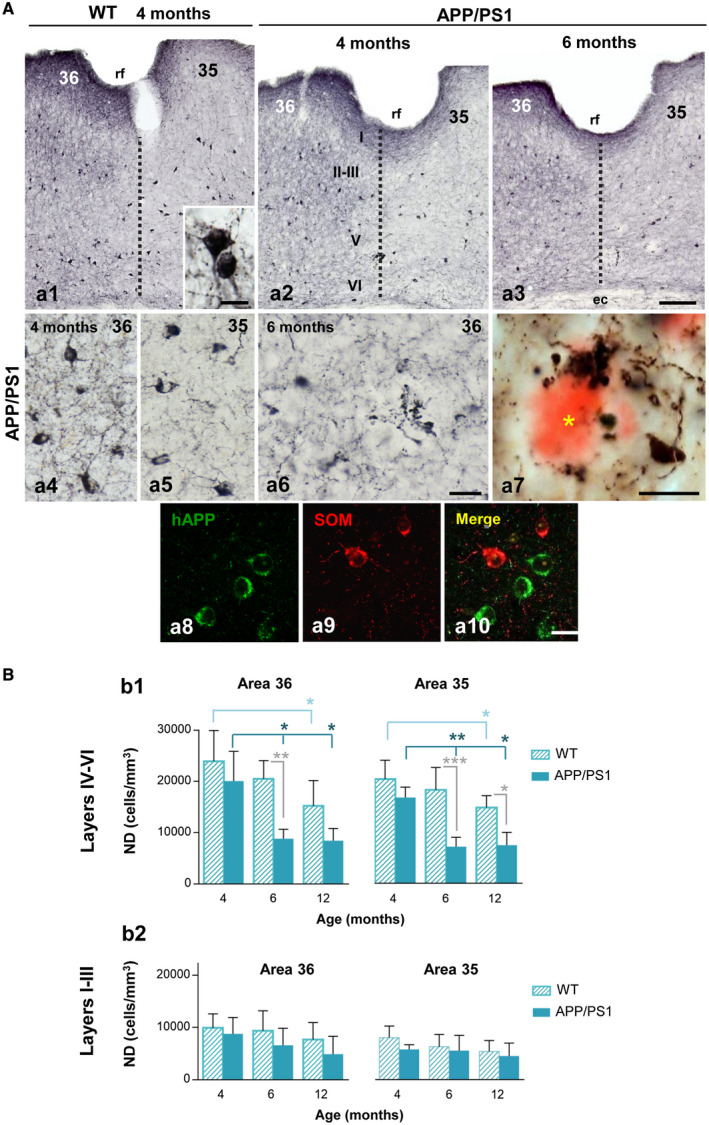
Significant reduction of SOM‐positive interneurons in the perirhinal cortex of APP/PS1 mice at early ages. A. Immunostaining for SOM in the perirhinal cortex (areas 36 and 35) of WT (a1) and APP/PS1 (a2 and a3) mice at 4 and 6 months of age. Inset in a1 shows a detail of SOM‐positive somata. SOM neurons are located mainly in the deep layers (IV–VI) of perirhinal cortex in both areas 36 and 35 of APP/PS1 mice (a4 and a5, respectively). Abundant immunoreactive dystrophic neurites are observed at 6 months of age in the transgenic mice (a6). SOM‐positive dystrophic neurites are associated with amyloid plaques (a7, asterisk indicates an Abeta plaque stained with Congo red). Confocal double immunofluorescence labeling (a8–a10) for hAPP (green) and SOM (red) showing the no co‐localization of these markers in the same neurons in APP/PS1 mice. B. Stereological quantification of the numerical density (ND, cells/mm3) of SOM‐positive neurons in WT (n = 6‐8/age) and APP/PS1 (n = 4‐6/age) mice at 4, 6 and 12 months of age. Results demonstrate a significant decrease of SOM‐positive cells in the deep layers of perirhinal cortex (areas 36 and 35) of APP/PS1 animals compared to WT from 6 months of age (b1). No significant differences were observed at any ages in superficial layers (I–III) of perirhinal cortex (b2). Data (mean ± SD) were analyzed by one‐way ANOVA P < 0.001 (F(5, 27) = 9.266 for area 36 (layers IV–VI) and F(5, 27) = 13.609 for area 35 (layers IV–VI); followed by Tukey post hoc multiple comparison test. Significance (*P < 0.05, **P < 0.01, ***P < 0.001) is indicated in the figure. ec, external capsule; rf, rhinal sulcus; I–VI, cortical layers. Scale bars: a1–a3, 100 µm; a4–a6 and a8–a10, 20 µm; a7 and inset in a1, 10 µm.
Our previous studies in the hippocampus and entorhinal cortex identified the SOM neurons expressing neuropeptide Y (NPY) (SOM/NPY neurons) as a highly vulnerable SOM subpopulation 55, 63. In order to determine the persisting SOM subpopulation, here we analyzed the SOM/nNOS neurons which constituted a small but conspicuous population in the perirhinal cortex (Figure S2A). Although nNOS‐positive neurons were located throughout cortical layers II to VI, they were mainly concentrated in the deep layers of both areas 36 and 35. Similarly to that of SOM cells, nNOS neurons showed a multipolar morphology with slightly branched primary dendrites (Figure S2A a1). Noteworthy, all nNOS positive neurons examined, independent of the age and genotype of mice, were also immunoreactive for SOM (Figure S2A a1–a3). The quantification in double immunofluorescence nNOS/SOM sections from 4‐month‐old APP/PS1 mice (n = 3, 5 sections/animal) revealed that 100% of nNOS cells (a total of 100 and 106 nNOS‐positive cells were counted in areas 35 and 36, respectively) were positive for SOM (from a total of 909 and 868 SOM‐positive cells counted in areas 35 and 36, respectively). SOM neurons were more abundant than nitrergic ones, therefore, nNOS neurons constituted a small subpopulation (11.1 ± 2.4% or 12.2 ± 3.9% in areas 35 and 36, respectively) of SOM‐positive neurons in the perirhinal cortex. The presence of nNOS‐positive dystrophies was detected in the transgenic mice (Figure S2A a4–a6). We then performed a stereological study to quantify nNOS neurons (immunoperoxidase staining and bright field microscopy) in the deep perirhinal layers of APP/PS1 and WT animals at 4, 6 and 12 months of age, and no significant differences in the numerical density (cells/mm3) of this population were found at any age in both cortical areas (36 and 35) and genotypes (see Figure S2B). Therefore, no age‐dependent or disease‐dependent decrease was detected for the SOM/nNOS subpopulation indicating that these neurons were quite resistant to the progressive increasing amyloid pathology in this model, though they developed dystrophic processes. These data support that SOM/nNOS neurons constitute a sub‐fraction of the stable SOM population in the perirhinal cortex of APP/PS1 mice.
PV interneurons are highly resistant in the APP/PS1 perirhinal cortex
We next evaluated the other major interneuron population in the cerebral cortex, the perisomatic GABAergic PV‐positive neurons. We have reported no decrease in numbers of PV‐expressing interneurons in the hippocampus and entorhinal cortex of our APP/PS1 model (55, 63, 82). These interneurons were numerous and distributed across layers II to VI in the perirhinal cortex, although they were located mainly in the deep layers (Figure 2A a1–a3). Most PV neurons in the perirhinal cortex of mice displayed multipolar morphology with aspinous dendrites. Layers II–V of area 35 showed a high density of PV‐positive axonal plexuses, allowing a clear distinction with the area 36 that was much less immunoreactive (Figure 2A a1–a3; see a4 and a5 for details). Qualitative examination of immunostained sections showed no apparent differences between WT and APP/PS1 mice in distribution, morphology or density of the PV neurons in any of the ages studied (2, 4, 6 and 18 months). In addition, PV‐positive dystrophic neurites were not observed at any age, despite the close proximity between the PV‐positive processes and the Aβ plaques in many instances (Figure 2A a6). The stereological cell counting of the PV‐positive neurons was performed in 6‐ and 18‐month‐old WT and APP/PS1 mice. The data showed that there were no significant changes in the numerical density of these GABA neurons in either of the two perirhinal areas (36 and 35) between WT and APP/PS1 mice at early (6 months) or even at late (18 months) ages (area 36: 10630 ± 2970 and 11480 ± 1940 cells/mm3 for transgenic mice, and 10974 ± 2990 and 9619 ± 3034 cells/mm3 for WT mice, respectively; area 35: 8970 ± 1460 and 9520 ± 2110 cells/mm3 for transgenic mice, and 10765 ± 4281 and 10382 ± 1496 cells/mm3 for WT mice, respectively) (Figure 2A). These data indicate that PV neurons constitute an unaffected GABA subpopulation in the perirhinal cortex of this amyloidogenic mouse model.
Figure 2.
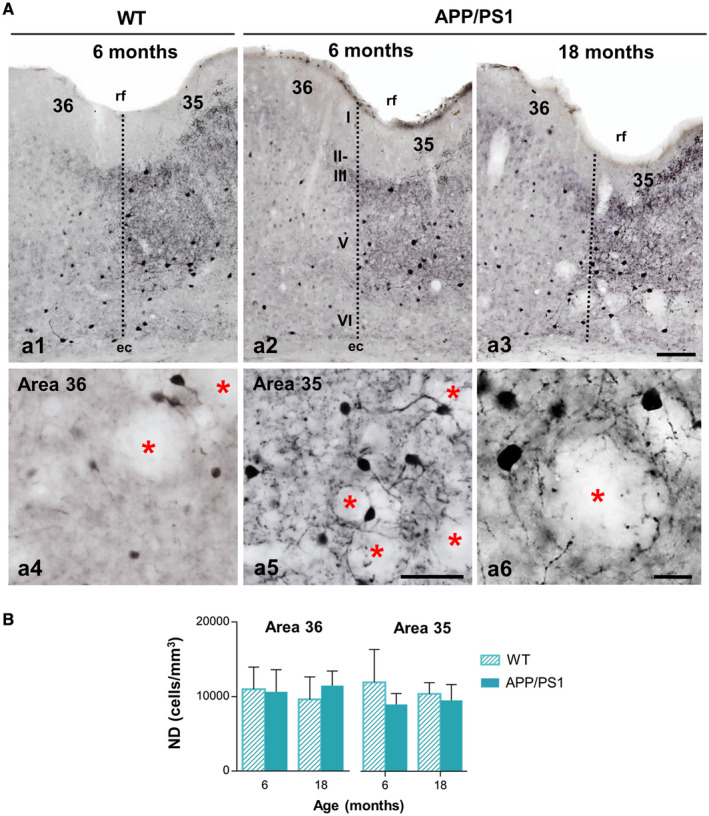
PV‐inhibitory interneurons show resistance to the degenerative process in the perirhinal cortex of APP/PS1 mice. A. Light microscopy images of PV immunostaining in the perirhinal cortex (areas 36 and 35) of WT (a1) and APP/PS1 (a2–a6) mice at 6 and 18 months of age. The number and morphology of positive somata do not exhibit changes between genotypes, nor with aging. Area 36 and area 35 present a differential pattern of neuropil immunoreaction as seen in the higher magnification images (a4 and a5, respectively). No dystrophic neurites are detected near the Abeta plaques at 18 months of age (a6). Asterisks indicate areas occupied by plaques (not stained). B. Quantification of the numerical density (cells/mm3) of PV‐cells at 6 and 18 months of age in WT and APP/PS1 mice (n = 4–6 per genotype and age) reveals no differences between the genotypes, even at elderly ages, in the deep layers of the perirhinal cortex. Data (mean ± SD) were analyzed by one‐way ANOVA P > 0.05 (F(3, 9) = 0.240 for area 36; F(3, 9) = 0.275 for area 35) . rf, rhinal sulcus; I–VI, cortical layers. Scale bars: a1–a3, 100 µm; a4 and a5, 50 µm; a6, 20 µm.
Extracellular Abeta accumulation is spatially and temporally coincident with the loss of SOM interneurons in APP/PS1 mice
In order to know whether the selective loss of SOM cells in the deep layers of the perirhinal cortex was associated to a preferential accumulation of Abeta deposits, we examined the amyloid pathology in the superficial (layers I–III) and deep layers (IV–VI). The amount of labeled deposits was slightly higher with Abeta42 immunostaining (Figure 3A a1–a3) than with Thioflavin‐S staining which selectively highlights the fibrillar plaques (Figure 3A a4–a6). However, the amyloid plaques distribution pattern was similar with both staining approaches being plaques significantly more abundant and larger in the deeper layers than in the superficial cortical layers. Amyloid deposits were observed first in the deep cortical layers (at 4 months of age) and gradually progressed to superficial cortical layers with age, displaying area 35 an earlier and more intense Abeta pathology than area 36. We then determined the fibrillar amyloid burden in both superficial (I–III) and deep (IV–VI) layers (Figure 3B). The amyloid load increased significantly (two‐tailed t‐test) with age, both in the superficial and the deep layers of areas 36 and 35 of the perirhinal cortex, being more affected the deep layers. The most significant increase occurred between 6 and 12 months of age in the deep layers of both regions (5–7 times more amyloid load in the deep layers at 12 months than at 6 months). The age‐dependent increase in the total amyloid load appeared to be associated with both the number and size of the plaques. To support this observation, we next determined the plaque density (plaque/mm2) in deep layers at 4, 6 and 12 months of age dissecting plaques into four size categories ranging from <200 μm2 to those >2000 μm2 (Figure 3C). As expected, there was a significant increase in the number of plaques/mm2 at the age of 6 months in the deep layers of areas 36 (38.48 ± 4.91 at 6 months vs. 18.06 ± 10.10 at 4 months, and 35 (45.68 ± 27.01 at 6 months vs. 17.51 ± 4.41 at 4 months). The number of plaques falling into the range of <200 μm2 significantly increased (2.8 times in area 36 and 4 times in area 35) at 6 months of age compared to 4 months. Interestingly, the plaques within the range of <500 μm2 were the most abundant ones at 4–6 months of age. The number and size of plaques was remarkably higher at 12 months of age in both perirhinal areas. Plaques >500 μm2 were much more abundant at 12 months (7.2 times in area 36 and 7.5 times in area 35) than at younger ages (4 months). Then, the number as well as the size of plaques significantly increased with age in deep layers of both perirhinal areas. All together these data indicate that there is a temporal and spatial correlation between amyloid pathology and the loss of SOM interneurons in the deep layers of the perirhinal cortex of our APP/PS1 model.
Figure 3.
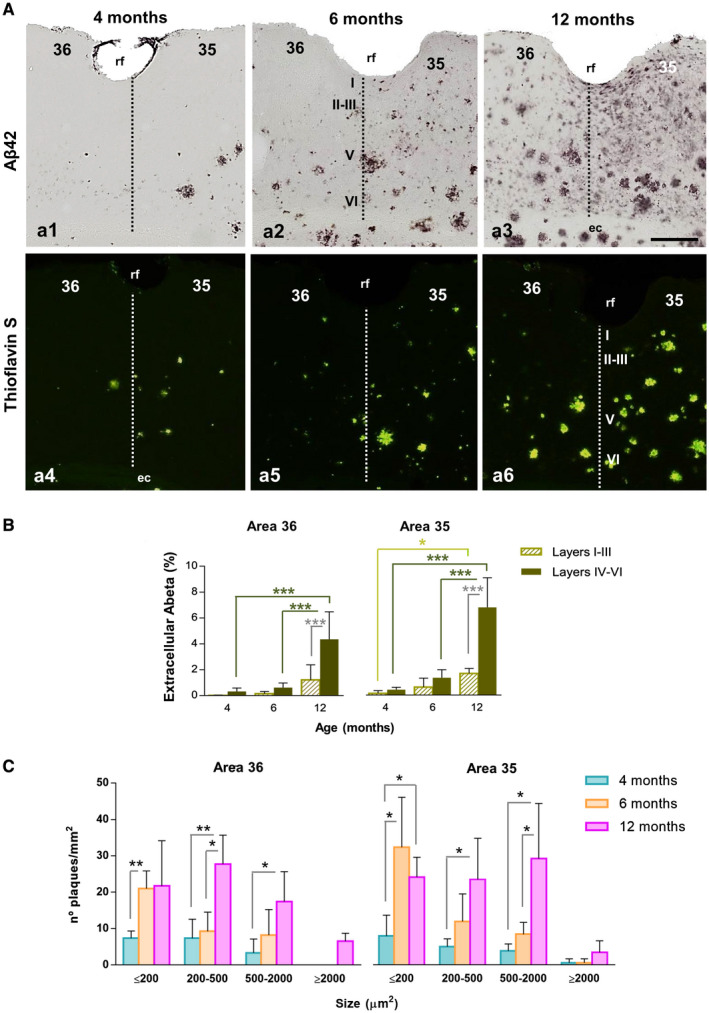
Extensive amyloid pathology in the perirhinal cortex of APP/PS1 mice since early ages. A. Immunostaining for Abeta42 (a1–a3) and staining for fibrillar Abeta (Thioflavin‐S, a4–a6) in the perirhinal cortex of APP/PS1 mice at 4, 6 and 12 months of age. Extracellular deposits are first observed at 4 months of age and accumulate preferentially in deep layers (IV–VI) of area 35. Amyloid plaques progressively increase along aging in both areas 36 and 35. B. The area occupied by extracellular Abeta augments significantly with age and is higher in deep layers than in superficial layers at 12 months of age (n = 4, two‐tailed t‐test). C. Quantification of the number (plaques/mm2) and size of amyloid deposits in deep layers demonstrates a significant increase with age (n = 4, one‐way ANOVA P < 0.001 (F(5, 37) = 19.975 for area 36 and F(5, 38) = 44.843 for area 35), followed by Tukey post hoc multiple comparison test). Significance (*P < 0.05, ** P < 0.01, *** P < 0.001) is indicated in the figure. ec, external capsule; rf, rhinal sulcus; I–VI, cortical layers. Scale bars: a1–a6, 200 µm.
Loss of SOM‐positive and PV‐positive interneuron populations in the perirhinal cortex of Alzheimer's patients
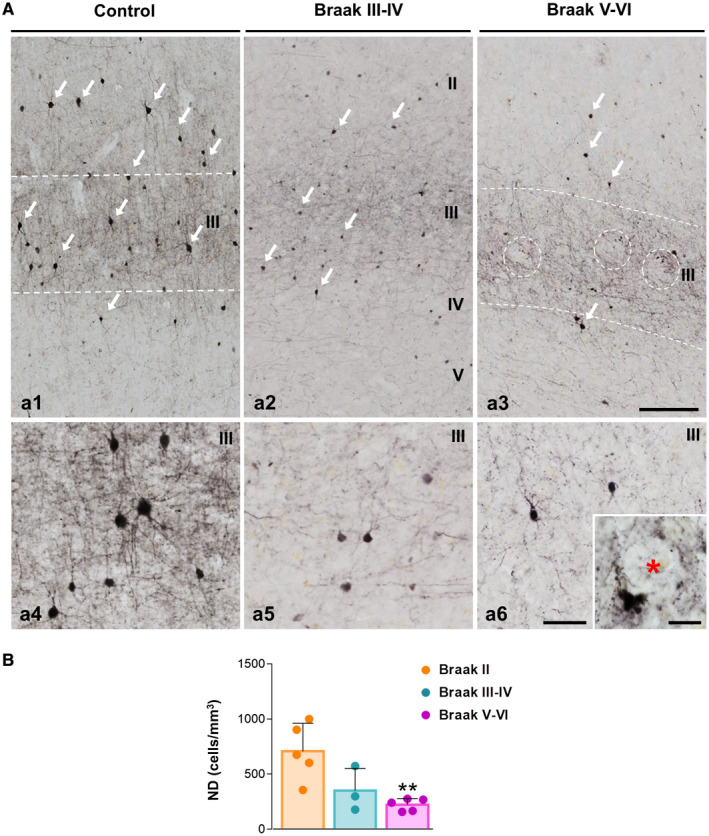
To address the relevance of this GABAergic vulnerability in the transgenic mice for AD pathology, we examined SOM cells and PV cells in human post‐mortem AD perirhinal cortex. Elderly age‐matched samples from demented individuals with advanced tau pathology (Braak V–VI), non‐demented with intermediate tau pathology (Braak III–IV) and cognitively normal Braak II individuals were processed for SOM or PV immunohistochemistry and then the numerical density of neurons (cells/mm3) quantified using stereology. Middle‐age individuals with no AD‐like pathology (Braak 0; not shown) were also included along with aged Braak II individuals as control group. In Braak 0 or Braak II individuals, SOM immunostaining revealed numerous positive interneurons throughout all cortical layers (Figures 4A a1), though they were apparently more abundant in deep layers (Figures 4A a1 and a2; see a5 for detail). A reduced number of SOM‐positive somata was evidenced in Braak III–IV (Figures 4A a3) and even more pronounced reduction was seen in Braak V–VI samples (Figures 4A a4). SOM‐positive dystrophic neurites were occasionally seen in intermediate (Braak III–IV) and advanced (Braak V–VI) cases (see Figures 4A a6 and a7). SOM dystrophies were usually associated to amyloid plaques (Figures 4A a8). The stereological quantification (Figure 4B) of this population of distal dendritic‐targeting inhibitory interneurons in the perirhinal cortex (layers I–VI) demonstrated a pronounced and significant reduction in the numerical density in Braak III–IV samples (−68.74 ± 24.95%) that was even higher in Braak V–VI (−91.11 ± 6.64%), compared to Braak II samples.
Figure 4.
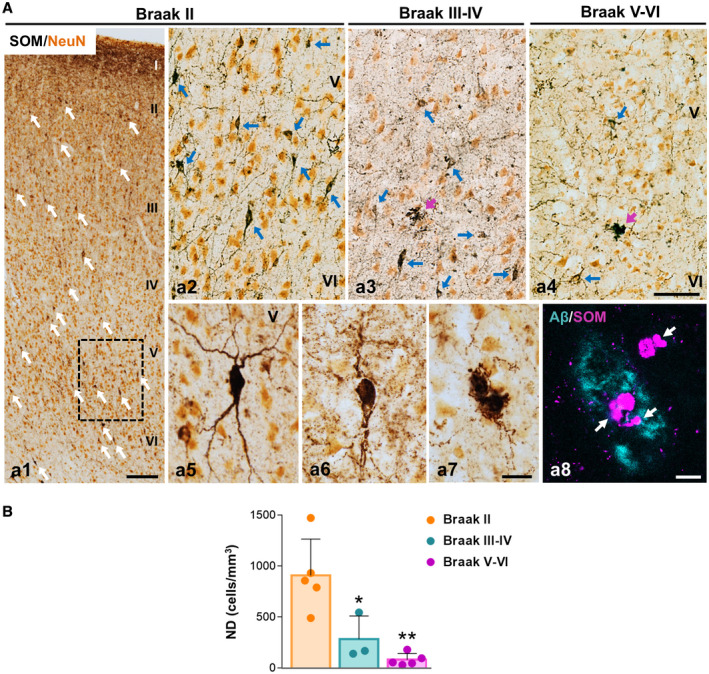
SOM‐positive interneurons are highly affected in the perirhinal cortex of AD patients. A. Double immunolabeling for SOM (dark brown) and the neuronal marker NeuN (orange) in the perirhinal cortex; a1) panoramic view of the perirhinal cortex showing SOM‐positive neurons distribution in layers I–VI in Braak II (age‐matched controls); a2–a4) higher magnification of the deep cortical layers (IV–VI) in Braak II (a2), Braak III–IV (a3) and Braak V–VI (AD patients, a4). A decrease in the number of SOM‐immunostained somata (blue arrows) is observed in Braak III–IV and Braak V–VI samples along with a reduction of the SOM‐positive axonal plexus. Cell morphology details of SOM neurons in the perirhinal cortex of Braak II (a5) and Braak V–VI (a6 and a7) cases are shown in higher magnification images. SOM‐immunoreactive dystrophic neurites (purple arrows) are detected in Braak V–VI samples associated with plaques, as demonstrated by the confocal image (a8, SOM‐dystrophies are pointed out with white arrows). B. The numerical density (cells/mm3) of SOM‐positive neurons in the perirhinal cortex of Braak II (n = 5), Braak III–IV (n = 3) and Braak V–VI (n = 5) cases was determined by stereology. Quantitative data confirm the existence of an extensive significant loss of SOM cells in Braak III–IV and Braak V–VI patients. Data (mean ± SD) were analyzed by one‐way ANOVA P < 0.001 (F(2, 10) = 14.428 followed by Tukey post hoc multiple comparison test. Significance *P < 0.05, **P < 0.01) is indicated in the figure. I–VI, cortical layers. Scale bars: a1, 200 µm; a2–a4, 100 µm; a5–a7, 25 µm; a8, 10 µm.
However, as shown in Figure 5 for Braak II, PV‐positive interneurons, including both basket and chandelier cells, were found through layers II–VI being the majority located at layers II–III. Immunopositive neuropile corresponding to axons and dendrites was most prominent at layer III (Figures 5A a1, see a4 for detail). The comparison with age‐matched individual displaying intermediate (Braak III–IV) o advanced (Braak V–VI) tau pathology revealed a substantial reduction in the number of immunolabeled PV‐somata as well as neuropile staining (Figures 5A a2 and a3, compared to a1; see a4–a6 for further details). PV‐positive dystrophic neurites were rarely seen in the AD samples. A significant decrease in the numerical density (Figure 5B) of PV‐cells (−68.62 ± 7.95%) was detected in Braak V–VI individuals compared to Braak II.
Figure 5.
Significant reduction of PV‐expressing cells in the perirhinal cortex of AD patients. A. Light microscopy images of PV immunoreactivity in the perirhinal cortex of Braak II (a1 and a4), Braak III–IV (a2 and a5) and Braak V–VI (AD patients; a3 and a6) post‐mortem samples. PV‐positive somata (arrows) and nerve fibers, mainly located in layer III, are clearly reduced in Braak III–IV and Braak V–VI cases compared to age‐matched Braak II individuals, as observed in high magnification images (a4–a6). Some dystrophic neurites appear in the nearness of an Abeta plaque (inset in a6, asterisk indicates an unstained Abeta plaque). Open white circles indicate amyloid plaques location. B. Stereological counts of PV‐positive interneurons reveal a significant decrease in the numerical density (cells/mm3) of this inhibitory population in the Braak V–VI perirhinal cortex (n = 3‐5). Data (mean ± SD) were analyzed by one‐way ANOVA P < 0.006 (F(2, 10) = 8.741 followed by Tukey post hoc multiple comparison test. Significance (**P < 0.01) is indicated in the figure. II–V, cortical layers. Scale bars: a1–a3, 200 µm; a4–a6, 50 µm; inset in a6, 20 µm.
Then, in AD perirhinal cortex there was a profound loss of SOM‐positive as well as PV‐positive interneurons. In order to correlate this interneuron loss with the severity of major AD lesions, we have next examined the tau and Abeta pathology in our human post‐mortem cases (Figure 6). The tau pathology was visualized with the specific phospho‐tau antibody AT8. A significant increase in the tau pathology (measured as AT8‐immunopositive load) was found in Braak V–VI samples (10 times compared to Braak II, or 2.7 times compared to Braak III–IV cases; Figure 6C c1). In control Braak II samples the presence of AT8‐positive neurons was seen specifically in layer III (Figure 6A a1 and a4), where PV‐cells were more abundant. The phospho‐tau bearing neurons expanded to all cortical layers in Braak III–IV and the number of affected neurons was higher in Braak V–VI stages as expected (Figure 6A a2 and a3, respectively). Neurons with neurofibrillary tangles were clearly identified with the AT8 antibody (see Figure 6A a4, a5 and a7). AT8‐positive neuropile was dense in layer III in Braak II and then increased gradually with the disease course being more intense in layers II–III and V. The presence of neuropile threads which might result from the breakdown of dendrites and axons of the neurofibrillary tangle‐bearing neurons was very abundant (see Figure 6A a4–a7). In addition, numerous AT8‐positive dystrophic neurites were also seen (Figure 6A a6). Amyloid pathology (Figure 6B) was visualized with a conformation‐ and sequence‐specific antibody against Abeta oligomers (OC antibody). Though the spatiotemporal pattern of amyloid deposition in the perirhinal cortex was variable within individuals, a clear increase in the amount of amyloid plaques was evidenced along the course of the disease (Figure 6B b1–b3). In Braak II individuals, the amyloid deposits were very sparse and were located mainly in superficial layers whereas in Braak V–VI cases the amyloid deposits were abundant and usually involved the six cortical layers. Diffuse (Figure 6B b4) and neuritic plaques (Figure 6B b5 and b6) were seen. The Abeta oligomers were mainly located in an external ring that surrounded the fibrillar dense core of classic deposits (Figure 6B b7–b9). The increase in the amyloid burden in advanced Braak V–VI cases (4.3 times) was in fact statistically significant in comparison with Braak II samples (Figure 6B c2).
Figure 6.
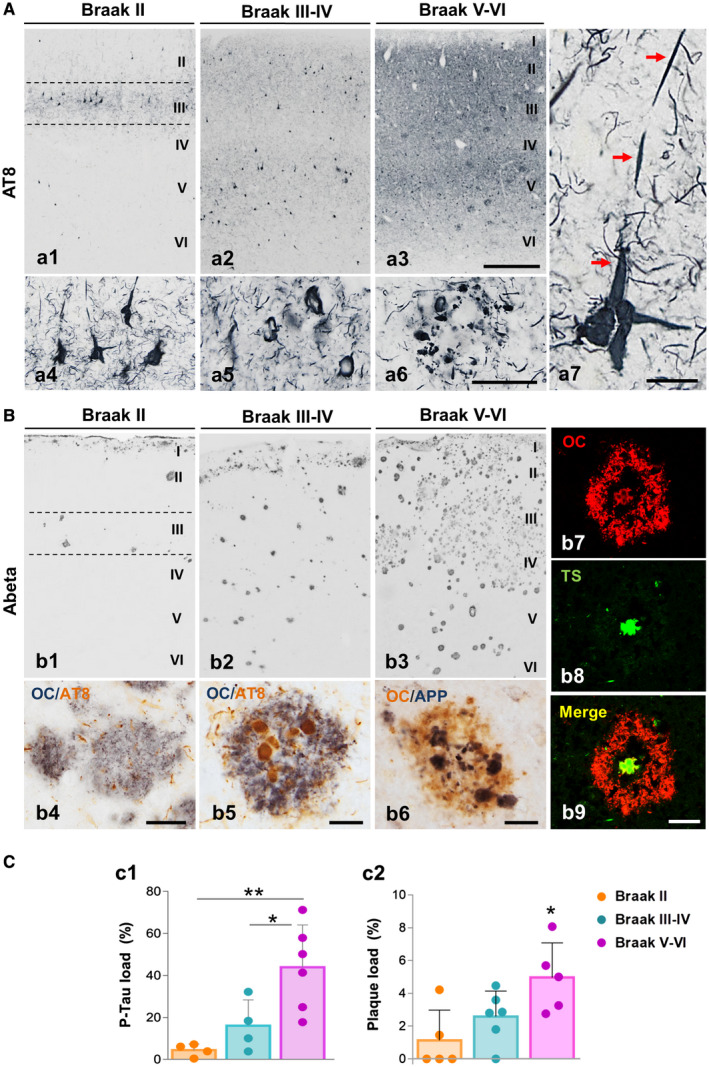
Progression of neurofibrillar and amyloid pathology in the human perirhinal cortex. A. Immunostaining with the AT8 antibody showing the neuronal phospho‐tau accumulation in the perirhinal cortex of Braak II (a1), Braak III–IV (a2) and Braak V–VI (AD patients; a3) individuals. Neurofibrillary tangles and neuropil threads are first detected in layers II–III of Braak II cases (see detail in a4) and spread to other cortical layers with the disease progression. Higher magnification images from Braak V–VI samples show a clear neurodegenerative perirhinal cortex displaying an elevated number of tangles (a5) and dystrophic neurites around plaques (a6). Detail of an apical dendrite accumulating phospho‐tau (red arrows) is shown at higher magnification (b7). B. Amyloid deposition in the perirhinal cortex of Braak II (b1), Braak III–IV (b2) and Braak V–VI (b3) stages is revealed by Abeta42 immunostaining. Different types of plaques, diffuse (b4) and neuritic (b5 and b6) are shown by double immunostaining for Abeta42 (OC antibody) and phospho‐tau (AT8 antibody; b4 and b5) or APP (b6). Confocal images (b7–b9) reveal the presence of an oligomeric Abeta halo in the periphery of the fibrillar core (Thioflavin S‐positive) of neuritic plaques. C. The p‐Tau load (c1) and Abeta load (c2) are significantly higher in the perirhinal cortex of Braak V–VI patients compared to age‐matched Braak II or Braak III–IV individuals (n = 5–6/Braak stage). Data (mean ± SD) were analyzed by one‐way ANOVA (P = 0.0047 F(2,22) = 9.092 for p‐Tau load and P = 0.018 F(2, 13) = 5.578 for plaque‐load) followed by Tukey post hoc multiple comparison test. Significance (*P < 0.05; **P < 0.01) is indicated in the figure. I–VI, cortical layers. Scale bars: a1–a3 and b1–b3, 500 µm; a4–a6, 100 µm; a7, 20 µm; b4–b9, 25 µm.
Therefore, our data suggest a relationship between the progression of both, phospho‐tau and amyloid pathologies, and the loss of SOM and PV interneurons in the perirhinal cortex of Braak V–VI patients.
Discussion
Here we demonstrate that SOM‐ and PV‐cells, the two major and non‐overlapping GABAergic cortical interneuron populations, display distinct vulnerability in the perirhinal cortex of AD mice and patients. In APP/PS1 mice, SOM neurons are strikingly sensitive and their number dramatically decrease in 6‐month‐old mice, however, the number of PV neurons stays well preserved in this model. By contrast, both inhibitory populations are highly affected in the perirhinal cortex of AD patients (Braak V–VI). These findings highlight the potential contribution of interneuron loss to the abnormal brain rhythms and cognitive dysfunction observed in patients. However, our results emphasize the failure of amyloidogenic transgenic models to fully recapitulate the selective neurodegeneration occurring in AD brains.
Cortical network activity is controlled by GABAergic interneurons and the dysfunction of these neurons has strongly come on the scene as major contributor for the cognitive impairment manifested by AD patients 60. There is a large diversity of GABA interneurons which differ on their morphological, electrophysiological and molecular features, however somatostatin containing group (30% of cortical interneurons) along with the PV expressing neurons (40% of cortical interneurons) comprise together the largest cortical inhibitory subpopulations 81. SOM deficiency in AD brains has been long described 6, 12, 17, 20, 24, 25, 27, 28, 29, 44, 67, 80, though none of these studies used a stereology based procedure for cell counting. We have previously demonstrated by stereological analysis a significant early loss of SOM cells in the hippocampus 63, 82 and entorhinal cortex 55 of our APP/PS1 model. In addition, reduced SOM cells in the hippocampus 1 and the olfactory system 69 has also been reported in others AD models. Now, we demonstrate a significant decline of SOM cell density in the APP/PS1 perirhinal cortex since early ages and, most important, that these inhibitory neurons are also dramatically reduced in the perirhinal cortex of AD brains (Braak V–VI). This reduction of SOM cells was even significant in the group of Braak III–IV samples revealing an impairment of this subpopulation since earlier stages of the disease. Therefore, loss of these inhibitory interneurons seems to be a common process in AD models and AD brains 2, making SOM cells into a highly sensitive population to the AD pathology in both transgenic models and patients.
The mechanisms underlying the AD‐associated vulnerability of SOM cells are still unknown, but as we have previously suggested 40, 55, 63, 82, the extracellular Abeta could be a major factor involved. Thus, as we show in the perirhinal cortex of AD patients and APP/PS1 mice, the loss of SOM neurons is temporally and spatially associated with the amyloid pathology, including the formation of SOM‐positive dystrophies surrounding the Abeta plaques. A correlation between neuronal death and extracellular deposition of Abeta has also been observed in other AD models 36. A significant reduction of SOM cells after intracerebroventricular infusion of Abeta peptides (Abeta1–40 or Abeta25–35) in the hippocampus and other cortical regions has been reported in rats 12, which supports an important role of Abeta in the loss of this interneuron population. Nevertheless, in amyloidogenic AD mice, a decreased septohippocampal cholinergic input impairs oriens lacunosum‐moleculare SOM interneurons (O‐LM cells) function, impacting memory acquisition 74. Since loss of basal cholinergic neurons is a hallmark of AD brains 4, 52, 62, 85, and this selective degeneration is found in some amyloidogenic 18, 48 and tauopathy models 7, AD‐associated cholinergic depletion might increase the vulnerability of SOM neurons, contributing to memory deficits. Therefore, Abeta accumulation directly, or indirectly through cholinergic impairment or inducing a cytotoxic neuroinflammatory response, could significantly contribute to the neurodegenerative process of SOM neurons in the perirhinal cortex. We cannot exclude, however, causes other than Abeta toxicity for the death of SOM neurons, since these highly vulnerable interneurons are also affected in a number of pathological scenarios without Abeta accumulation, including traumatic brain injury 50 or epilepsy 43, 45, 64. In line with this latter, it has been reported that hippocampal SOM neurons display a high density of NMDA receptors 57, which are involved in excitotoxic mechanisms, thus an increase in the excitability of the pyramidal glutamatergic neurons, which are reciprocally interconnected with the SOM interneurons 16, could be at the basis of the loss of these interneurons. Of course, a relationship between amyloid plaques and hyperactivity in nearby neurons has been described in AD mouse models 13, which again involves Abeta in the SOM loss. This significant loss of SOM neurons in AD brains, however, could also contribute to the amyloid burden, since somatostatin induces the expression of neprilysin, an enzyme involved in Abeta degradation 66. Therefore, loss of SOM neurons would lead to more accumulation of Abeta, and greater loss of these interneurons, entering a vicious circle. It is also noteworthy that a subpopulation of SOM interneurons was resistant to the Abeta pathology. A subset of this stable SOM population expressed nNOS, however, at present we do not know the reasons that determine this protection to Abeta. Further work should be done to clarify this point.
SOM interneurons are low‐threshold spiking cells that generally target the more distal dendrites of pyramidal cells, which receive excitatory input 31, 65, 81 thus likely regulating the dendritic integration of the excitatory synaptic inputs 16. Recently, SOM neurons have been identified as regulators of beta/low gamma (20–30 Hz) oscillations in the neocortex 83, thus a loss of these interneurons could reduce the activity in this frequency range affecting overlying processes. In this sense, the participation of SOM cells in synaptic plasticity and memory processes has been widely documented 49, 87, and it has been suggested that a downregulation of somatostatin, and in consequence the levels of the Abeta‐cleaving enzyme neprilysin, is a main risk factor for the development of AD 30. Moreover, it has recently been proposed that SOM might directly influence AD pathology by interacting with Abeta and interfering its fibrillization 75. Therefore, the declining of SOM cells during AD might lead to amyloid accumulation and plaque formation.
Distinctly from SOM neurons, PV‐positive interneurons are preserved in the perirhinal cortex of our amyloidogenic transgenic model. These results are similar to those we previously reported in the hippocampus, entorhinal cortex and subiculum of the same transgenic mouse, where no age‐related loss of PV neurons has been observed 55, 63, 82, which raises the possibility that this GABAergic population is resistant to the toxic effects of Abeta. In fact, no PV‐immunoreactive dystrophic structures were observed in the proximity of Abeta plaques in none of the studied regions in our APP/PS1 model. Contrary to what was observed in the APP/PS1 model, the perirhinal cortex of AD patients showed a significant decrease in the number of PV neurons, together with a marked reduction of the immunoreactive axonal plexus, in comparison with the control subjects. While early studies analyzing cortical areas such as visual, temporal or prefrontal cortex reported no changes in the PV neuronal population in AD subjects 26, 35, 46, 70, studies of the entorhinal cortex or hippocampus, regions early affected by the tau pathology, showed a significant loss of PV neurons in AD patients 3, 11, 54, 73, 76, 79. Though it is unknown what causes the loss of PV neurons in AD, major histopathological differences between the APP/PS1 mouse model and AD brains could shed some light on the effect of different toxic scenarios to the PV neurons. As we have shown in this work and previously 55, 63, 82, the number of PV neurons does not change in different cerebral regions of our amyloidogenic transgenic mouse, thus suggesting that this GABAergic population is resistant to Abeta. In contrast, the APP/PS1 transgenic mice do not develop intracellular neurofibrillary tangles of aggregated phosphorylated tau, a main hallmark of AD brains very abundant in most AD‐affected regions including the perirhinal cortex, where tau tangles may accumulate even in the asymptomatic stages 10. Therefore, aggregates of phospho‐tau, instead of Abeta, could represent the possible toxic agent underlying the loss of PV neurons in AD brains. In fact, the accumulation of pSer262 and pThr205 tau in these cells has been recently reported 21. Consistent with the idea that phosphorylated tau is toxic to these GABAergic interneurons, loss of PV‐positive neurons has been reported in different models of tauopathy 47, 88.
Parvalbumin neurons target both perisomatic and axonal compartments of pyramidal neurons causing a powerful inhibition of these cells. In addition, since nearby PV neurons are electrically coupled by gap junctions, they form coordinated inhibitory networks, very suitable for synchronously modulating the activity of many pyramidal cells 34. Converging evidence supports fast‐spiking PV interneurons as a major source of pyramidal cell inhibition for generating gamma oscillatory activities 15, so loss of these GABAergic interneurons is, most likely, a main cause of network abnormalities. Accordingly, it has been shown that altered hippocampal oscillations in mouse models of AD are associated with deficits in PV function 59, 84. Moreover, gamma frequency in AD patients is disrupted 77. Interestingly, a direct relationship between gamma frequency deficit and AD pathology has recently been determined 38. Stimulation of gamma waves in multiple AD mouse models reduced Abeta load and phosphorylated tau accumulation. Therefore, the loss of PV cells in the perirhinal cortex might significantly contribute to AD‐related pathology in this vulnerable brain region. Besides inhibiting locally, PV neurons in the perirhinal cortex also project to the superficial layers of the entorhinal cortex, mediating a feedforward inhibition that controls the output signals connecting this region with the hippocampus 86. Therefore, a reduced activity in this GABAergic population could promote hyperactivity in the entorhinal cortex and, consequently, hyperexcitability across the hippocampus 53. Interestingly, the hippocampal hyperactivity has also been associated with the spread of tau pathology before the clinical symptoms of AD 37.
Within the medial temporal lobe, the perirhinal cortex strongly connects with the entorhinal cortex, parahippocampal cortex and amygdala, providing, moreover, an indirect route of communication with the hippocampal/subicular region 23, 78. In fact, perirhinal cortex is engaged in complex memory functions such as object recognition, visual perception, contextual association and spatial orientation 19, 78. Specifically, this region supports associative recognition based on familiarity 32. Thus, disrupted functional connectivity of the perirhinal cortex, as a result of the early SOM and PV neurodegeneration, might contribute to the altered memory processes and cognitive failure observed in the initial phases of AD patients. Finally, the different vulnerability exhibited by PV interneurons in the perirhinal cortex of APP/PS1 mice and AD brains, exposes the limitations of amyloidogenic models to reproduce all the complexity of human AD pathology.
Conflict of Interest
The authors have no conflict of interest to declare.
Author Contributions
AG, JV, JCD and ESM conceived the project and contributed in writing the manuscript. ESM and CND carried out the histology and immunohistochemical studies, and designed the figures. RSV, JJFV, AGA and MMO assisted with stereological analysis, confocal microscopy and data analysis. JAGL, LTE, DBV and IMG critically revised the manuscript for intellectual content. All authors read and approved the final manuscript.
Supporting information
Figure S1. 6E10 immunostaining delimitates area 36 and 35 boundaries of the perirhinal cortex in APP/PS1 mice. A. Cytoarchitectonic features of areas 36 and 35 were first analyzed using cresyl violet staining (Nissl staining) in WT (a1 and a2) and APP/PS1 animals (a3 and a4). B. Immunohistochemistry with the 6E10 antibody exhibits a differential pattern of layer staining (intracellular hAPP labeling in principal neurons) in both areas of the APP/PS1 perirhinal cortex, as shown in the panoramic view image (b1). Superficial layers II‐III are heavily immunostained in area 35 whereas a very faint labeling is detected in area 36 (b2). Moreover, the deep layers of area 36 are robustly marked in contrast to the few neurons immunostained in layer V of area 35. Ent, entorhinal cortex; ec, external capsule; hp, hippocampus; PRC, perirhinal cortex; rf, rhinal sulcus; TeA, temporal association cortex; I‐VI, cortical layers. Scale bar: a1, a3 and b1, 500 µm; a2, a4 and b2, 200 µm.
Figure S2. nNOS‐expressing cells comprise an unaffected subpopulation of SOM‐positive interneurons in the perirhinal cortex of APP/PS1 mice. A. Double immunofluorescence for nNOS (red; a1 and a4) and SOM (green; a2 and a5) in the deep layers of perirhinal cortex (area 35) of transgenic mice at 6 months of age. Merged images (a3) reveal the existence of nNOS/SOM co‐expressing interneuron subpopulation (arrows indicate co‐localization; arrow heads indicate nNOS‐negative subpopulation of SOM‐neurons). Higher magnification details (a4‐a6) exhibit dystrophic neurites expressing both, nNOS and SOM markers. B. Data table shows the stereological counts of nNOS‐positive cells (cells/mm3) at 4, 6 and 12 months of age in WT and APP/PS1 mice (n=4/genotype/age). No significant differences are found, indicating the resistance to neurodegeneration of this cell population in the perirhinal cortex. Data (mean±SD) was analyzed by one‐way ANOVA P˃0.05 (F(5, 18)=0.749 for area 36; F(5, 18)=1.862 for area 35). ec, external capsule; rf, rhinal sulcus. V‐VI, cortical layers. Scale bars: a1‐a3, 50 µm; a4‐a6, 20 µm.
Figure S3. Cytoarchitecture of human parahippocampal gyrus. A. Nissl staining; a1 shows a panoramic view of a representative section from Braak II individual and a2 is a higher magnification detail of the perirhinal cortex. B. Abeta immunostaining (OC antibody); b1 shows a panoramic view of a section from Braak VI individual and b2 is a higher magnification detail of the immunolabeling in the perirhinal cortex. CA1‐3, cornu ammonis; DG, dentate gyrus; S, subiculum; PrS, presubiculum; PaS, parasubiculum; Ent, entorhinal cortex; PRC, perirhinal cortex; cols, colateral sulcus; I‐VI, cortical layers. Scale bar: a1 and b1, 2 mm; a2 and b2, 500 µm.
Table S1. Demographic data for post‐mortem human brains.
Acknowledgments
We thank Sanofi (France) for the APP/PS1 model used in this work and the Neurological Tissue Bank of IDIBELL‐Hospital of Bellvitge (Barcelona, Spain) for the post‐mortem brain samples supplied. In addition, we would also like to thank Mercedes Aneiros Ferrer for her excellent technical support.
This study was supported by Instituto de Salud Carlos III (ISCiii) of Spain, co‐financed by FEDER funds from European Union, through grants PI18/01557 (to AG) and PI18/01556 (to JV), and CIBERNED (to AG and JV), by Consejería de Economía, Innovación, Ciencia y Empleo, Junta de Andalucia Proyecto de Excelencia (CTS‐2035) (to JV and AG); by Malaga University grant PPIT.UMA.B1.2017/26 (to RSV). CND and JJFV were supported by FPI (Junta Andalucía) and FPU (Spanish Ministry of Science, Innovation and Universities) PhD fellowships, respectively. MMO held a Garantia Juvenil (Junta Andalucia) contract. RSV and JAGL held a postdoctoral contract from the University of Malaga, and AGA from CIBERNED.
Contributor Information
Javier Vitorica, Email: agutierrez@uma.es, Email: vitorica@us.es.
Antonia Gutierrez, Email: agutierrez@uma.es, Email: vitorica@us.es.
Data Availability Statement
All data generated in this study are included in this article and its online supplementary information.
References
- 1. Albuquerque MS, Mahar I, Davoli MA, Chabot J‐G, Mechawar N, Quirion R, Krantic S (2015) Regional and sub‐regional differences in hippocampal GABAergic neuronal vulnerability in the TgCRND8 mouse model of Alzheimer's disease. Front Aging Neurosci 7:30. 10.3389/fnagi.2015.00030. [DOI] [PMC free article] [PubMed] [Google Scholar]
- 2. Ambrad Giovannetti E, Fuhrmann M (2019) Unsupervised excitation: GABAergic dysfunctions in Alzheimer's disease. Brain Res 1707:216–226. 10.1016/J.BRAINRES.2018.11.042. [DOI] [PubMed] [Google Scholar]
- 3. Arai H, Emson PC, Mountjoy CQ, Carassco LH, Heizmann CW (1987) Loss of parvalbumin‐immunoreactive neurones from cortex in Alzheimer‐type dementia. Brain Res 418:164–169. 10.1016/0006-8993(87)90974-7. [DOI] [PubMed] [Google Scholar]
- 4. Arendt T, Bigl V, Arendt A, Tennstedt A (1983) Loss of neurons in the nucleus basalis of Meynert in Alzheimer's disease, paralysis agitans and Korsakoff's disease. Acta Neuropathol 61:101–108. 10.1007/BF00697388. [DOI] [PubMed] [Google Scholar]
- 5. Baglietto‐Vargas D, Moreno‐Gonzalez I, Sanchez‐Varo R, Jimenez S, Trujillo‐Estrada L, Sanchez‐Mejias E et al (2010) Calretinin interneurons are early targets of extracellular amyloid‐β pathology in PS1/AβPP Alzheimer mice hippocampus. J Alzheimer's Dis 21:119–132. 10.3233/JAD-2010-100066. [DOI] [PubMed] [Google Scholar]
- 6. Beal MF, Benoit R, Mazurek MF, Bird ED, Martin JB (1986) Somatostatin‐281–12‐like immunoreactivity is reduced in Alzheimer's disease cerebral cortex. Brain Res 368:380–383. 10.1016/0006-8993(86)90586-X. [DOI] [PubMed] [Google Scholar]
- 7. Belarbi K, Burnouf S, Fernandez‐Gomez F‐J, Desmercieres J, Troquier L, Brouillette J et al (2011) Loss of medial septum cholinergic neurons in THY‐Tau22 mouse model: what links with tau pathology? Curr Alzheimer Res 8:633–638. 10.2174/156720511796717230. [DOI] [PubMed] [Google Scholar]
- 8. Blanchard V, Moussaoui S, Czech C, Touchet N, Bonici B, Planche M et al (2003) Time sequence of maturation of dystrophic neurites associated with Aβ deposits in APP/PS1 transgenic mice. Exp Neurol 184:247–263. 10.1016/S0014-4886(03)00252-8. [DOI] [PubMed] [Google Scholar]
- 9. Braak H, Alafuzoff I, Arzberger T, Kretzschmar H, Tredici K (2006) Staging of Alzheimer disease‐associated neurofibrillary pathology using paraffin sections and immunocytochemistry. Acta Neuropathol 112:389–404. 10.1007/s00401-006-0127-z. [DOI] [PMC free article] [PubMed] [Google Scholar]
- 10. Braak H, Braak E (1991) Neuropathological stageing of Alzheimer‐related changes. Acta Neuropathol 82:239–259. 10.1007/BF00308809. [DOI] [PubMed] [Google Scholar]
- 11. Brady D, Mufson E (1997) Parvalbumin‐immunoreactive neurons in the hippocampal formation of Alzheimer's diseased brain. Neuroscience 80:1113–1125. 10.1016/S0306-4522(97)00068-7. [DOI] [PubMed] [Google Scholar]
- 12. Burgos‐Ramos E, Hervás‐Aguilar A, Aguado‐Llera D, Puebla‐Jiménez L, Hernández‐Pinto AM, Barrios V, Arilla‐Ferreiro E (2008) Somatostatin and Alzheimer's disease. Mol Cell Endocrinol 286:104–111. 10.1016/j.mce.2008.01.014. [DOI] [PubMed] [Google Scholar]
- 13. Busche MA, Chen X, Henning HA, Reichwald J, Staufenbiel M, Sakmann B, Konnerth A (2012) Critical role of soluble amyloid‐β for early hippocampal hyperactivity in a mouse model of Alzheimer's disease. Proc Natl Acad Sci U S A 109:8740–8745. 10.1073/pnas.1206171109. [DOI] [PMC free article] [PubMed] [Google Scholar]
- 14. Caballero C, Jimenez S, Moreno‐Gonzalez I, Baglietto‐Vargas D, Sanchez‐Varo R, Gavilan MP et al (2007) Inter‐individual variability in the expression of the mutated form of hPS1M146L determined the production of Aβ peptides in the PS1xAPP transgenic mice. J Neurosci Res 85:787–797. 10.1002/jnr.21172. [DOI] [PubMed] [Google Scholar]
- 15. Cardin JA (2016) Snapshots of the brain in action: local circuit operations through the lens of γ oscillations. J Neurosci 36:10496–10504. 10.1523/JNEUROSCI.1021-16.2016. [DOI] [PMC free article] [PubMed] [Google Scholar]
- 16. Cardin JA (2018) Inhibitory interneurons regulate temporal precision and correlations in cortical circuits. Trends Neurosci 41:689–700. 10.1016/j.tins.2018.07.015. [DOI] [PMC free article] [PubMed] [Google Scholar]
- 17. Chan‐Palay V (1987) Somatostatin immunoreactive neurons in the human hippocampus and cortex shown by immunogold/silver intensification on vibratome sections: coexistence with neuropeptide Y neurons, and effects alzheimer‐type dementia. J Comp Neurol 260:201–223. 10.1002/cne.902600205. [DOI] [PubMed] [Google Scholar]
- 18. Colom LV, Castañeda MT, Bañuelos C, Puras G, García‐Hernández A, Hernandez S et al (2010) Medial septal β‐amyloid 1–40 injections alter septo‐hippocampal anatomy and function. Neurobiol Aging 31:46–57. 10.1016/J.NEUROBIOLAGING.2008.05.006. [DOI] [PMC free article] [PubMed] [Google Scholar]
- 19. Connor CE, Knierim JJ (2017) Integration of objects and space in perception and memory. Nat Neurosci 20:1493–1503. 10.1038/nn.4657. [DOI] [PMC free article] [PubMed] [Google Scholar]
- 20. Davies P, Katzman R, Terry RD (1980) Reduced somatostatin‐like immunoreactivity in cerebral cortex from cases of Alzheimer disease and Alzheimer senile dementa. Nature 288:279–280. 10.1038/288279a0. [DOI] [PubMed] [Google Scholar]
- 21. Dávila‐Bouziguet E, Targa‐Fabra G, Ávila J, Soriano E, Pascual M (2019) Differential accumulation of Tau phosphorylated at residues Thr231, Ser262 and Thr205 in hippocampal interneurons and its modulation by Tau mutations (VLW) and amyloid‐β peptide. Neurobiol Dis 125:232–244. 10.1016/j.nbd.2018.12.006. [DOI] [PubMed] [Google Scholar]
- 22. Delhaye E, Bahri MA, Salmon E, Bastin C (2019) Impaired perceptual integration and memory for unitized representations are associated with perirhinal cortex atrophy in Alzheimer's disease. Neurobiol Aging 73:135–144. 10.1016/J.NEUROBIOLAGING.2018.09.021. [DOI] [PubMed] [Google Scholar]
- 23. Ding SL, Van Hoesen GW (2010) Borders, extent, and topography of human perirhinal cortex as revealed using multiple modern neuroanatomical and pathological markers. Hum Brain Mapp 31:1359–1379. 10.1002/hbm.20940. [DOI] [PMC free article] [PubMed] [Google Scholar]
- 24. Dournaud P, Delaere P, Hauw JJ, Epelbaum J (1995) Differential correlation between neurochemical deficits, neuropathology, and cognitive status in Alzheimer's disease. Neurobiol Aging 16:817–823. 10.1016/0197-4580(95)00086-T. [DOI] [PubMed] [Google Scholar]
- 25. Epelbaum J, Guillou JL, Gastambide F, Hoyer D, Duron E, Viollet C (2009) Somatostatin, Alzheimer's disease and cognition: an old story coming of age? Prog Neurogibol 89:153–161. 10.1016/j.pneurobio.2009.07.002. [DOI] [PubMed] [Google Scholar]
- 26. Ferrer I, Soriano E, Tuñón T, Fonseca M, Guionnet N (1991) Parvalbumin immunoreactive neurons in normal human temporal neocortex and in patients with Alzheimer's disease. J Neurol Sci 106:135–141. 10.1016/0022-510X(91)90250-B. [DOI] [PubMed] [Google Scholar]
- 27. Gabriel SM, Bierer LM, Harotunian V, Purohit DP, Perl DP, Davis KL (1993) Widespread deficits in somatostatin but not neuropeptide Y concentrations in Alzheimer's disease cerebral cortex. Neurosci Lett 155:116–120. 10.1016/0304-3940(93)90686-F. [DOI] [PubMed] [Google Scholar]
- 28. Gahete MD, Rubio A, Durán‐Prado M, Avila J, Luque RM, Castao JP (2010) Expression of somatostatin, cortistatin, and their receptors, as well as dopamine receptors, but not of neprilysin, are reduced in the temporal lobe of Alzheimer's disease patients. J Alzheimer's Dis 20:465–475. 10.3233/JAD-2010-1385. [DOI] [PubMed] [Google Scholar]
- 29. Grouselle D, Winsky‐Sommerer R, David JP, Delacourte A, Dournaud P, Epelbaum J (1998) Loss of somatostatin‐like immunoreactivity in the frontal cortex of Alzheimer patients carrying the apolipoprotein epsilon 4 allele. Neurosci Lett 255:21–24. 10.1016/S0304-3940(98)00698-3. [DOI] [PubMed] [Google Scholar]
- 30. Hama E, Saido TC (2005) Etiology of sporadic Alzheimer's disease: somatostatin, neprilysin, and amyloid β peptide. Med Hypotheses 65:498–500. 10.1016/j.mehy.2005.02.045. [DOI] [PubMed] [Google Scholar]
- 31. Hangya B, Pi H‐J, Kvitsiani D, Ranade SP, Kepecs A (2014) From circuit motifs to computations: mapping the behavioral repertoire of cortical interneurons. Curr Opin Neurobiol 26:117–124. 10.1016/J.CONB.2014.01.007. [DOI] [PMC free article] [PubMed] [Google Scholar]
- 32. Haskins AL, Yonelinas AP, Quamme JR, Ranganath C (2008) Perirhinal cortex supports encoding and familiarity‐based recognition of novel associations. Neuron 59:554–560. 10.1016/j.neuron.2008.07.035. [DOI] [PubMed] [Google Scholar]
- 33. Heimer‐McGinn VR, Poeta DL, Aghi K, Udawatta M, Burwell RD (2017) Disconnection of the perirhinal and postrhinal cortices impairs recognition of objects in context but not contextual fear conditioning. J Neurosci 37:4819–4829. 10.1523/JNEUROSCI.0254-17.2017. [DOI] [PMC free article] [PubMed] [Google Scholar]
- 34. Hestrin S, Galarreta M (2005) Electrical synapses define networks of neocortical GABAergic neurons. Trends Neurosci 28:304–309. 10.1016/J.TINS.2005.04.001. [DOI] [PubMed] [Google Scholar]
- 35. Hof PR, Cox K, Young WG, Celio MR, Rogers J, Morrison JH (1991) Parvalbumin‐immunoreactive neurons in the neocortex are resistant to degeneration in Alzheimer's disease. J Neuropathol Exp Neurol 50:451–462. [DOI] [PubMed] [Google Scholar]
- 36. Howlett DR, Bowler K, Soden PE, Riddell D, Davis JB, Richardson JC et al (2008) Abeta deposition and related pathology in an APP x PS1 transgenic mouse model of Alzheimer's disease. Histol Histopathol 23:67–76. 10.14670/HH-23.67. [DOI] [PubMed] [Google Scholar]
- 37. Huijbers W, Schultz AP, Papp KV, LaPoint MR, Hanseeuw B, Chhatwal JP et al (2019) Tau accumulation in clinically normal older adults is associated with hippocampal hyperactivity. J Neurosci 39:548–556. 10.1523/JNEUROSCI.1397-18.2018. [DOI] [PMC free article] [PubMed] [Google Scholar]
- 38. Iaccarino HF, Singer AC, Martorell AJ, Rudenko A, Gao F, Gillingham TZ et al (2016) Gamma frequency entrainment attenuates amyloid load and modifies microglia. Nature 540:230–235. 10.1038/nature20587. [DOI] [PMC free article] [PubMed] [Google Scholar]
- 39. Jimenez S, Baglietto‐Vargas D, Caballero C, Moreno‐Gonzalez I, Torres M, Sanchez‐Varo R et al (2008) Inflammatory response in the hippocampus of PS1M146L/APP751SL mouse model of Alzheimer's disease: age‐dependent switch in the microglial phenotype from alternative to classic. J Neurosci 28:11650–11661. 10.1523/JNEUROSCI.3024-08.2008. [DOI] [PMC free article] [PubMed] [Google Scholar]
- 40. Jimenez S, Torres M, Vizuete M, Sanchez‐Varo R, Sanchez‐Mejias E, Trujillo‐Estrada L et al (2011) Age‐dependent accumulation of soluble Abeta oligomers reverses the neuroprotective effect of sAPPα by modulating PI3K/Akt‐GSK‐3β pathway in Alzheimer mice model. J Biol Chem 286:18414–18425. 10.1074/jbc.M110.209718. [DOI] [PMC free article] [PubMed] [Google Scholar]
- 41. Keene CS, Bladon J, McKenzie S, Liu CD, O'Keefe J, Eichenbaum H (2016) Complementary functional organization of neuronal activity patterns in the perirhinal, lateral entorhinal, and medial entorhinal cortices. J Neurosci 36:3660–3675. 10.1523/JNEUROSCI.4368-15.2016. [DOI] [PMC free article] [PubMed] [Google Scholar]
- 42. Kim D, Jeong H, Lee J, Ghim JW, Her ES, Lee SH, Jung MW (2016) Distinct roles of parvalbumin‐ and somatostatin‐expressing interneurons in working memory. Neuron 92:902–915. 10.1016/j.neuron.2016.09.023. [DOI] [PubMed] [Google Scholar]
- 43. Kobayashi M, Buckmaster PS (2003) Reduced inhibition of dentate granule cells in a model of temporal lobe epilepsy. J Neurosci 23:2440–2452. 10.1523/JNEUROSCI.23-06-02440.2003. [DOI] [PMC free article] [PubMed] [Google Scholar]
- 44. Kumar U (2005) Expression of somatostatin receptor subtypes (SSTR1‐5) in Alzheimer's disease brain: an immunohistochemical analysis. Neuroscience 134:525–538. 10.1016/j.neuroscience.2005.04.001. [DOI] [PubMed] [Google Scholar]
- 45. de Lanerolle NC, Kim JH, Robbins RJ, Spencer DD (1989) Hippocampal interneuron loss and plasticity in human temporal lobe epilepsy. Brain Res 495:387–395. [DOI] [PubMed] [Google Scholar]
- 46. Leuba G, Kraftsik R, Saini K (1998) Quantitative distribution of parvalbumin, calretinin, and calbindin D‐28k immunoreactive neurons in the visual cortex of normal and alzheimer cases. Exp Neurol 152:278–291. 10.1006/exnr.1998.6838. [DOI] [PubMed] [Google Scholar]
- 47. Levenga J, Krishnamurthy P, Rajamohamedsait H, Wong H, Franke TF, Cain P et al (2013) Tau pathology induces loss of GABAergic interneurons leading to altered synaptic plasticity and behavioral impairments. Acta Neuropathol Commun 1:34. 10.1186/2051-5960-1-34. [DOI] [PMC free article] [PubMed] [Google Scholar]
- 48. Li H, Shen X (2000) Selective loss of basal forebrain cholinergic neurons in APP770 transgenic mice. Chin Med J (Engl) 113:1040–1042. [PubMed] [Google Scholar]
- 49. Liguz‐Lecznar M, Urban‐Ciecko J, Kossut M (2016) Somatostatin and somatostatin‐containing neurons in shaping neuronal activity and plasticity. Front Neural Circuits 10:48. 10.3389/fncir.2016.00048. [DOI] [PMC free article] [PubMed] [Google Scholar]
- 50. Lowenstein D, Thomas M, Smith D, McIntosh T (1992) Selective vulnerability of dentate hilar neurons following traumatic brain injury: a potential mechanistic link between head trauma and disorders of the hippocampus. J Neurosci 12:4846–4853. [DOI] [PMC free article] [PubMed] [Google Scholar]
- 51. Mai JK, Paxinos G, Voss T (2008) Atlas of the Human Brain, 3rd edn. Academic Press: New York. [Google Scholar]
- 52. Mash DC, Flynn DD, Potter LT (1985) Loss of M2 muscarine receptors in the cerebral cortex in Alzheimer's disease and experimental cholinergic denervation. Science 228:1115–1117. 10.1126/SCIENCE.3992249. [DOI] [PubMed] [Google Scholar]
- 53. Maurer AP, Burke SN, Diba K, Barnes CA (2017) Attenuated activity across multiple cell types and reduced monosynaptic connectivity in the aged perirhinal cortex. J Neurosci 37:8965–8974. 10.1523/JNEUROSCI.0531-17.2017. [DOI] [PMC free article] [PubMed] [Google Scholar]
- 54. Mikkonen M, Alafuzoff I, Tapiola T, Soininen H, Miettinen R (1999) Subfield‐ and layer‐specific changes in parvalbumin, calretinin and calbindin‐D28k immunoreactivity in the entorhinal cortex in Alzheimer's disease. Neuroscience 92:515–532. 10.1016/S0306-4522(99)00047-0. [DOI] [PubMed] [Google Scholar]
- 55. Moreno‐Gonzalez I, Baglietto‐Vargas D, Sanchez‐Varo R, Jimenez S, Trujillo‐Estrada L, Sanchez‐Mejias E et al (2009) Extracellular amyloid‐β and cytotoxic glial activation induce significant entorhinal neuron loss in young PS1M146L/APP751SL mice. J Alzheimer's Dis 18:755–776. 10.3233/JAD-2009-1192. [DOI] [PubMed] [Google Scholar]
- 56. Naya Y (2016) Declarative association in the perirhinal cortex. Neurosci Res 113:12–18. 10.1016/J.NEURES.2016.07.001. [DOI] [PubMed] [Google Scholar]
- 57. Nyíri G, Stephenson FA, Freund TF, Somogyi P (2003) Large variability in synaptic N‐methyl‐D‐aspartate receptor density on interneurons and a comparison with pyramidal‐cell spines in the rat hippocampus. Neuroscience 119:347–363. 10.1016/S0306-4522(03)00157-X. [DOI] [PubMed] [Google Scholar]
- 58. Ognjanovski N, Schaeffer S, Wu J, Mofakham S, Maruyama D, Zochowski M, Aton SJ (2017) Parvalbumin‐expressing interneurons coordinate hippocampal network dynamics required for memory consolidation. Nat Commun 8:1–13. 10.1038/ncomms15039. [DOI] [PMC free article] [PubMed] [Google Scholar]
- 59. Palop JJ, Chin J, Roberson ED, Wang J, Thwin MT, Bien‐Ly N et al (2007) Aberrant excitatory neuronal activity and compensatory remodeling of inhibitory hippocampal circuits in mouse models of Alzheimer's disease. Neuron 55:697–711. 10.1016/j.neuron.2007.07.025. [DOI] [PMC free article] [PubMed] [Google Scholar]
- 60. Palop JJ, Mucke L (2016) Network abnormalities and interneuron dysfunction in Alzheimer disease. Nat Rev Neurosci. 10.1038/nrn.2016.141. [DOI] [PMC free article] [PubMed] [Google Scholar]
- 61. Paxinos G, Franklin KBJ (2013) The mouse brain in stereotaxic coordinates, 2nd edn. Academic Press: Orlando, FL. [Google Scholar]
- 62. Perry EK, Curtis M, Dick DJ, Candy JM, Atack JR, Bloxham CA et al (1985) Cholinergic correlates of cognitive impairment in Parkinson's disease: comparisons with Alzheimer's disease. J Neurol Neurosurg Psychiatry 48:413–421. 10.1136/JNNP.48.5.413. [DOI] [PMC free article] [PubMed] [Google Scholar]
- 63. Ramos B, Baglietto‐Vargas D, del Rio JC, Moreno‐Gonzalez I, Santa‐Maria C, Jimenez S et al (2006) Early neuropathology of somatostatin/NPY GABAergic cells in the hippocampus of a PS1 × APP transgenic model of Alzheimer's disease. Neurobiol Aging 27:1658–1672. 10.1016/j.neurobiolaging.2005.09.022. [DOI] [PubMed] [Google Scholar]
- 64. Robbins RJ, Brines ML, Kim JH, Adrian T, De Lanerolle N, Welsh S, Spencer DD (1991) A selective loss of somatostatin in the hippocampus of patients with temporal lobe epilepsy. Ann Neurol 29:325–332. 10.1002/ana.410290316. [DOI] [PubMed] [Google Scholar]
- 65. Rudy B, Fishell G, Lee SH, Hjerling‐Leffler J (2011) Three groups of interneurons account for nearly 100% of neocortical GABAergic neurons. Dev Neurobiol 71:45–61. 10.1002/dneu.20853. [DOI] [PMC free article] [PubMed] [Google Scholar]
- 66. Saito T, Iwata N, Tsubuki S, Takaki Y, Takano J, Huang S‐M et al (2005) Somatostatin regulates brain amyloid beta peptide Abeta42 through modulation of proteolytic degradation. Nat Med 11:434–439. 10.1038/nm1206. [DOI] [PubMed] [Google Scholar]
- 67. Saiz‐Sanchez D, De la Rosa‐Prieto C, Ubeda‐Banon I, Martinez‐Marcos A (2015) Interneurons, tau and amyloid‐β in the piriform cortex in Alzheimer's disease. Brain Struct Funct 220:2011–2025. 10.1007/s00429-014-0771-3. [DOI] [PubMed] [Google Scholar]
- 68. Saiz‐Sanchez D, Ubeda‐Bañon I, de la Rosa‐Prieto C, Argandoña‐Palacios L, Garcia‐Muñozguren S, Insausti R, Martinez‐Marcos A (2010) Somatostatin, tau, and β‐amyloid within the anterior olfactory nucleus in Alzheimer disease. Exp Neurol 223:347–350. 10.1016/j.expneurol.2009.06.010. [DOI] [PubMed] [Google Scholar]
- 69. Saiz‐Sanchez D, Ubeda‐Baon I, De La Rosa‐Prieto C, Martinez‐Marcos A (2012) Differential expression of interneuron populations and correlation with amyloid‐β deposition in the olfactory cortex of an aβPP/PS1 transgenic mouse model of Alzheimer's disease. J Alzheimer's Dis 31:113–129. 10.3233/JAD-2012-111889. [DOI] [PubMed] [Google Scholar]
- 70. Sampson VL, Morrison JH, Vickers JC (1997) The cellular basis for the relative resistance of parvalbumin and calretinin immunoreactive neocortical neurons to the pathology of Alzheimer's disease. Exp Neurol 145:295–302. 10.1006/exnr.1997.6433. [DOI] [PubMed] [Google Scholar]
- 71. Sanchez‐Mejias E, Navarro V, Jimenez S, Sanchez‐Mico M, Sanchez‐Varo R, Nuñez‐Diaz C et al (2016) Soluble phospho‐tau from Alzheimer's disease hippocampus drives microglial degeneration. Acta Neuropathol 132:897–916. 10.1007/s00401-016-1630-5. [DOI] [PMC free article] [PubMed] [Google Scholar]
- 72. Sanchez‐Varo R, Trujillo‐Estrada L, Sanchez‐Mejias E, Torres M, Baglietto‐Vargas D, Moreno‐Gonzalez I et al (2012) Abnormal accumulation of autophagic vesicles correlates with axonal and synaptic pathology in young Alzheimer's mice hippocampus. Acta Neuropathol 123:53–70. 10.1007/s00401-011-0896-x. [DOI] [PMC free article] [PubMed] [Google Scholar]
- 73. Satoh J, Tabira T, Sano M, Nakayama H, Tateishi J (1991) Parvalbumin‐immunoreactive neurons in the human central nervous system are decreased in Alzheimer's disease. Acta Neuropathol 81:388–395. [DOI] [PubMed] [Google Scholar]
- 74. Schmid LC, Mittag M, Poll S, Steffen J, Wagner J, Geis HR et al (2016) Dysfunction of somatostatin‐positive interneurons associated with memory deficits in an Alzheimer's disease model. Neuron 92:114–125. 10.1016/j.neuron.2016.08.034. [DOI] [PubMed] [Google Scholar]
- 75. Solarski M, Wang H, Wille H, Schmitt‐Ulms G (2018) Somatostatin in Alzheimer's disease: a new Role for an Old Player. Prion 12:1–8. 10.1080/19336896.2017.1405207. [DOI] [PMC free article] [PubMed] [Google Scholar]
- 76. Solodkin A, Veldhuizen SD, Van Hoesen GW (1996) Contingent vulnerability of entorhinal parvalbumin‐containing neurons in Alzheimer's disease. J Neurosci 16:3311–3321. [DOI] [PMC free article] [PubMed] [Google Scholar]
- 77. Stam CJ, van Cappellen van Walsum AM, Pijnenburg YAL, Berendse HW, de Munck JC, Scheltens P, van Dijk BW (2002) Generalized synchronization of MEG recordings in Alzheimer's disease: evidence for involvement of the gamma band. J Clin Neurophysiol 19:562–574. [DOI] [PubMed] [Google Scholar]
- 78. Suzuki WA, Naya Y (2014) The perirhinal cortex. Annu Rev Neurosci 37:39–53. 10.1146/annurev-neuro-071013-014207. [DOI] [PubMed] [Google Scholar]
- 79. Takahashi H, Brasnjevic I, Rutten BPF, Van Der Kolk N, Perl DP, Bouras C et al (2010) Hippocampal interneuron loss in an APP/PS1 double mutant mouse and in Alzheimer's disease. Brain Struct Funct 214:145–160. 10.1007/s00429-010-0242-4. [DOI] [PMC free article] [PubMed] [Google Scholar]
- 80. Tamminga CA, Foster NL, Fedio P, Bird ED, Chase TN (1987) Alzheimer's disease: low cerebral somatostatin levels correlate with impaired cognitive function and cortical metabolism. Neurology 37:161–165. 10.1212/WNL.37.1.161. [DOI] [PubMed] [Google Scholar]
- 81. Tremblay R, Lee S, Rudy B (2016) GABAergic interneurons in the neocortex: from cellular properties to circuits. Neuron 91:260–292. 10.1016/j.neuron.2016.06.033. [DOI] [PMC free article] [PubMed] [Google Scholar]
- 82. Trujillo‐Estrada L, Dávila JC, Sánchez‐Mejias E, Sánchez‐Varo R, Gomez‐Arboledas A, Vizuete M et al (2014) Early neuronal loss and axonal/presynaptic damage is associated with accelerated amyloid‐β accumulation in AβPP/PS1 Alzheimer's disease mice subiculum. J Alzheimers Dis 42:521–541. 10.3233/JAD-140495. [DOI] [PubMed] [Google Scholar]
- 83. Veit J, Hakim R, Jadi MP, Sejnowski TJ, Adesnik H (2017) Cortical gamma band synchronization through somatostatin interneurons. Nat Neurosci 20:951–959. 10.1038/nn.4562. [DOI] [PMC free article] [PubMed] [Google Scholar]
- 84. Verret L, Mann EO, Hang GB, Barth AMI, Cobos I, Ho K et al (2012) Inhibitory interneuron deficit links altered network activity and cognitive dysfunction in Alzheimer model. Cell 149:708–721. 10.1016/J.CELL.2012.02.046. [DOI] [PMC free article] [PubMed] [Google Scholar]
- 85. Whitehouse PJ, Price DL, Clark AW, Coyle JT, DeLong MR (1981) Alzheimer disease: evidence for selective loss of cholinergic neurons in the nucleus basalis. Ann Neurol 10:122–126. 10.1002/ana.410100203. [DOI] [PubMed] [Google Scholar]
- 86. Willems JGP, Wadman WJ, Cappaert NLM (2018) Parvalbumin interneuron mediated feedforward inhibition controls signal output in the deep layers of the perirhinal‐entorhinal cortex. Hippocampus 28:281–296. 10.1002/hipo.22830. [DOI] [PMC free article] [PubMed] [Google Scholar]
- 87. Yavorska I, Wehr M (2016) Somatostatin‐expressing inhibitory interneurons in cortical circuits. Front Neural Circuits 10:1–18. 10.3389/fncir.2016.00076. [DOI] [PMC free article] [PubMed] [Google Scholar]
- 88. Zallo F, Gardenal E, Verkhratsky A, Rodríguez JJ (2018) Loss of calretinin and parvalbumin positive interneurones in the hippocampal CA1 of aged Alzheimer's disease mice. Neurosci Lett 681:19–25. 10.1016/j.neulet.2018.05.027. [DOI] [PubMed] [Google Scholar]
Associated Data
This section collects any data citations, data availability statements, or supplementary materials included in this article.
Supplementary Materials
Figure S1. 6E10 immunostaining delimitates area 36 and 35 boundaries of the perirhinal cortex in APP/PS1 mice. A. Cytoarchitectonic features of areas 36 and 35 were first analyzed using cresyl violet staining (Nissl staining) in WT (a1 and a2) and APP/PS1 animals (a3 and a4). B. Immunohistochemistry with the 6E10 antibody exhibits a differential pattern of layer staining (intracellular hAPP labeling in principal neurons) in both areas of the APP/PS1 perirhinal cortex, as shown in the panoramic view image (b1). Superficial layers II‐III are heavily immunostained in area 35 whereas a very faint labeling is detected in area 36 (b2). Moreover, the deep layers of area 36 are robustly marked in contrast to the few neurons immunostained in layer V of area 35. Ent, entorhinal cortex; ec, external capsule; hp, hippocampus; PRC, perirhinal cortex; rf, rhinal sulcus; TeA, temporal association cortex; I‐VI, cortical layers. Scale bar: a1, a3 and b1, 500 µm; a2, a4 and b2, 200 µm.
Figure S2. nNOS‐expressing cells comprise an unaffected subpopulation of SOM‐positive interneurons in the perirhinal cortex of APP/PS1 mice. A. Double immunofluorescence for nNOS (red; a1 and a4) and SOM (green; a2 and a5) in the deep layers of perirhinal cortex (area 35) of transgenic mice at 6 months of age. Merged images (a3) reveal the existence of nNOS/SOM co‐expressing interneuron subpopulation (arrows indicate co‐localization; arrow heads indicate nNOS‐negative subpopulation of SOM‐neurons). Higher magnification details (a4‐a6) exhibit dystrophic neurites expressing both, nNOS and SOM markers. B. Data table shows the stereological counts of nNOS‐positive cells (cells/mm3) at 4, 6 and 12 months of age in WT and APP/PS1 mice (n=4/genotype/age). No significant differences are found, indicating the resistance to neurodegeneration of this cell population in the perirhinal cortex. Data (mean±SD) was analyzed by one‐way ANOVA P˃0.05 (F(5, 18)=0.749 for area 36; F(5, 18)=1.862 for area 35). ec, external capsule; rf, rhinal sulcus. V‐VI, cortical layers. Scale bars: a1‐a3, 50 µm; a4‐a6, 20 µm.
Figure S3. Cytoarchitecture of human parahippocampal gyrus. A. Nissl staining; a1 shows a panoramic view of a representative section from Braak II individual and a2 is a higher magnification detail of the perirhinal cortex. B. Abeta immunostaining (OC antibody); b1 shows a panoramic view of a section from Braak VI individual and b2 is a higher magnification detail of the immunolabeling in the perirhinal cortex. CA1‐3, cornu ammonis; DG, dentate gyrus; S, subiculum; PrS, presubiculum; PaS, parasubiculum; Ent, entorhinal cortex; PRC, perirhinal cortex; cols, colateral sulcus; I‐VI, cortical layers. Scale bar: a1 and b1, 2 mm; a2 and b2, 500 µm.
Table S1. Demographic data for post‐mortem human brains.
Data Availability Statement
All data generated in this study are included in this article and its online supplementary information.