Abstract
Aim
Calcium ions play a pivotal role in matching energy supply and demand in cardiac muscle. Mitochondrial calcium concentration is lower in animal models of heart failure with reduced ejection fraction (HFrEF), but limited information is available about mitochondrial calcium handling in heart failure with preserved ejection fraction (HFpEF).
Methods
We assessed mitochondrial Ca2+ handling in intact cardiomyocytes from Zucker/fatty Spontaneously hypertensive F1 hybrid (ZSF1)‐lean (control) and ZSF1‐obese rats, a metabolic risk‐related model of HFpEF. A mitochondrially targeted Ca2+ indicator (MitoCam) was expressed in cultured adult rat cardiomyocytes. Cytosolic and mitochondrial Ca2+ transients were measured at different stimulation frequencies. Mitochondrial respiration and swelling, and expression of key proteins were determined ex vivo.
Results
At rest, mitochondrial Ca2+ concentration in ZSF1‐obese was larger than in ZSF1‐lean. The diastolic and systolic mitochondrial Ca2+ concentrations increased with stimulation frequency, but the steady‐state levels were larger in ZSF1‐obese. The half‐widths of the contractile responses, the resting cytosolic Ca2+ concentration and the decay half‐times of the cytosolic Ca2+ transients were higher in ZSF1‐obese, likely because of a lower SERCA2a/phospholamban ratio. Mitochondrial respiration was lower, particularly with nicotinamide adenine dinucleotide (NADH) (complex I) substrates, and mitochondrial swelling was larger in ZSF1‐obese.
Conclusion
The free mitochondrial calcium concentration is higher in HFpEF owing to alterations in mitochondrial and cytosolic Ca2+ handling. This coupling between cytosolic and mitochondrial Ca2+ levels may compensate for myocardial ATP supply in vivo under conditions of mild mitochondrial dysfunction. However, if mitochondrial Ca2+ concentration is sustainedly increased, it might trigger mitochondrial permeability transition pore opening.
Keywords: calcium, cardiac muscle, heart failure with preserved ejection fraction, mitochondria
1. INTRODUCTION
Heart failure (HF) with preserved ejection fraction (HFpEF) is a HF type characterized by increased end‐diastolic pressure and/or abnormal relaxation, but with near‐normal systolic contractile function, as ejection fraction is preserved. It is estimated that 50% of all patients with HF have HFpEF, but unfortunately, no specific treatment options are currently available for these patients.1 Metabolic risk factors are increasingly recognized as important initiators of HFpEF,2 and patients with HFpEF suffer from various comorbidities such as type 2 diabetes mellitus, hypertension, obesity and renal dysfunction. Alterations in metabolism and mitochondrial function are considered to play a key role in the initiation and progression of the disease.3 However, how impaired metabolism affects the near‐normal contractile function of the heart (the so‐called excitation‐energetic coupling) is not well understood.4
Calcium ions regulate both contractile and mitochondrial activity and thus play a pivotal role in matching energy supply and demand in cardiac muscle. Mitochondrial ATP production rises upon an increase in the workload of the heart, through adenosine diphosphate (ADP) feedback as well as a feedforward mechanism by increasing mitochondrial calcium, and subsequent calcium‐activation of mitochondrial enzymes.4, 5, 6, 7, 8
Most of the current knowledge on mitochondrial calcium handing in HF is derived from animal models of heart failure with reduced ejection fraction (HFrEF). A lower mitochondrial Ca2+ concentration ([Ca2+]m) contributes to the reduction in in vivo ATP production and oxygen consumption rates in HFrEF.9, 10 Specific inhibition of the mitochondrial sodium‐calcium exchanger (mNCE) by CGP37157 was able to increase [Ca2+]m and resulted in a better matching between energy supply and demand.11 Regarding HFpEF, no studies have explored [Ca2+]m and its relationship with excitation‐energetic coupling yet. Instead, a couple of studies have described what happens in type 2 diabetes mellitus, a frequent comorbidity of HFpEF patients. Indeed, a reduction in [Ca2+]m was reported in the diabetic mouse heart,12 which could be attributed to a downregulation of the expression levels of the mitochondrial calcium uniporter (MCU). Pharmaceutical improvement in calcium and sodium ion homeostasis by empagliflozin, a promising drug for type 2 diabetes mellitus associated with increased myocardial energetic efficiency, also resulted in an acute increase in mitochondrial calcium concentration in cardiomyocytes.13 However, the interactions between cytosolic and mitochondrial calcium handling (and any impairments therein) in animal models of HFpEF are currently unclear.
The present study used a rat model of HFpEF associated with metabolic syndrome and altered myocardial substrate utilizationrat, namely the Zucker/fatty Spontaneously hypertensive F1 hybrid (ZSF1‐obese).14, 15 This well‐accepted animal model for HFpEF14, 15, 16 is characterized by hypertension, obesity and diabetes mellitus, and have hypertensive (ZSF1‐lean) animals as controls. In these groups, we studied cytosolic and mitochondrial calcium handing in intact cardiomyocytes (Figure 1). Mitochondrial calcium uptake has been studied to a great extent in isolated mitochondria in vitro, which lacks the spatial organization of mitochondria near the Ca2+ release units.17, 18, 19, 20 Therefore, we used a fast ratiometric Förster resonance energy transfer (FRET)‐based Ca2+ sensor (4mtD3cpv, MitoCam), genetically targeted at the mitochondrial matrix20, 21, 22 to determine the changes in free mitochondrial and cytosolic calcium concentration in situ in cardiomyocytes from ZSF1‐obese and ZSF1‐lean rats. To mechanistically link any possible differences, we also determined the expression of proteins involved in calcium handling as well as Ca2+‐induced mitochondrial swelling and maximal mitochondrial respiration.
Figure 1.
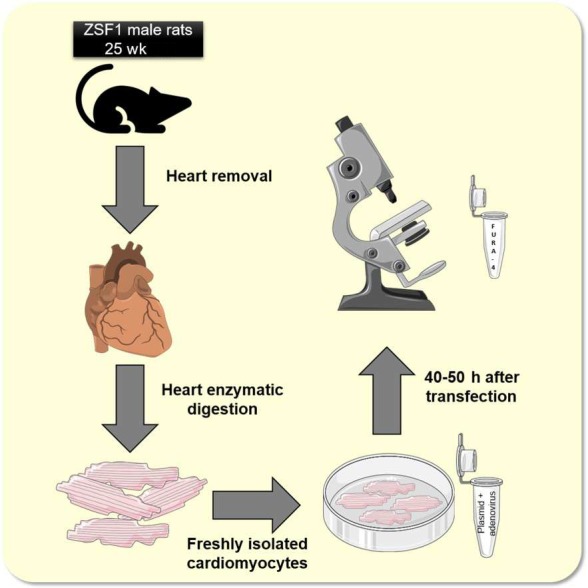
Graphical overview of the experimental design. In short, freshly isolated rat cardiomyocytes were kept in culture for up to 50 hours to allow for the 4mtD3cpv Cameleon (MitoCam) to be expressed. Mitochondrial and cytosolic (in untransfected cells by Fura‐4) calcium concentration was measured in electrically stimulated cardiomyocytes. Pictures are from Servier Medical Art
2. RESULTS
2.1. Morphometry, cardiac function and exercise tolerance
ZSF1‐obese rats progressively developed obesity over 18 weeks, LV hypertrophy and a more advanced stage of hypertension in comparison with ZSF1‐lean rats (see Table 1).
Table 1.
Morphometry, exercise tolerance and cardiac function in ZSF1‐lean and ZSF1‐obese animals (between 18 and 25 weeks). ZSF1‐obese animals displayed typical characteristics for heart failure with preserved ejection fraction (HFpEF), namely obesity, hypertension, exercise intolerance and diastolic dysfunction
| ZSF1‐lean (n = 11) | ZSF1‐obese (n = 11) | P‐value | |
|---|---|---|---|
| Blood pressure measurements | |||
| Heart rate (bpm) | 328 ± 8 | 353 ± 11 | NS |
| Systolic (mm Hg) | 147 ± 2 | 170 ± 6 | 0.005 |
| Diastolic (mm Hg) | 108 ± 2 | 130 ± 7 | 0.009 |
| Mean (mm Hg) | 120 ± 2 | 143 ± 7 | 0.007 |
| Oxygen consumption under maximum effort | |||
| VO2max (ml/min/kg0.75) | 28.1 ± 1.5 | 17.5 ± 0.4 | <0.001 |
| VCO2 (ml/min/kg0.75) | 25.7 ± 1.3 | 17.8 ± 0.3 | <0.001 |
| Peak work rate (m/min/kg) | 19.8 ± 0.9 | 12.9 ± 0.4 | <0.001 |
| Total work load (m/Kg) | 150.3 ± 14.9 | 58.5 ± 2.6 | <0.001 |
| Echocardiographic parameters | |||
| BW (g) | 492 ± 11 | 644 ± 10 | <0.001 |
| LVmassInd (g/cm2) | 1.32 ± 0.14 | 2.02 ± 0.15 | 0.006 |
| IVRT (ms) | 23.8 ± 1.1 | 29.4 ± 0.9 | <0.001 |
| E/A | 1.54 ± 0.06 | 1.27 ± 0.10 | 0.02 |
| E/E′ | 13.29 ± 0.92 | 16.96 ± 0.99 | 0.01 |
| LAAind | 0.287 ± 0.013 | 0.396 ± 0.011 | <0.001 |
| S′ (m/s) | 0.058 ± 0.001 | 0.048 ± 0.002 | 0.002 |
| EF (%) | 71 ± 4 | 69 ± 3 | 0.29 |
| Pulmonary oedema (g) | 0.384 ± 0.009 | 0.461 ± 0.013 | 0.008 |
| BNP (mRNA levels, A.U) | 100.0 ± 0.1 | 190.3 ± 0.2 | <0.001 |
Abbreviations: VO2max and VCO2max, maximal O2 consumption and CO2 production respectively
BW, body weight; LVmassInd, left ventricle mass indexed to body surface area (BSA); EDVI, end‐diastolic volume indexed to BSA; IVRT, isovolumetric relaxation time; E/A, ratio between the peak of pulse Doppler wave of early mitral flow velocity (E) to peak of pulse Doppler wave of late mitral flow velocity (A); E/E′, ratio between E wave and the peak of tissue Doppler velocity at the lateral mitral annulus (E′); LAAind, left atrium area indexed to BSA; S′, peak systolic velocity; EF, ejection fraction; BNP, brain natriuretic peptide. Values are mean ± SEM or threshold cycles for BNP.
At their 25th week of age, maximum aerobic capacity and maximal running distance were lower in ZSF1‐obese rats when compared to ZSF1‐lean animals. The echocardiographic evaluation showed a similar ejection fraction between groups, but ZSF1‐obese developed diastolic dysfunction, as assessed by an increased ratio of E/E′, a decreased E/A ratio and enlarged left atrial area. We measured brain natriuretic peptide (BNP) myocardial levels, a classic marker of HF used for HFpEF diagnosis. BNP levels were significantly augmented in ZSF1‐obese. Moreover, pulmonary oedema was evidenced by a higher wet‐to‐dry weight ratio of the lungs (Table 1). These data confirmed a typical HFpEF phenotype in our animal model, fulfilling the most recent European guidelines for HFpEF diagnosis.23
2.2. Mitochondrial calcium kinetics
Examples of the recordings obtained at 0.1 and 4 Hz in both groups are shown in Figure 2. The average baseline mitochondrial Ca2+ concentration was significantly larger in ZSF1‐obese relative to ZSF1‐lean (Figure 3A). The steady‐state end‐diastolic (Figure 3B) and peak systolic calcium levels (Figure 3C) reached during stimulation increased with stimulation frequency in both groups, but this increase was more pronounced in ZSF1‐obese than in ZSF1‐lean. The amplitude of the beat‐to‐beat changes decreased with stimulation frequency, this decline being larger in ZSF1‐lean than in ZSF1‐obese (Figure 3D). The rise time of [Ca2+]m decreased with stimulation frequency in ZSF1‐lean as well as ZSF1‐obese (Figure 3E). Of note, the mitochondrial calcium rise time at low stimulation frequency was significantly larger in ZSF1‐obese, but the values converged at 4 Hz. The mitochondrial calcium decay time (Figure 3F) became shorter with increasing stimulation frequency, similarly for both groups. These results indicate that diastolic and beat‐to‐beat mitochondrial calcium concentrations were higher in ZSF1‐obese than in ZSF1‐lean, but that the mitochondrial calcium decay kinetics were very similar between both groups.
Figure 2.
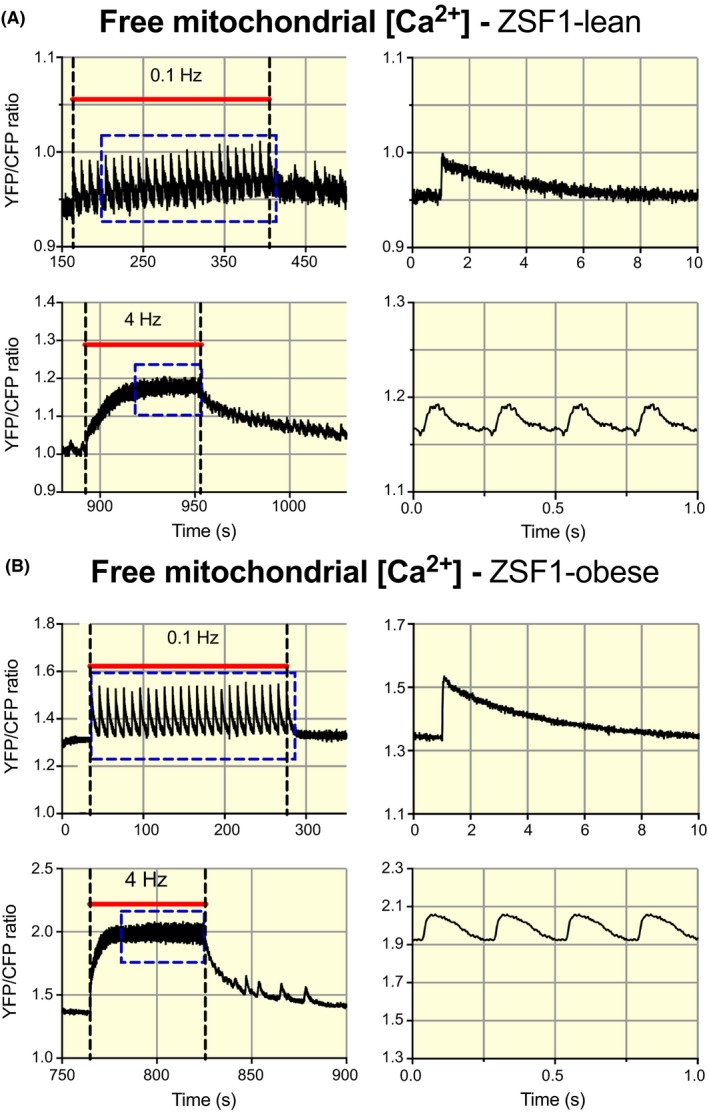
Frequency‐dependent alterations in mitochondrial Ca2+ handling in cardiomyocytes from the ZSF1‐lean and ZSF1‐obese group. A, Recordings of free mitochondrial Ca2+ concentration (Yellow fluorescent protein, YFP/chromatic Focus Probe, CFP ratio) obtained from a cardiomyocyte in the ZSF1‐lean group, stimulated during the periods indicated by the red bars at 0.1 and 4 Hz. The right column shows the corresponding averaged recordings indicated by the blue rectangles. The traces were obtained from a series of consecutive measurements 0.1, 1, 2 and 4 Hz, with 120 s pauses in between. B, Similar recordings obtained from a cardiomyocyte in the ZSF1‐obese group. An increase in mitochondrial Ca2+ concentration at baseline and marked increase in the amplitude of the beat‐to‐beat changes in mitochondrial Ca2+ concentration can be observed in ZSF1‐obese relative to ZSF1‐lean. For illustration purposes, the recordings on the left were low‐pass filtered at 10 Hz
Figure 3.
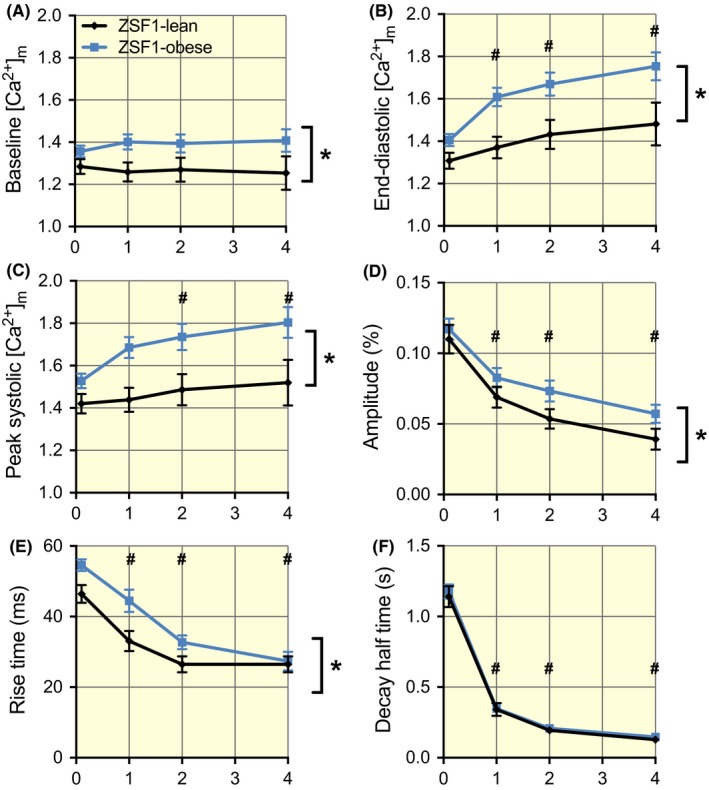
Enhanced levels of mitochondrial Ca2+ but similar frequency‐dependent kinetics of mitochondrial Ca2+ handling in the ZSF1‐obese group. A, The baseline values before the onset of stimulation were significantly larger in ZSF1‐obese in comparison to ZSF1‐lean. B and C, The end‐diastolic and peak systolic mitochondrial Ca2+ concentrations during stimulation were frequency‐dependent and significantly larger in ZSF1‐obese than in ZSF1‐lean. D, The amplitude of the beat‐to‐beat changes in mitochondrial Ca2+ concentration was frequency‐dependent and was significantly larger in ZSF1‐obese than in ZSF1‐lean. E, The speed of mitochondrial Ca2+ uptake was frequency‐dependent. The rise time of [Ca2+]m at low stimulation frequency in ZSF1‐obese was significantly larger than in ZSF1‐lean, but the values converged at 4 Hz. F, The speed of mitochondrial Ca2+ release was frequency‐dependent, but the values in both groups were very similar. The average values (±SEM) at 0.1, 1, 2 and 4 Hz were obtained from 76, 49, 37 and 23 different cells in ZSF1‐lean and from 122, 63, 48 and 31 different cells in ZSF1‐obese respectively. *P < .05 vs ZSF1‐lean; #P < .05 vs 0.1 Hz (two‐way ANOVA). No significant interaction was observed between groups and stimulation frequency
2.3. Sarcomere shortening
To assess the relationship between mitochondrial calcium handling and contractile function, we obtained simultaneous recordings of sarcomere shortening (see Figure 4A and 4B for typical examples). The average sarcomere length at rest (Figure 3C) and the amplitudes of sarcomere shortening (Figure 4D) in ZSF1‐lean and ZSF1‐obese were very similar, while both showed a small decline with increasing stimulation frequency. The rise time (Figure 4E), decay half‐time (Figure 4F) and the half‐width of the recordings (Figure 4G) also decreased with stimulation frequency, but the changes observed in ZSF1‐obese were significantly higher than in ZSF1‐lean. These data indicate a slower contraction and relaxation in ZSF1‐obese than in ZSF1‐lean, with unaltered peak contractile performance of the cardiomyocytes. These are reminiscent of the HFpEF phenotype, where the maximal systolic function is maintained, with altered cardiac relaxation.
Figure 4.
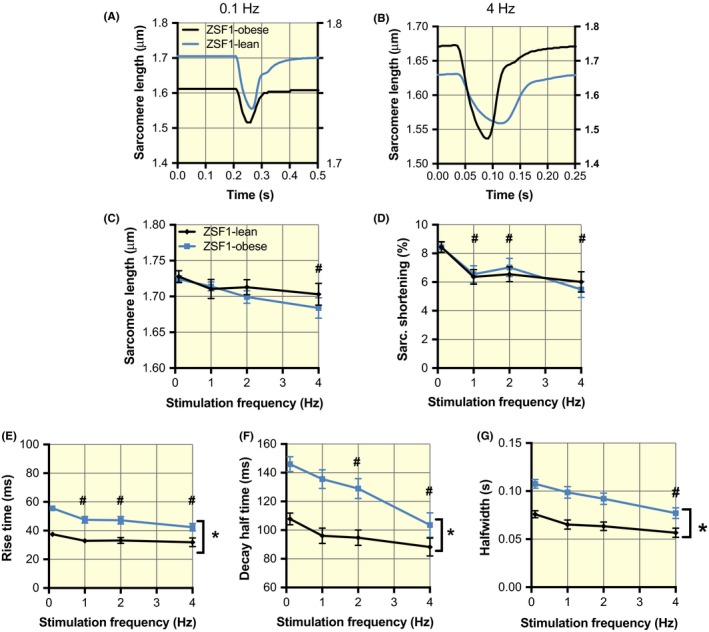
Slowed kinetics of sarcomere shortening in the ZSF1‐obese group. A and B, Recordings of the steady‐state changes in sarcomere length at 0.1 and 4 Hz, respectively, in ZSF1‐lean (black, left y‐axes) and ZSF1‐obese (red, right y‐axes). C and D, Similar diastolic sarcomere length and sarcomere shortening as a function of stimulation frequency in ZSF1‐lean and ZSF1‐obese. E and F, Slowing of both the rise time and the decay half‐time of sarcomere shortening. The recordings in A and B were obtained from the same cells as shown in Figure 1. G, Half‐width is significantly higher in ZSF1‐obese than ZSF1‐lean but this difference was attenuated with the increases of frequency. The average values (±SEM) at 0.1, 1, 2 and 4 Hz were obtained from 70, 47, 35 and 22 different cells in ZSF1‐lean and from 112, 62, 45 and 29 different cells in ZSF1‐obese respectively. *P < .05 vs ZSF1‐lean; #P < .05 vs 0.1 Hz (two‐way ANOVA). No significant interaction was observed between groups and stimulation frequency
2.4. Cytosolic free calcium handling
To further understand the altered mitochondrial calcium handling, we performed measurements of the free cytosolic Ca2+ transients at different stimulation frequencies (Figure 5A, 5B for examples). The cytosolic free Ca2+ concentration at rest was significantly higher in ZSF1‐obese than in ZSF1‐lean and in both groups (Figure 5C). The amplitudes of the transients were similar in both groups but decreased at higher stimulation frequencies (Figure 5D). The kinetics of cytosolic Ca2+ handling in ZSF1‐obese were slower compared to ZSF1‐lean: both rise time (contraction, Figure 5E) and decay half‐time (active relaxation, Figure 5F) were higher in ZSF1‐obese. Together with the sarcomere shortening, these data suggest that the higher resting cytosolic calcium concentration and slow kinetics of cytosolic Ca2+ handling in these paced cardiomyocytes could explain the slower contractile and active relaxation as well as the higher resting mitochondrial calcium concentration in HFpEF.
Figure 5.
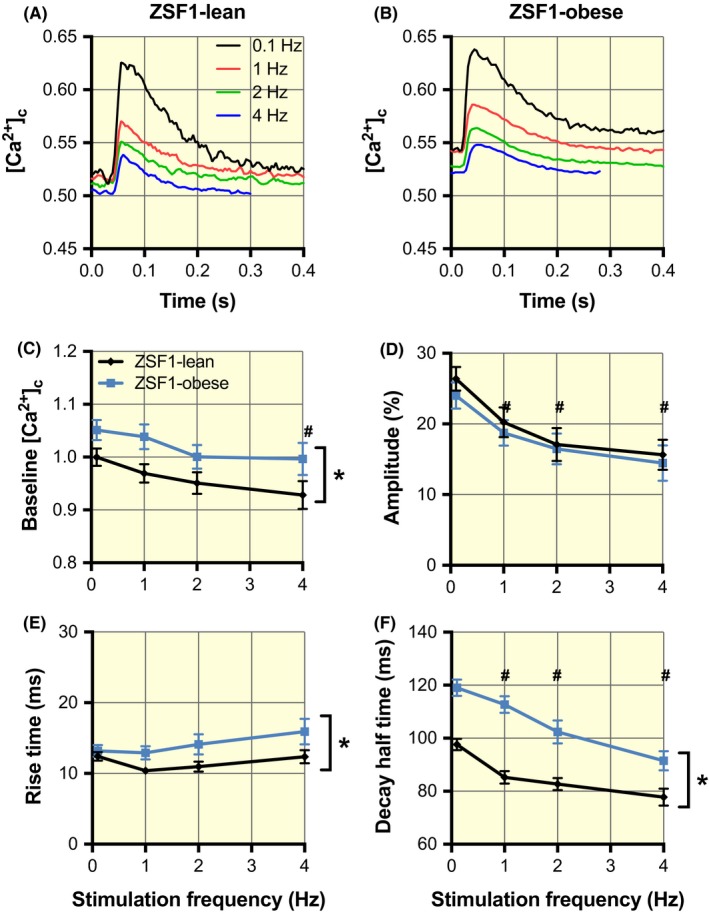
Increased cytosolic Ca2+ concentrations at baseline and slowing of cytosolic Ca2+ release and uptake in the ZSF1‐obese group. A and B, Averaged cytosolic Ca2+ transients (F340/F380 ratio) obtained at stimulation frequencies of 0.1, 1, 2 and 4 Hz in ZSF1‐lean and ZSF1‐obese respectively. C, The cytosolic Ca2+ concentration at baseline was significantly larger in ZSF1‐obese than in ZSF1‐lean. At 4 Hz, the baseline values were significantly smaller than at 0.1 Hz. D, The amplitude of the Ca2+ transients was frequency‐dependent but not significantly different in ZSF1‐obese compared to ZSF1‐lean. E, The rise time in ZSF1‐obese was larger than in ZSF1‐lean. F, The decay half‐time was significantly larger in ZSF1‐obese than in ZSF1‐lean and in both groups decreased with an increase in stimulation frequency. The average values (±SEM) at 0.1, 1, 2 and 4 Hz were obtained from 27, 28, 22 and 16 different cells in ZSF1‐lean and from 70, 64, 53 and 33 different cells in ZSF1‐obese respectively. *P < .05 vs ZSF1‐lean; #P < .05 vs 0.1 Hz (two‐way ANOVA). No significant interaction was observed between groups and stimulation frequency
2.5. Expression of cytosolic and mitochondrial calcium handling proteins
We subsequently performed Western immunoblotting to study whether the changes in cytosolic and mitochondrial calcium handling result from altered protein expression of essential proteins. SERCA2a protein content was similar between groups, but phospholamban (PLB) expression was higher and its phosphorylated form is lower in ZSF1‐obese vs ZSF1‐lean (Figure 6A‐C). The SERCA2a/PLB expression ratio was lower in ZSF1‐obese than in ZSF1‐lean (Figure 6D), suggesting that Sarcoplasmatic reticulum (SR) Ca2+‐uptake capacity is reduced in ZSF1‐obese animals. These results indicate that the higher cytosolic Ca2+ concentration during rest (Figure 5C) together with the slower Ca2+ reuptake into the SR (Figure 5D) and sarcomere re‐lengthening during the relaxation phase (Figure 4F) may be explained by reduced SR Ca2+‐uptake capacity in ZSF1‐obese animals.
Figure 6.
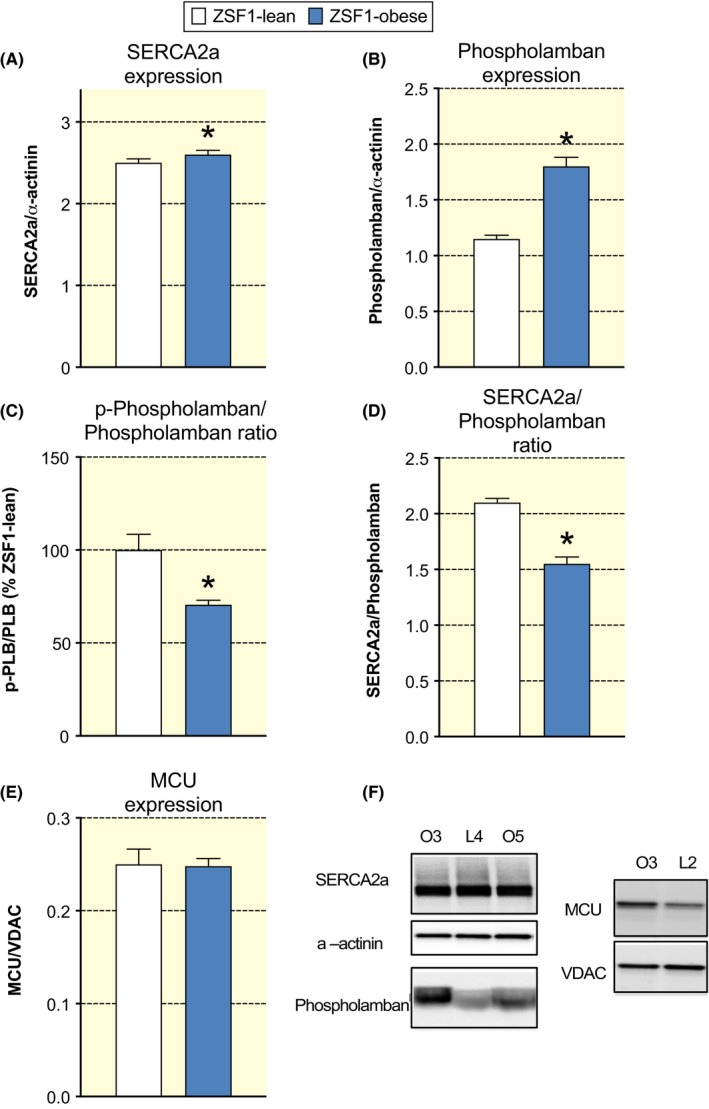
Preserved SERCA2a and MCU expression and increased phospholamban expression in ZSF1‐obese. A, Averaged SERCA2a/α‐actinin ratio in ZSF1‐lean and ZSF1‐obese did not differ significantly. B, Averaged phospholamban/α‐actinin ratio in the ZSF1‐obese group was significantly larger than in the ZSF1‐lean group. C, Averaged phosphorylated phospholamban/phospholamban ratio in the ZSF1 group was significantly increased (~36%) than in ZSF1‐lean. *P < .05, n = 6 animals in both groups. D, Averaged SERCA2a/phospholamban ratio in the ZSF1‐obese group was significantly smaller (~25%) than in the ZSF1‐lean group. *P < .05, n = 6 animals in both groups. E, Averaged MCU/VDAC ratio in ZSF1‐lean and ZSF1‐obese did not differ significantly. F, Examples of Western immunoblots of cardiac tissue using SERCA2a, phospholamban antibodies from two ZSF1‐obese animals (O3 and O5) and one ZSF1‐lean animal (L4). Examples of Western immunoblots of cardiac tissue using MCU antibody from two ZSF1‐obese animals (O3 and O5) and one ZSF1‐lean animal (L4). The α‐actinin and mitochondrial voltage‐dependent anion channel (VDAC) protein expression were used to correct for protein content
Importantly, MCU protein expression, normalized to mitochondrial voltage‐dependent anion channel (VDAC) expression, was not different between groups (Figure 6E‐F), indicative that the higher mitochondrial calcium concentrations are the result of altered cytosolic calcium handling, rather than altered MCU protein content per se.
2.6. Mitochondrial Ca2+‐induced swelling
Next, we determined whether the higher mitochondrial calcium in ZSF1‐obese hearts was as a result of cytosolic or mitochondrial changes. First, we determined the relationship between end‐diastolic cytosolic and mitochondrial [Ca2+] in the cardiomyocytes (Figure 7, using data from Figures 2, 3 and 5). We observed that at rest mitochondrial [Ca2+] was higher for a given cytosolic [Ca2+] for all stimulation frequencies. End‐diastolic mitochondrial [Ca2+] increased with increasing stimulation frequency, while cytosolic [Ca2+] decreased. The R2 of the ZSF1‐lean animals was 0.99. A highly significant rightward shift in the ZSF1‐obese line was observed (P = .002), while the slope was not different (P = .19). The fact that more calcium is taken up into the mitochondria in cardiomyocytes from ZSF1‐obese animals at a similar end‐diastolic cytosolic [Ca2+] hints towards a mitochondrial contribution to the higher observed mitochondrial [Ca2+].
Figure 7.
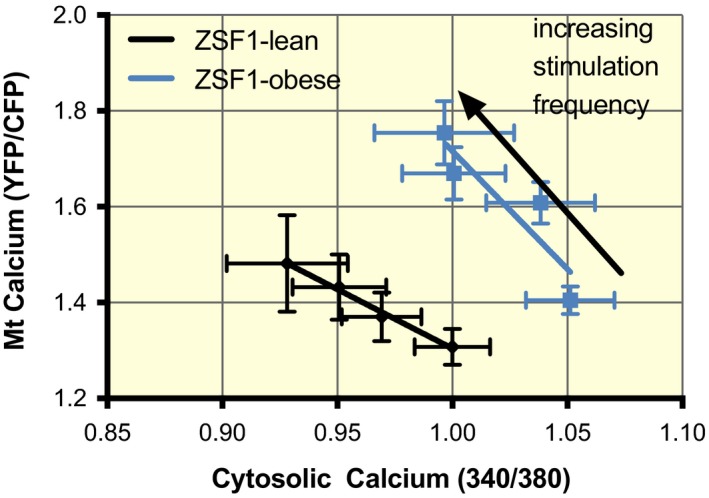
The relationship between end‐diastolic mitochondrial and cytosolic calcium. During the cellular measurement (from Figures 1, 2 and 4), end‐diastolic mitochondrial [Ca2+] was higher for a given end‐diastolic cytosolic [Ca2+] at various stimulation frequencies. End‐diastolic mitochondrial [Ca2+] increased with increasing stimulation frequency while end‐diastolic cytosolic Ca2+ concentration decreased. The R2 of the ZSF1‐lean animals was 0.99. A highly significant rightward shift in the ZSF1‐obese animals was observed (P = 0.002), but the slope was not different (P = 0.19)
Next, we used isolated mitochondria to assess osmotic volume changes upon calcium loading. Isolated mitochondria from ZSF1‐obese hearts are more prone to swelling at a similar external [Ca2+] (Figure 8), as more extracellular Ca2+ was taken up compared to mitochondria from ZSF1‐lean hearts. Upon Ruthenium‐360 addition (to block the MCU), all mitochondrial calcium accumulation was blunted and these differences were abolished (Figure 8), suggesting that swelling was induced by MCU‐mediated mitochondrial Ca2+ influx.
Figure 8.
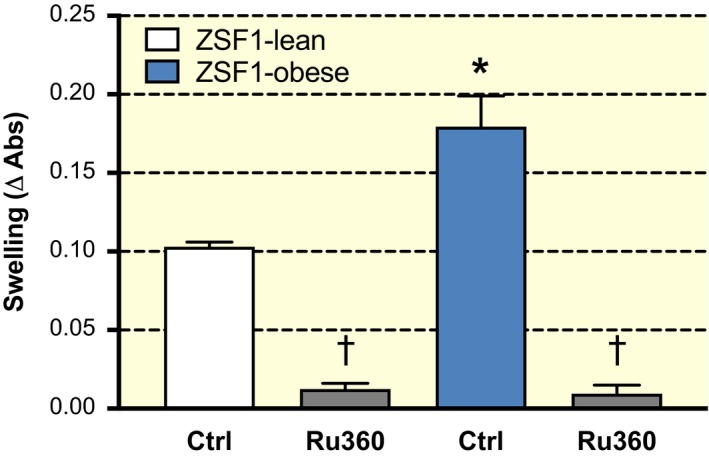
Larger mitochondrial swelling at constant calcium concentration. A similar extra‐mitochondrial calcium concentration (600 µmol/L) resulted in more swelling in isolated mitochondria from ZSF1‐obese animals compared to ZSF1‐lean animals. This effect was completely blocked by Ruthenium‐360 (Ru‐360), which blocked MCU activity. *P < 0.05 vs ZSF1‐lean, ⍺: compared to without Ru‐360
2.7. Ex vivo maximal mitochondrial respiration
To study the consequences of a higher overall mitochondrial calcium concentration in ZSF1‐obese animals, we performed ex vivo respirometry to assess maximal mitochondrial respiration. Maximal NADH‐linked (via mitochondrial complex I) respiration was reduced by 48 ± 10% in ZSF1‐obese compared to ZSF1‐lean animals (P = .03), while oxidative phosphorylation (OXPHOS) capacity (with both NADH‐ and succinate‐pathways) and uncoupled electron transport capacity were reduced by 25 ± 6% (P = .06 and 0.08, respectively, Figure 9A‐C). Mitochondrial complex I dysfunction in ZSF1‐obese animals was inferred, as succinate‐stimulated respiration (−6 ± 6%) was not significantly different between groups (Figure 9D), the normalized flux for NADH‐linked respiration tended to be lower (P = .06) and normalized succinate‐stimulated respiration was significantly higher (P = .03; Figure 9E‐F). These results indicate that the maximal mitochondrial respiration in the ZSF1‐obese myocardium was significantly lower, partly because of mitochondrial complex I dysfunction.
Figure 9.
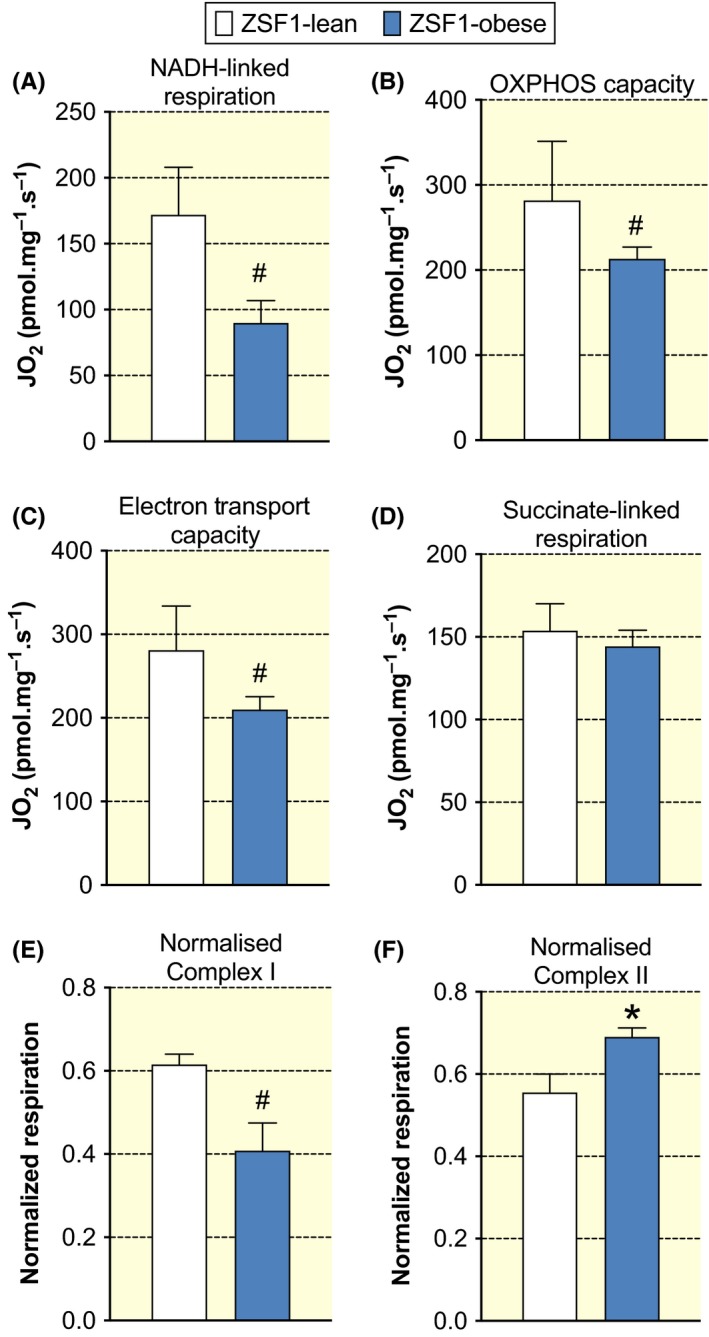
Mitochondrial respiration in ZSF1‐lean and ZSF1‐obese animals. Maximal NADH‐linked respiration with glutamate, malate and pyruvate (A), oxidative phosphorylation (OXPHOS) capacity with additional succinate‐driven respiration (B), and maximal uncoupled electron transport capacity (C) all tended to be significantly lower (0.05 < P < .10) in ZSF1‐obese compared to ZSF1‐lean animals. D, Succinate‐driven (complex II) respiration was not different between groups. E‐F, Normalized respiration by complex I substrates tended to be lower, while normalized complex II respiration was higher, suggestive of mitochondrial complex I dysfunction in ZSF1‐obese compared to ZSF1‐lean animals
3. DISCUSSION
In this study, we studied the cytosolic and mitochondrial calcium handling in a rat model of HFpEF. The alterations in the cytosolic and mitochondrial calcium transients and in the contractile function of the cardiomyocytes at a near‐physiological stimulation frequency of 4 Hz are summarized in Figure 10. We observed that the free mitochondrial calcium levels at rest and during contraction are larger in ZSF1‐obese than in ZSF1‐lean animals. Despite the unaltered MCU content, we observed more [Ca2+]m accumulation at similar cytosolic calcium concentrations from ZSF1‐obese hearts. These results suggest intrinsic alterations in mitochondrial calcium handling in ZSF1‐obese hearts. Additionally, a higher resting cytosolic calcium concentration and slower kinetics of cytosolic calcium handling (in part as a consequence of a higher PLB/SERCA2a ratio) contribute to the delayed active relaxation and higher mitochondrial calcium concentrations in our HFpEF model. We propose that higher [Ca2+]m could represent a compensatory mechanism to supply enough ATP for cardiac contractions and relaxation in vivo in the light of the observed (mild) mitochondrial complex I dysfunction. However, a sustained mitochondrial calcium accumulation could eventually become detrimental as it promotes mitochondrial permeability transition pore opening, ultimately leading to cellular apoptosis.
Figure 10.
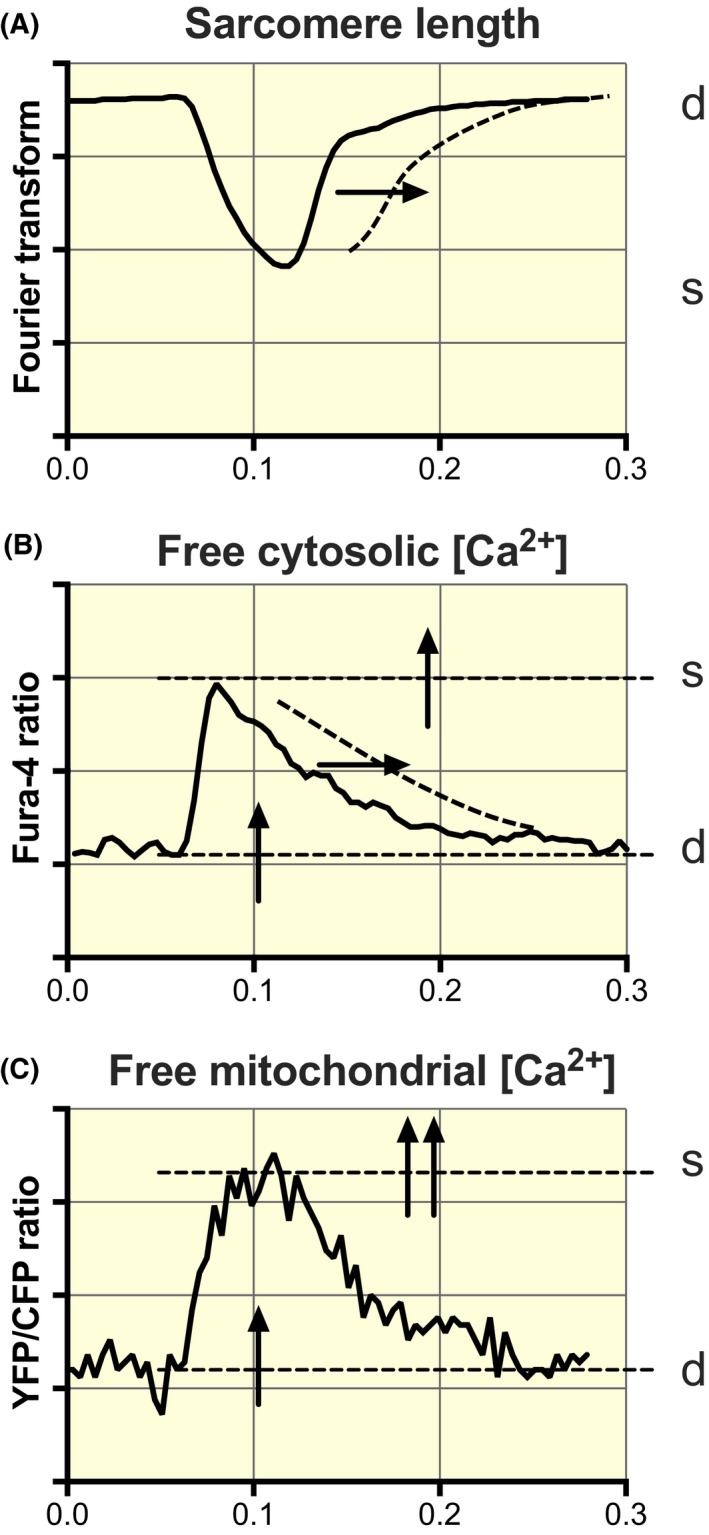
Schematic diagram of alterations in cytosolic and mitochondrial calcium handling in HFpEF at a near‐physiological stimulation frequency (4 Hz). The dotted lines and the arrows denote alterations in ZSF1‐obese relative to ZSF1‐lean. A, Slowing of the sarcomeric relaxation phase. B, Increase in cytosolic [Ca2+] during rest (d) and at peak contraction (s) and slowing of the decay in the cytosolic Ca2+ transient, while the amplitude of the Fura‐4 transient remains the same. C, Increase in mitochondrial [Ca2+] during rest and contraction, while the kinetics of mitochondrial Ca2+ uptake and extrusion are preserved. Both the baseline and the amplitude of the mitochondrial YFP/CFP ratio are increased; this results in a more significant increase in the peak systolic level than at the diastolic level
3.1. ZSF1‐obese represent a metabolic risk‐related HFpEF model
The morphometric, echocardiographic and exercise tests clearly showed that the ZSF1‐obese animals were obese, presented exercise intolerance, LV hypertrophy and diastolic dysfunction but had preserved systolic function. These results are in line with previous studies in the same animal model.15, 24 Leite et al showed preload elevation, increased end‐diastolic pressure and prolonged time to relaxation in ZSF1‐obese animals, clearly revealing effort intolerance independently of overweight‐induced mobility limitations.24 Therefore, we can conclude that the ZSF1‐obese animals represent a metabolic risk‐related model of HFpEF, which closely resembles the characteristic features of HFpEF observed in patients.
3.2. Cytosolic calcium handling
Contractile performance at the cardiomyocyte level appeared to be maintained in HFpEF animals as sarcomere length at rest, the amplitude of sarcomere shortening and the amplitude of the cytosolic calcium transients were similar between groups. In vivo, ejection fraction was comparable between groups further attesting preserved systolic function in ZSF1‐obese.
However, we did observe higher cytosolic calcium concentration in HFpEF than in control animals at rest (Figure 5) and a higher rise time to contraction and relaxation, triggering prolonged half‐width of the cytosolic calcium transient. Also, the kinetics of sarcomere shortening and re‐lengthening were slower in HFpEF, further confirming these results. Together, these data indicate that the delayed active relaxation may contribute to the diastolic dysfunction observed in these animals, which agrees with the findings from HFpEF patients cardiac strips.25, 26
Since the amplitude of the cytosolic calcium transient in both groups is the same, this could imply that both SR calcium uptake and SR calcium‐release are impaired in ZSF1‐obese animals. Indeed, we observed lower SERCA2a/PLB ratio and less activated (phosphorylated) PLB in HFpEF. Furthermore, the ZSF1‐obese rats presented lower mitochondrial respiration, which could hinder the activity of the ATP‐dependent calcium transporter, such as SERCA2a27 (Figure 6). However, we cannot exclude that other factors, such as post‐translational protein modifications and rarefraction of T‐tubules, might contribute to the observed changes.25
As a result, the prolongation of the cytosolic calcium transient and the already higher cytosolic calcium concentration during rest (end‐diastole) promote calcium uptake into the mitochondria. Indeed, several studies suggest a tight coupling between the cytosolic and mitochondrial calcium levels as demonstrated herein (Figure 7), previously by us20 and others.28
3.3. Mitochondrial calcium kinetics
The use of a genetically targeted calcium indicator allowed us to record the changes in free calcium concentration in the mitochondrial matrix in situ during electrical stimulation of the cardiomyocytes with a high time resolution. Our results indicate that the free mitochondrial calcium concentrations during rest and stimulated contractions in cardiomyocytes from ZSF1‐obese animals are larger than those of ZSF1‐lean animals.
In agreement with our previous observations in cardiomyocytes from Wistar rats,20 the free mitochondrial calcium concentration showed a very rapid rise, which took place during the cytosolic calcium transient, while the decay of the mitochondrial calcium transients was rather slow. This asymmetry results in an increase in [Ca2+]m with increasing stimulation frequency.
Using our previously published calibration curve20, we estimate our baseline free mitochondrial calcium concentration at 0.1 Hz to be 131 nmol/L in the ZSF1‐lean animals and 275 nmol/L in the ZSF1‐obese animals. The peak mitochondrial calcium concentrations at 0.1 Hz are 340 and 727 nmol/L in the ZSF1‐lean and obese animals respectively. These results are indicative of a higher mitochondrial calcium influx in the obese animals compared to the ZSF1‐lean animals. However, it should be noted that the free mitochondrial calcium concentration is partly dependent on the capacity of mitochondrial calcium buffers. The resultant changes in free mitochondrial calcium concentration when these buffers are almost saturated or changed in capacity are difficult to measure and to interpret.
The uptake of mitochondrial calcium takes place via the MCU.29, 30 The estimated calcium concentrations are much lower than the half‐maximal activation of the MCU, confirming the current view of cytosolic calcium domains near the mitochondria.4 The restitution of mitochondrial calcium is considered to take place predominantly by the mitochondrial mNCE.31 Increased free mitochondrial calcium possibly results from a decreased restitution of calcium by the mNCE and/or a larger calcium uptake via the MCU. However, the half‐time of the decay in mitochondrial calcium concentration was preserved, indicative of similar calcium restitution between groups. While we did not observe any differences in MCU expression, its blockade prevented an increased calcium uptake at a similar external calcium concentration (Figure 8). This evidence hints to an additional contribution of MCU in explaining the higher mitochondrial free calcium concentration in ZSF1‐obese hearts.
The activity of the MCU is controlled (amongst others) by its subunits, MICU1 and MICU2, and the cytosolic calcium concentration in a cooperative manner with a Hill coefficient of approximately 3.32 Our results indicate that the rise time in mitochondrial calcium concentration is higher (slower) in HFpEF animals, but this effect is opposite to what would be expected from an altered MCU activity in order to explain enhanced mitochondrial calcium uptake. Importantly, mitochondrial calcium accumulation was higher at a constant external calcium concentration in our cardiomyocytes as well as isolated mitochondria from ZSF1‐obese compared to ZSF1‐lean animals. The underlying mechanism of this mitochondrial contributor is currently unknown but is not related to MCU protein content or activity per se. We consider that alterations in the control of the mitochondrial calcium uptake (such as mitochondrial calcium buffering), post‐translational modifications in the MCU protein as well as additional, unknown, calcium‐dependent transporters may contribute to higher [Ca2+] in ZSF1‐obese animals. In any case, the high cytosolic free calcium concentration in ZSF1‐obese cardiomyocytes is an additional contributor to the greater mitochondrial free calcium concentration. This mechanism is compatible with our cytosolic calcium and contractile measurements, and the direct relation found previously between the free calcium concentration in the cytosol and the mitochondria.20, 28
3.4. Maximal mitochondrial respiration
Oxygen consumption measurements in permeabilized cardiac tissue were performed to determine maximal NADH (complex I)‐ and succinate (complex II)‐linked respiration and maximal OXPHOS capacity under steady‐state conditions. Interestingly, in line with the data obtained from a rat model of HFrEF,33 we observed that NADH (complex I)‐linked mitochondrial respiration and OXPHOS capacity were mildly reduced in HFpEF and that succinate (complex II)‐linked respiration was preserved. The cause of this mitochondrial complex I dysfunction in HF is currently unknown, but such dysfunction also has been observed in models of HFrEF such as chronic left ventricular HF34, 35 and pressure overload.33, 36 Likely, an interplay between supercomplex protein configuration (complex I deactivation37 or supercomplex stability)38, 39 could be critically involved in this finding. Recently, it has been observed that mitochondrial respiration using complex I (NADH) substrates is reduced upon mitochondrial calcium overload by leakage of matrix NADH,40 and could serve as a mechanistic link between mitochondrial calcium handling and respiration.
Impairments in the mitochondrial OXPHOS system have been extensively linked to contractile dysfunction in the heart.4, 11, 17, 33 This mild mitochondrial dysfunction in HFpEF animals can cause local, temporal accumulations of ADP and impair SERCA2a activity,41, 42 resulting in an increased cytosolic calcium concentration. These synergistic actions of ADP and calcium are known to increase cardiac stiffness and cause diastolic dysfunction.27 Although speculative, the higher cytosolic calcium (and its consequent further increase in mitochondrial calcium accumulation) might, therefore, be preceded by a subtle bio‐energetic failure in cardiac mitochondria from ZSF1‐obese animals.
In the light of this mitochondrial complex I dysfunction, the higher mitochondrial Ca2+ concentration can provide a possible mechanism to increase mitochondrial ATP supply in vivo. Oxidative phosphorylation is a calcium‐regulated process because calcium increases the activity of pyruvate dehydrogenase and several dehydrogenases in the Krebs cycle and transporters involved in producing reducing equivalents of NAD(P)H and FADH2.5, 6, 7, 43 The enhanced mitochondrial Ca2+ levels observed in this model of metabolic risk‐related HFpEF, therefore, might represent a compensatory process, aimed at maintaining adequate coupling between energy supply and demand in the myocardium. This chronic elevation of mitochondrial Ca2+ concentration, however, may have deleterious consequences.
As we observed a lower maximal capacity of the mitochondria in ZSF1‐obese compared to ZSF1‐lean, the mitochondria are operating at a concentration closer to the opening of the mitochondrial permeability transition pore. Opening of the mitochondrial permeability transition pore as a result of a mitochondrial calcium overload can induce apoptosis,44 and it is therefore of crucial importance to keep the mitochondrial calcium concentration below this maximum. Indeed, apoptosis is involved in the pathophysiology of diabetic cardiomyopathy but also increased concentrations of mitochondrial Ca2+ are a critical determinant in the development of arrhythmias.45 Whether this also underlies the higher incidence of arrhythmias in HFpEF46 is currently unknown.
In conclusion, we observed higher mitochondrial calcium levels during rest and contractions in HFpEF compared to control, as a consequence of alterations in mitochondrial and cytosolic calcium handling. In vivo, this higher mitochondrial calcium concentration can compensate for ATP production—required for optimal contractile function—under conditions of a moderately impaired mitochondrial (complex I) dysfunction in HFpEF, but may have deleterious consequences for mitochondrial calcium overload.
4. MATERIAL AND METHODS
4.1. Ethical approval
Investigations were approved by the ethics committees of the Faculty of Medicine of Porto and of the Amsterdam UMC VUmc, Amsterdam. All procedures were following institutional guidelines.
4.2. Animal model of heart failure with preserved ejection fraction
A metabolic risk‐related model of HFpEF was used.15 In short, 10‐week‐old male ZSF1‐lean and ZSF1‐obese rats were obtained from Charles River Kingston (Stone Ridge, NY, USA). ZSF1‐obese animals (n = 9) are obese, diabetic, hypertensive and develop characteristic features of clinical HFpEF, while ZSF1‐lean animals serve as controls (n = 7). Animals were kept in pairs in ventilated chambers in a controlled environment with a 12‐h light/dark cycle at room temperature (22°C) and had unlimited access to food (Purina Diet, Research Diet Inc, #5008). ZSF1‐obese animals became morbidly obese and diabetic for 28 weeks. ZSF1‐lean rats were hypertensive (Table 1) but did not develop obesity, diabetes mellitus neither HFpEF phenotype.15
At 25 weeks of age, the echocardiographic evaluation was performed under sevoflurane anaesthesia (4%) to assess diastolic function. Peak velocity of early (E) and late (A) mitral inflow signals and the ratio of E over E′ (peak velocity of early diastolic lateral mitral annular motion) were measured as an indication of LV filling pressure. Exercise tests were carried out to determine exercise tolerance and maximum aerobic capacity on a treadmill chamber coupled to a gas analyser (LE8700C and LE405, Panlab Harvard Apparatus). The treadmill was tilted to 10°. The adaptation was carried out at a speed of 15 cm/s for 3 minutes. The maximum stress test started at a speed of 30 cm/s with increments of 5 cm/s every minute until the animals reached maximal aerobic capacity (VO2max). The animals were trained to remain calm during the cuff inflation a few weeks before blood pressure measurements. Briefly, the pulse transducer distal to the cuff was positioned around the rat tail (CODA tail‐cuff, Kent scientific corporation, Torrington, CT, USA) in a warmed room to avoid vasoconstriction. Blood pressure was measured three times per animal and averaged.
At 28 weeks of age, animals were killed under sevoflurane anaesthesia by bleeding and heart weight was determined. The apex was frozen in liquid nitrogen for protein and mRNA analysis, and in some animals, a small portion of the apex was used for ex vivo mitochondrial respiration experiments. The remaining heart was used for cardiomyocyte isolation carried out by enzymatic digestion.
The lung wet‐to‐dry weight ratio was used as an estimate lung oedema. Under deep anaesthesia, the lungs were carefully excised and immediately weighted to obtain wet weight. Dry weight was assessed after the lungs were dried in an oven at 60°C for 4 days.
4.3. Real‐time quantitative Polymerase Chain Reaction (RT‐qPCR)
To determine the degree of HFpEF in these animals, we measured BNP levels, a classic marker of HF used for HFpEF diagnosis. In short, RNA was extracted from the left ventricle with TriPure (Roche). Reverse transcription polymerase chain reaction (RT‐PCR) was performed with total RNA, followed by real‐time PCR analyses using the SYBR Green method in a StepOne Plus, Applied Biosystems. Efficiency of the primers ≥95% was accepted for standard curves and was applied as a comparative method. The threshold cycles and the 2(−Delta Delta CT) methods were used to calculate the expression levels. Results are normalized for 18S and expressed as relative to the mean obtained for the ZSF1‐lean group. Specific PCR primer pairs for BNP (F: 5‐CTG TCG CCG CTG GGA GGT CAC T −3 and R: 5‐ AGC CAT TTC CTC TGA CTT TTC TC −3) and 18S (F: 5‐ CGT CTG CCC TAT CAA CTT TCG −3 and R: 5‐ CTT GGA TGT GGT AGC CGT TT −3) were used.
4.4. Cardiomyocyte isolation and viral transfection
Figure 10 provides a graphical overview of the experimental design. Ventricular cardiomyocytes were isolated by enzymatic dissociation as described previously.20, 21, 47 Freshly isolated cells were plated on laminin‐coated dishes (MatTek Corporation, Ashland, MA, USA) for 1 hour before transfection in M199 medium (PAA laboratories, Pasching, Austria) supplemented with 100 μg/mL penicillin and 100 μg/mL streptomycin (P/S), foetal bovine serum (5%) and Insulin, Transferrin, Sodium Selenite (ITS, 0.2%, Sigma Aldrich, Zwijndrecht, the Netherlands, I3146). The 4mtD3cpv Cameleon (MitoCam) plasmid targeted to the mitochondrial matrix was incorporated in adenovirus serotype 5. Infected cells were cultured in M199 medium supplemented with P/S, ITS (0.2%) and a low concentration of cytochalasin D (0.5 µmol/L, Sigma Aldrich, C8273). Measurements were performed between 40 and 50 hours after the onset of infection. Previous studies indicate that cardiac remodelling is largely prevented under these experimental conditions.48
4.5. Intramitochondrial free Ca2+ concentration measurements
Measurements of the free Ca2+ concentration inside the mitochondrial matrix ([Ca2+]m) were carried out using a fluorescence photometry setup on the stage of an inverted fluorescence microscope as described previously, using the ratiometric FRET‐based indicator (MitoCam) targeted to the mitochondrial matrix.20 The YFP/CFP ratio, calculated after subtraction of the background intensities, served as a measure of [Ca2+]m.
4.6. Cytosolic Ca2+ measurements
Untransfected cardiomyocytes kept in culture for a similar duration of those transfected were loaded with 1 µmol/L Fura‐4 acetoxymethyl ester (Life Technologies, Bleiswijk, the Netherlands) in Tyrode's solution for 15 minutes at room temperature. Cytosolic Ca2+ signals were recorded using a dual‐beam excitation fluorescence photometry setup (IonOptix Corp. Milton, MA, USA). The Fura‐4AM ratio of the fluorescence (F) emitted at 510 nm upon excitation at 340 and 380 nm (F340/F380) was used as an estimate of the cytosolic Ca2+ concentration.
4.7. Experimental protocols
Experiments were performed in a temperature‐controlled MatTek dish (MatTek Corporation, Ashland, MA, USA) at 37°C equipped with platinum stimulation electrodes and filled with 5 mL of Tyrode's solution containing (in mmol/L): NaCl (133.5), KCl (5), MgSO4 (1.2), HEPES (10), glucose (11.1) and CaCl2 (1.8) (pH 7.4). Bipolar pulses (duration: 4 or 14 ms, amplitude: 10‐40 V, frequency: 0.1‐4 Hz) were used for electrical field‐stimulation. Measurements were only performed on cardiomyocytes that were not spontaneously active or showed regular calcium waves. The measurements to determine the frequency dependence of the mitochondrial Ca2+ transients were started by measuring [Ca2+]m as well as sarcomere length at 0.1 Hz stimulation for 5 minutes (30 contractions). This relatively low stimulation frequency was chosen to record after each stimulus pulse the almost complete restitution of mitochondrial Ca2+ towards the initial baseline observed in quiescent cells. The responses of 30 contractions were averaged to improve the signal to noise ratio of the individual mitochondrial Ca2+ transients, both during the initial rapid uptake of Ca2+ into the mitochondria and the subsequent slow restitution of mitochondrial Ca2+ back into the cytosol. After that, measurements were performed at 1, 2 and 4 Hz for 60 s. In these cases, the transients were averaged after reaching the final steady state. Each stimulation period was followed by a period of rest of 2 minutes. The steady‐state responses obtained at 4 Hz can be considered to represent the physiological condition, as this stimulation frequency is close to the rat in vivo heart rate.
The measurements of the cytosolic Ca2+ transients were performed similarly, but the periods of rest in between the different stimulation frequencies were shorter because recovery was faster.
4.8. Mitochondrial respiration
In parallel, we measured ex vivo mitochondrial oxygen consumption isolated from the apex of some animals (two lean and five obese animals). The procedure was as described previously.33 Thin bundles of cardiomyocytes were permeabilized with 50 µg/mL saponin for 30 min at 4ºC in a solution consisting of (in mmol/L) CaEGTA (2.8), EGTA (7.2), ATP (5.8), MgCl2 (6.6), taurine (20), phosphocreatine (15), imidazole (20), dithiothreitol (DTT) (0.5) and MES (50) (pH 7.1). Tissue was subsequently washed in respiration solution, containing EGTA (0.5), MgCl2 (3), K‐lactobionate (60), taurine (20), KH2PO4 (10), HEPES (20), sucrose (110) and 1 g/L fatty acid free BSA (pH 7.1), quickly blotted dry, weighed and transferred to a respirometer (Oxygraph‐2k; Oroboros Instruments, Innsbruck, Austria) in respiration solution at 37°C. Oxygen concentration was maintained above 300 μmol/L throughout the experiment to avoid limitations in oxygen supply.
Leak respiration was assessed after addition of sodium glutamate (10 mmol/L), sodium malate (0.5 mmol/L) and sodium pyruvate (5 mmol/L). NADH‐linked (via complex I) respiration was measured after addition of 2.5 mmol/L ADP. Outer‐mitochondrial membrane damage was tested by the addition of 10 μmol/L cytochrome c, and any increase in respiration of > 15% was excluded from further analysis. Maximal NADH‐linked respiration was assessed after the addition of cytochrome c, that is, after alleviating possible effects of outer‐membrane damage. Maximal OXPHOS capacity was measured after addition of 10 mmol/L succinate. Maximal uncoupled respiration was measured after the stepwise addition of 0.01 μmol/L carbonylcyanide‐4‐(trifluoromethoxy)‐phenylhydrazone (FCCP). Subsequently, succinate‐driven respiration was measured after blocking complex I by addition of 0.5 μmol/L rotenone. Residual oxygen consumption was measured after addition of antimycin A (2.5 μmol/L) and was subtracted from all values. Respiration values were normalized to wet weight and expressed in pmol O2/s/mg. NADH‐linked (complex I) and succinate‐linked (complex II) respirations were both normalized to maximal respiration, to assess qualitative differences after accounting for differences in maximal OXPHOS capacity between groups.
4.9. Mitochondrial Ca2+ and swelling
To assess whether cytosolic calcium or mitochondrial abnormalities were responsible for the observed differences, we performed mitochondrial calcium accumulation experiments in isolated cardiac mitochondria as previously described.49 Mitochondrial osmotic volume was monitored by the decrease of 540 nm absorbance (V‐560 spectrophotometer, Jasco). A preliminary experiment was performed to assess the swelling amplitude at constant external calcium concentration (600 μmol/L) until absorbance decreased and mitochondrial permeability transition pore opening occurred. MCU was blocked by 10 µmol/L RU360 at 600 µmol/L Ca2+. All measurements were performed in reaction medium, containing 200 mmol/L sucrose, 10 mmol/L Tris, 10 μmol/L EGTA, 5 mmol/L KH2PO4, pH 7.4, supplemented with 1.5 μmol/L rotenone, 8 mmol/L succinate and a single pulse of 600, 800 or 1000 µmol/L of calcium with 0.5 mg/mL mitochondrial protein, continuously stirred at a temperature of 25°C. The swelling amplitude was calculated as the difference between final and initial absorbance at 540 nm.
4.10. Western immunoblotting
Cardiac muscle samples stored at − 80°C were treated using dimethyl adipimidate (DMA)/DTT clean‐up (GE Healthcare‐Fisher, Hoevelaken, the Netherlands, 10 298 894). The resulting pellet was taken up in 1D‐sample buffer (15% glycerol, 62.5 mmol/L Tris (pH 6.8), 1% w/v SDS, 2% w/v DTT) and protein concentration was determined using Pierce 660‐nm protein assay (Thermo scientific, Waltham, MA USA 02 451; 22 660) according to the manufacturer's instructions. ATP‐dependent Sarco/Endoplasmic Reticulum Ca2+‐ATPase (SERCA2a) immunoblotting was performed by application of samples (2.5 µg dry protein weight) on 4‐15% Criterion TGX gels (Biorad, Veenendaal, the Netherlands, 5 671 084) and semi‐dry blotting onto PVDF membranes (GE Healthcare‐Fisher, RPN1416F), incubated with polyclonal SERCA2a antibody (1:4000 dilution) and blocked with 5% milk in TBS‐T (137 mM NaCl, 20 mmol/L Tris pH 7.0 and 0.1% (v/v) Tween [Sigma‐Aldrich, P7949]). Phospholamban immunoblotting was performed by application of samples (5 µg dry protein weight; heat for 5 minutes at 100°C) on 18% Criterion TGX gels by incubation with PLB antibody (1:1000 dilution; Abcam, Cambridge, UK, ab86930). In both cases, blots were also incubated with α‐actinin antibody (1:5000 dilution; Sigma‐Aldrich, A7811) to allow for correction of differences in protein content. Mitochondrial calcium uniporter immunoblotting was performed by application of samples (15 µg dry protein weight; heat for 5 minutes at 100°C) on 12% Criterion TGX gels by incubation with MCU antibody (1:1000 dilution; Abcam, ab121499). After incubation for 20 minutes in Western blot stripping buffer (Thermo scientific, 21 059) at 55°C, blots were incubated with mitochondrial VDAC antibody (1:1000 dilution; Cell Signaling, Leiden, the Netherlands, 4866) to allow for correction of differences in protein content. All blots were stained using ECL‐prime (Fisher scientific, 10 308 449) and analysed on an AI‐600 imaging system (GE Healthcare, Life Sciences). Six samples from each group were applied in triplicate on three different gels. Results from different gels were normalized on the total SERCA2a/α‐actinin or PLB/α‐actinin intensity ratio of all (12) samples. Results from the three MCU blots were normalized on the MCU/VDAC ratio of a reference sample applied on each gel.
4.11. Statistical analysis
Statistical comparisons were made using Student t test and one‐ or two‐way ANOVA, with Tukey post‐hoc tests, where appropriate. The level of significance was set at P < .05. Values are presented as mean ± SEM (n = number of cells, unless noted otherwise).
CONFLICT OF INTEREST
The authors declare no conflict of interest.
ACKNOWLEDGEMENTS
We thank M. Goebel, Drs E. van Deel and M. Helmes (VUmc, Amsterdam, the Netherlands) for technical assistance and advice and Dr JL Martin (UIC, Chicago, USA) for construction of the MitoCam adenovirus. This study was supported by a Dutch Heart Foundation CVON (Cardiovasculair Onderzoek Nederland) grant (ARENA: Approaching Heart Failure By Translational Research Of RNA Mechanisms); a European Commission FP7‐Health‐2010 grant (MEDIA: MEtabolic Road to DIAstolic Heart Failure; 261409); the Portuguese Foundation for Science and Technology (grant UID/IC/00051/2013); Fundo Europeu de Desenvolvimento Regional (FEDER) through COMPETE 2020—Programa Operacional Competitividade e Internacionalização (POCI) (grant PTDC/DTP‐PIC/4104/2014) and the project DOCnet (NORTE‐01‐0145‐FEDER‐000003), supported by Norte Portugal Regional Operational Programme (NORTE 2020), under the PORTUGAL 2020 Partnership Agreement, through the European Regional Development Fund (ERDF). Daniela Miranda‐Silva was supported by Fundação para a Ciência e Tecnologia (FCT) (SFRH/BD/87556/2012). Glória Conceição was supported by Universidade do Porto/FMUP and by FSE—Fundo Social Europeu through NORTE2020—Programa Operacional Regional do Norte (NORTE‐08‐5369‐FSE‐000024—Programas Doutorais).
Miranda‐Silva D, Wüst RCI, Conceição G, et al. Disturbed cardiac mitochondrial and cytosolic calcium handling in a metabolic risk‐related rat model of heart failure with preserved ejection fraction. Acta Physiol. 2020;228:e13378 10.1111/apha.13378
See Editorial Commentary: Hohendanner, F., Bode, D. 2020. Mitochondrial Calcium in heart failure with preserved ejection fraction—friend or foe? Acta Physiol. 228, e13415.
Daniela Miranda‐Silva, Rob C. I. Wüst, Ger J. M. Stienen and Inês Falcão‐Pires equal contributions
REFERENCES
- 1. Senni M, Paulus WJ, Gavazzi A, et al. New strategies for heart failure with preserved ejection fraction: the importance of targeted therapies for heart failure phenotypes. Eur Heart J. 2014;35(40):2797‐2815. [DOI] [PMC free article] [PubMed] [Google Scholar]
- 2. Paulus WJ, Tschope C. A novel paradigm for heart failure with preserved ejection fraction: comorbidities drive myocardial dysfunction and remodeling through coronary microvascular endothelial inflammation. J Am Coll Cardiol. 2013;62(4):263‐271. [DOI] [PubMed] [Google Scholar]
- 3. Mudd JO, Kass DA. Tackling heart failure in the twenty‐first century. Nature. 2008;451(7181):919‐928. [DOI] [PubMed] [Google Scholar]
- 4. Maack C, O'Rourke B. Excitation‐contraction coupling and mitochondrial energetics. Basic Res Cardiol. 2007;102(5):369‐392. [DOI] [PMC free article] [PubMed] [Google Scholar]
- 5. Glancy B, Balaban RS. Role of mitochondrial Ca2+ in the regulation of cellular energetics. Biochemistry. 2012;51(14):2959‐2973. [DOI] [PMC free article] [PubMed] [Google Scholar]
- 6. Wüst RC, Grassi B, Hogan MC, Howlett RA, Gladden LB, Rossiter HB. Kinetic control of oxygen consumption during contractions in self‐perfused skeletal muscle. J Physiol. 2011;589(Pt 16):3995‐4009. [DOI] [PMC free article] [PubMed] [Google Scholar]
- 7. Wüst RC, Helmes M, Stienen G. Rapid changes in NADH and flavin autofluorescence in rat cardiac trabeculae reveal large mitochondrial complex II reserve capacity. J Physiol. 2015;593(8):1829‐1840. [DOI] [PMC free article] [PubMed] [Google Scholar]
- 8. Wüst RC, Stienen GJ. Successive contractile periods activate mitochondria at the onset of contractions in intact rat cardiac trabeculae. J Appl Physiol. (1985). 2018;124(4):1003‐1011. [DOI] [PubMed] [Google Scholar]
- 9. Maack C, Cortassa S, Aon MA, Ganesan AN, Liu T, O'Rourke B. Elevated cytosolic Na+ decreases mitochondrial Ca2+ uptake during excitation‐contraction coupling and impairs energetic adaptation in cardiac myocytes. Circ Res. 2006;99(2):172‐182. [DOI] [PMC free article] [PubMed] [Google Scholar]
- 10. Lin L, Sharma VK, Sheu SS. Mechanisms of reduced mitochondrial Ca2+ accumulation in failing hamster heart. Pflugers Arch. 2007;454(3):395‐402. [DOI] [PubMed] [Google Scholar]
- 11. Liu T, O'Rourke B. Enhancing mitochondrial Ca2+ uptake in myocytes from failing hearts restores energy supply and demand matching. Circ Res. 2008;103(3):279‐288. [DOI] [PMC free article] [PubMed] [Google Scholar]
- 12. Suarez J, Cividini F, Scott BT, et al. Restoring mitochondrial calcium uniporter expression in diabetic mouse heart improves mitochondrial calcium handling and cardiac function. J Biol Chem. 2018;293(21):8182‐8195. [DOI] [PMC free article] [PubMed] [Google Scholar]
- 13. Baartscheer A, Schumacher CA, Wüst RC, et al. Empagliflozin decreases myocardial cytoplasmic Na+ through inhibition of the cardiac Na+/H+ exchanger in rats and rabbits. Diabetologia. 2017;60(3):568‐573. [DOI] [PMC free article] [PubMed] [Google Scholar]
- 14. van den Brom CE, Huisman MC, Vlasblom R, et al. Altered myocardial substrate metabolism is associated with myocardial dysfunction in early diabetic cardiomyopathy in rats: studies using positron emission tomography. Cardiovasc Diabetol. 2009;8:39. [DOI] [PMC free article] [PubMed] [Google Scholar]
- 15. Hamdani N, Franssen C, Lourenço A, et al. Myocardial titin hypophosphorylation importantly contributes to heart failure with preserved ejection fraction in a rat metabolic risk model. Circ Heart Fail. 2013;6(6):1239‐1249. [DOI] [PubMed] [Google Scholar]
- 16. Conceicao G, Heinonen I, Lourenco AP, Duncker DJ, Falcao‐Pires I. Animal models of heart failure with preserved ejection fraction. Neth Heart J. 2016;24(4):275‐286. [DOI] [PMC free article] [PubMed] [Google Scholar]
- 17. Dorn GW 2nd, Maack C. SR and mitochondria: calcium cross‐talk between kissing cousins. J Mol Cell Cardiol. 2013;55:42‐49. [DOI] [PubMed] [Google Scholar]
- 18. Franzini‐Armstrong C. ER‐mitochondria communication. How privileged? Physiology (Bethesda). 2007;22:261‐268. [DOI] [PubMed] [Google Scholar]
- 19. Lu X, Ginsburg KS, Kettlewell S, Bossuyt J, Smith GL, Bers DM. Measuring local gradients of intramitochondrial [Ca(2+)] in cardiac myocytes during sarcoplasmic reticulum Ca(2+) release. Circ Res. 2013;112(3):424‐431. [DOI] [PMC free article] [PubMed] [Google Scholar]
- 20. Wüst RC, Helmes M, Martin JL, et al. Rapid frequency‐dependent changes in free mitochondrial calcium concentration in rat cardiac myocytes. J Physiol. 2017;595(6):2001‐2019. [DOI] [PMC free article] [PubMed] [Google Scholar]
- 21. Kaestner L, Scholz A, Tian Q, et al. Genetically encoded Ca2+ indicators in cardiac myocytes. Circ Res. 2014;114(10):1623‐1639. [DOI] [PubMed] [Google Scholar]
- 22. Palmer AE, Giacomello M, Kortemme T, et al. Ca2+ indicators based on computationally redesigned calmodulin‐peptide pairs. Chem Biol. 2006;13(5):521‐530. [DOI] [PubMed] [Google Scholar]
- 23. Ponikowski P, Voors AA, Anker SD, et al. 2016 ESC Guidelines for the diagnosis and treatment of acute and chronic heart failure: The Task Force for the diagnosis and treatment of acute and chronic heart failure of the European Society of Cardiology (ESC). Developed with the special contribution of the Heart Failure Association (HFA) of the ESC. Eur J Heart Fail. 2016;18(8):891‐975. [DOI] [PubMed] [Google Scholar]
- 24. Leite S, Oliveira‐Pinto J, Tavares‐Silva M, et al. Echocardiography and invasive hemodynamics during stress testing for diagnosis of heart failure with preserved ejection fraction: an experimental study. Am J Physiol Heart Circ Physiol. 2015;308(12):H1556‐1563. [DOI] [PubMed] [Google Scholar]
- 25. Runte KE, Bell SP, Selby DE, et al. Relaxation and the role of calcium in isolated contracting myocardium from patients with hypertensive heart disease and heart failure with preserved ejection fraction. Circ Heart Fail. 2017;10(8): 10.1161/CIRCHEARTFAILURE.117.004311 [DOI] [PMC free article] [PubMed] [Google Scholar]
- 26. Selby DE, Palmer BM, LeWinter MM, Meyer M. Tachycardia‐induced diastolic dysfunction and resting tone in myocardium from patients with a normal ejection fraction. J Am Coll Cardiol. 2011;58(2):147‐154. [DOI] [PMC free article] [PubMed] [Google Scholar]
- 27. Sequeira V, Najafi A, McConnell M, et al. Synergistic role of ADP and Ca(2+) in diastolic myocardial stiffness. J Physiol. 2015;593(17):3899‐3916. [DOI] [PMC free article] [PubMed] [Google Scholar]
- 28. Andrienko TN, Picht E, Bers DM. Mitochondrial free calcium regulation during sarcoplasmic reticulum calcium release in rat cardiac myocytes. J Mol Cell Cardiol. 2009;46(6):1027‐1036. [DOI] [PMC free article] [PubMed] [Google Scholar]
- 29. Baughman JM, Perocchi F, Girgis HS, et al. Integrative genomics identifies MCU as an essential component of the mitochondrial calcium uniporter. Nature. 2011;476(7360):341‐345. [DOI] [PMC free article] [PubMed] [Google Scholar]
- 30. De Stefani D, Raffaello A, Teardo E, Szabo I, Rizzuto R. A forty‐kilodalton protein of the inner membrane is the mitochondrial calcium uniporter. Nature. 2011;476(7360):336‐340. [DOI] [PMC free article] [PubMed] [Google Scholar]
- 31. Williams GS, Boyman L, Chikando AC, Khairallah RJ, Lederer WJ. Mitochondrial calcium uptake. Proc Natl Acad Sci U S A. 2013;110(26):10479‐10486. [DOI] [PMC free article] [PubMed] [Google Scholar]
- 32. Mallilankaraman K, Doonan P, Cárdenas C, et al. MICU1 is an essential gatekeeper for MCU‐mediated mitochondrial Ca(2+) uptake that regulates cell survival. Cell. 2012;151(3):630‐644. [DOI] [PMC free article] [PubMed] [Google Scholar]
- 33. Wüst RC, de Vries HJ, Wintjes LT, Rodenburg RJ, Niessen HW, Stienen GJ. Mitochondrial complex I dysfunction and altered NAD(P)H kinetics in rat myocardium in cardiac right ventricular hypertrophy and failure. Cardiovasc Res. 2016;111(4):362‐372. [DOI] [PubMed] [Google Scholar]
- 34. Ide T, Tsutsui H, Kinugawa S, et al. Mitochondrial electron transport complex I is a potential source of oxygen free radicals in the failing myocardium. Circ Res. 1999;85(4):357‐363. [DOI] [PubMed] [Google Scholar]
- 35. Lemieux H, Semsroth S, Antretter H, Hofer D, Gnaiger E. Mitochondrial respiratory control and early defects of oxidative phosphorylation in the failing human heart. Int J Biochem Cell Biol. 2011;43(12):1729‐1738. [DOI] [PubMed] [Google Scholar]
- 36. Schwarzer M, Osterholt M, Lunkenbein A, Schrepper A, Amorim P, Doenst T. Mitochondrial reactive oxygen species production and respiratory complex activity in rats with pressure overload‐induced heart failure. J Physiol. 2014;592(Pt 17):3767‐3782. [DOI] [PMC free article] [PubMed] [Google Scholar]
- 37. Galkin A, Moncada S. S‐nitrosation of mitochondrial complex I depends on its structural conformation. J Biol Chem. 2007;282(52):37448‐37453. [DOI] [PubMed] [Google Scholar]
- 38. Dai D‐F, Hsieh EJ, Chen T, et al. Global proteomics and pathway analysis of pressure‐overload‐induced heart failure and its attenuation by mitochondrial‐targeted peptides. Circ Heart Fail. 2013;6(5):1067‐1076. [DOI] [PMC free article] [PubMed] [Google Scholar]
- 39. Lenaz G, Genova ML. Supramolecular organisation of the mitochondrial respiratory chain: a new challenge for the mechanism and control of oxidative phosphorylation. Adv Exp Med Biol. 2012;748:107‐144. [DOI] [PubMed] [Google Scholar]
- 40. Briston T, Roberts M, Lewis S, et al. Mitochondrial permeability transition pore: sensitivity to opening and mechanistic dependence on substrate availability. Sci Rep. 2017;7(1):10492. [DOI] [PMC free article] [PubMed] [Google Scholar]
- 41. Inesi G, Lewis D, Ma H, Prasad A, Toyoshima C. Concerted conformational effects of Ca2+ and ATP are required for activation of sequential reactions in the Ca2+ ATPase (SERCA) catalytic cycle. Biochemistry. 2006;45(46):13769‐13778. [DOI] [PMC free article] [PubMed] [Google Scholar]
- 42. Macdonald WA, Stephenson DG. Effects of ADP on sarcoplasmic reticulum function in mechanically skinned skeletal muscle fibres of the rat. J Physiol. 2001;532(Pt 2):499‐508. [DOI] [PMC free article] [PubMed] [Google Scholar]
- 43. Lasorsa FM, Pinton P, Palmieri L, Fiermonte G, Rizzuto R, Palmieri F. Recombinant expression of the Ca(2+)‐sensitive aspartate/glutamate carrier increases mitochondrial ATP production in agonist‐stimulated Chinese hamster ovary cells. J Biol Chem. 2003;278(40):38686‐38692. [DOI] [PubMed] [Google Scholar]
- 44. Santulli G, Xie W, Reiken SR, Marks AR. Mitochondrial calcium overload is a key determinant in heart failure. Proc Natl Acad Sci U S A. 2015;112(36):11389‐11394. [DOI] [PMC free article] [PubMed] [Google Scholar]
- 45. Wiersma M, van Marion D, Wüst RC, et al. Mitochondrial Dysfunction Underlies Cardiomyocyte Remodeling in Experimental and Clinical Atrial Fibrillation. Cells 2019;8(10), 1202 10.3390/cells8101202 [DOI] [PMC free article] [PubMed] [Google Scholar]
- 46. Cho JH, Zhang R, Aynaszyan S, et al. Ventricular arrhythmias underlie sudden death in rats with heart failure and preserved ejection fraction. Circ Arrhythm Electrophysiol. 2018;11(8):e006452. [DOI] [PMC free article] [PubMed] [Google Scholar]
- 47. Fowler ED, Benoist D, Drinkhill MJ, et al. Decreased creatine kinase is linked to diastolic dysfunction in rats with right heart failure induced by pulmonary artery hypertension. J Mol Cell Cardiol. 2015;86:1‐8. [DOI] [PMC free article] [PubMed] [Google Scholar]
- 48. Tian Q, Pahlavan S, Oleinikow K, et al. Functional and morphological preservation of adult ventricular myocytes in culture by sub‐micromolar cytochalasin D supplement. J Mol Cell Cardiol. 2012;52(1):113‐124. [DOI] [PubMed] [Google Scholar]
- 49. Lumini‐Oliveira J, Magalhaes J, Pereira CV, Moreira AC, Oliveira PJ, Ascensao A. Endurance training reverts heart mitochondrial dysfunction, permeability transition and apoptotic signaling in long‐term severe hyperglycemia. Mitochondrion. 2011;11(1):54‐63. [DOI] [PubMed] [Google Scholar]


