

Abstract
The synthesis, characterization and biological activity of molybdenum(IV) complexes containing Trofimenko's scorpionato ligand, hydrotris(3‐isopropylpyrazolyl)borate (TpiPr), in addition to varying biologically active as well as other conventional ligands is described. Ligands employed include (O,O‐) (S,O‐) (N,N‐) donors that have been successfully coordinated to the molybdenum center by means of oxygen‐atom transfer (OAT) reactions from the known MoVI starting material, TpiPrMoO2Cl. The synthesized complexes were characterized by standard analytical methods and where possible by X‐ray diffraction analysis. The aqueous stability of the compounds was studied by means of UV/Vis spectroscopy and the impact of the attached ligand scaffolds on the oxidation potentials (MoIV to MoV) was studied by cyclic voltammetry. Utilizing polyvinylpyrrolidone (PVP) as a solubilizing agent, adequate aqueous solubility for biological tests was obtained. Anticancer activity tests and preliminary mode of action studies have been performed in vitro and in vivo.
Keywords: anticancer, biological tests, in vivo experiments, molybdenum, tris(pyrazolyl)borate
Giving a sting to cancer: The synthesis, characterization and biological activity of molybdenum(IV) complexes containing Trofimenko's scorpionato ligand, hydrotris(3‐isopropylpyrazolyl)borate, in addition to varying biologically active as well as other conventional ligands is described. The anticancer activity and preliminary mode of action studies have been performed in vitro and in vivo.

Introduction
Molybdenum is the only second‐row transition metal necessary for life, being an essential trace element playing an important role in over fifty enzymes (mononuclear molybdenum enzymes and nitrogenases).1, 2, 3, 4, 5 In organisms, it is transported and excreted mainly as the anion [MoO4]2−, with low toxicity,6, 7 encouraging the use of molybdenum containing complexes as potential target specific therapeutic agents. In order to overcome therapy resistance8, 9, 10, 11, 12 and to improve the specificity issues associated with platinum complexes, the search for new antitumor agents has broadened to molybdenum‐containing compounds; for example, molybdenum(II) complexes13 and polyoxomolybdates14 have shown cancerostatic activity. In addition, research has shown that the dietary supplementation of Na2MoO4 inhibits the carcinogenic effects of N‐nitrososarcosine ethyl ester (NSEE) which has been demonstrated to induce oesophageal cancer in rats.15 Interestingly, three decades ago in vivo experiments of Mo(bzac)2Cl2 (bzac=1‐phenylbutane‐1,3‐dione) against colorectal cancer in Sprague Dawley (SD) rats resulted in unexpected promotion of tumor growth.16
The major difficulties in exploring the biological activity of molybdenum complexes in intermediate oxidation states are two‐fold, aqueous solubility and stability. In order to increase the stability of reactive molybdenum complexes, hydrotris(pyrazol‐1H‐yl)borate (Tp) and derivatives thereof (Figure 1) have been employed. Discovered in 1966, these tridentate “scorpionate” ligands have been utilized extensively as chelates in coordination chemistry.17, 18 The tridentate coordination of the Tp ligand provides an effective steric shielding of the metal center, thereby reducing problematic dimerization reactions. Also, by introducing suitable substituents (e.g., Me, CF3, tBu, Ph or iPr) at the 3‐position of the pyrazole rings the protection effect can be enhanced.17, 18 The stabilization effects are even more important when dealing with molybdenum(IV) complexes, an intermediate oxidation state very prone to further oxidation reactions. While the use of tris(pyrazolyl)borate ligands in the synthesis of antitumor agents is quite rare, each study has implicated the scorpionates as a determining factor in the activity of the complexes. García‐Fernández et al. successfully synthesized bioactive hydrotris(pyrazol‐1H‐yl)borate ruthenium(II) complexes containing PTA (1,3,5‐triaza‐7‐phosphaadamantane) and 1‐CH3‐PTA (1‐methyl‐3,5‐diaza‐1‐azonia‐7‐phosphaadamantane) and postulated that the increase in size of the Tp ligand in comparison with the cyclopentadienyl (Cp) ligand might favor the cytotoxic activity.19 Gandin et al. also reported the anticancer activity of copper(I) complexes bearing unsubstituted tris(pyrazol‐1H‐yl)borates as well as four derivatives, containing electron donating and withdrawing groups, in vivo and in vitro. They affirm that the ligands are a determining factor for the cytotoxic profile of the compounds as well as the solubility and ability to cross cell membranes.20 A third example, the synthesis of vanadium(IV) complexes incorporating hydrotris(pyrazol‐1H‐yl)borate as well as the 3,5‐dimethyl Tp derivative showed that modifications to the pyrazole ring can influence the activity of the complexes.21
Figure 1.

General structure for hydrotris(pyrazol‐1H‐yl)borate ligands.
In order to increase the activity of this type of coordination compound in general, bioactive ligand scaffolds have been made use of. Maltol (3‐hydroxy‐2‐methyl‐4‐(1H)‐pyrone) is a natural product that can be found in roasted malt, larch bark and pine needles and has shown synergistic effects in metal complexes.22 Several ruthenium‐maltol complexes, such as a triruthenium carbonyl complex containing two maltolato ligands, have shown activity against several types of human cancer cell lines, as reported by Reddy and co‐workers.23 Flavonoids are also natural products that have been used for thousands of years in Eastern medicine, known for their intrinsic biological activity, possessing antioxidant or antiproliferative properties.24
In 2010 and 2012 Young and co‐workers reported the synthesis of MoIV complexes bearing the sterically bulky TpiPr ligand and a collection of phenolates acting as O,O‐donors, as well as their reactivity to a wide range of solvents/chemicals.25, 26 To increase the stability of the MoIV complexes and for a comparison of their biological activities the O,O‐bidentate binding mode of pyrones and flavonoids can be modified by thionation of the ligands, resulting in an S,O‐donor set which should have a higher affinity for softer metal centers.
Herein, we describe the synthesis, characterization and anticancer activities of molybdenum(IV) complexes containing TpiPr in addition to various bioactive chelates. The bidentate ligand scaffolds were coordinated to the molybdenum center via an oxygen‐atom transfer (OAT) reaction using triphenylphosphine as a substrate27, 28 from the known MoVI starting material, TpMoO2Cl29 (see Scheme 1 for structures and numbering scheme of the complexes).
Scheme 1.

Synthesis of complexes 1–6.
Results and Discussion
The general synthesis of compounds 1–6 was carried out through a standard complexation method. All materials and reactants were dried, and all reactions were performed under inert conditions (argon). The general synthetic procedure involved the addition of the starting material TpiPrMoO2Cl to the corresponding ligand L1–L6 in toluene. Subsequently, triethylamine was added as a base and the reaction was stirred overnight (18 h). Full conversion was monitored by TLC. Afterwards, the solvent was removed in vacuo and the complexes were purified by column chromatography using n‐hexane/ethyl acetate as eluent (5:1 to 1:1), yielding 1–6 in moderate yields: 28–42 %. The columns were run as swiftly as possible in order to minimize product degradation. All compounds are soluble in chlorinated solvents, toluene, acetone, ethyl acetate, diethyl ether and sparingly soluble in n‐hexane. The solids are moderately stable in air; however, storage for longer periods under argon is recommended. The complexes are not stable for more than 24 hours in solution when exposed to air.
The IR spectra of complexes 1–6 showed the characteristic MoIV=O stretch (ca. 940–960 cm−1)30 as well as typical TpiPr bands (ν(BH) 2490–2450 cm−1, ν(CN) 1504–1492 cm−1, ν(CN) 1290–1270 cm−1), which confirmed the presence of the scorpionate ligand.25
An advantage of the trispyrazolylborate ligands is that a clear indication of the symmetry in the studied complexes can be obtained in the NMR. Formation of the desired complexes was confirmed by NMR spectroscopy where all typical peaks of the coordinated TpiPr were observed as well as a shift of the peaks of the bidentate ligands along with the disappearance of the hydroxy protons as expected. In the free TpiPr ligand, each respective proton resonance of the three pyrazole rings are equivalent, indicating molecular C 3v symmetry. In the TpiPrMoO2Cl starting material two peaks in a 2:1 ratio for both the pyrazole protons as well as the CH protons of the iPr along with three peaks in a 1:1:1 ratio for the iPr methyl groups can be found, indicating Cs symmetry in the complex. In compounds 1–6 three non‐equivalent resonances for each of the 4‐CH, 5‐CH pyrazole‐ring protons and the iPr CH protons in a 1:1:1 ratio were observed in the 1H NMR spectra as well as six resonances due to the CH 3 groups of the iPr, indicating C1 symmetry, as described in the literature.29, 30, 31, 32 The TpiPr ligand was characterized by six methyl group resonances of the iPr at 0.65–1.51 ppm and three CH protons between 2.54–3.96 ppm. The three signals for the 4‐CH pyrazole ring protons were found between 5.70–6.55 ppm and the three signals for the 5‐CH between 7.23–8.09 ppm, respectively. Compound 6 bearing a N,N‐chelate shows a considerable upfield shift of two of the Tp‐methyl group signals, one even into negative ppm values (−0.11, 0.17 ppm), which has been reported previously for other N‐donor complexes.33 1H NMR signals for the (thio)maltolato, flavonols and pyridylbenzimidazole ligands have been found in the same regions as those reported in the literature.33, 34, 35, 36 The synthesis of thionated flavonol (L5) was confirmed by 1H and 13C NMR, which did not differ significantly from its precursor flavonol, except for the 13C thioketone‐carbon signal (see Supporting Information for synthesis and full peak assignments).
Compounds 1–6 were characterized by ESI‐MS measurements in which peaks for the [M]+ were recorded. Characteristic molybdenum isotope patterns were observed and theoretical m/z values are listed in the Supporting Information (Table S1).37
Single crystals of compounds 1, 2, 3, 5 and 6 were obtained by slow diffusion of n‐hexane in ethyl acetate or acetone solutions (Figures 2, S1, and S3). Compound 1 crystallized in the orthorhombic Pbca space group, compounds 2 and 3 in the monoclinic P21/c, compound 5 in the monoclinic P21/n space group, and compound 6 in the trigonal P32. All complexes exhibit a distorted octahedral structure defined by the facially tridentate TpiPr, an oxo ligand, and the varying bidentate ligands. The X‐ray structure of compound 3 exhibited disorder in the thioallomaltolato ligand and can be found in the Supporting Information (Table S2). The structure of complex 2 (see Figure S1) contains a disordered thiomaltolato ligand, resulting in the coordination of the oxido and sulfido atoms to the molybdenum being swapped. However, the predominant form (94 % occupancy), where the sulfur atom is opposite to N22, allows for at least the discussion of the bond lengths and angles not directly related to the thiomaltolato ligand. The asymmetric unit of the single crystals of compounds 5 and 6 contain two independent molecules, labeled A and B. The Mo−O1 bond lengths in all complexes range from 1.6580 to 1.6861 Å, being typical for oxo‐MoIV complexes30 (see Table 1 for selected bond lengths). The Mo−O1 distance is influenced by the bidentate ligand, being the longest for complex 1, containing the O,O‐chelate, and shortest for complex 6, containing the N,N‐chelate. The trans influence of the oxo ligand can be observed in the lengthening of the Mo−N12 (2.3890–2.4617 Å) distances compared with other Mo−N bonds (2.1580–2.1953 Å) bonds. There is a contraction of the O1‐Mo‐N12 angle (165.46–171.20°), partly due to steric reasons imposed by the facially coordinated TpiPr confounded by the elongated Mo−N12 bond. The variation from the ideal octahedral geometry of compounds 1, 5 and 6 can be found in Table S13 in the Supporting Information as can additional crystallographic data (Tables S3–S12, Figures S2 and S4). In the structure of 6 we were unable to sort solvent (with a rest electron density smaller than 1.3 e Å−3) and were forced to use Squeeze (Platon) to exclude 734 Å3 with a corresponding number of electrons of 238.8.
Figure 2.

Crystal structures of compounds 1 (left), 5 (center), and 6 (right), drawn with 50 % displacement ellipsoids. Hydrogen atoms are omitted for clarity.
Table 1.
Relevant bond lengths for compounds 1, 2, 5, and 6.
|
Compound |
Bond lengths [Å] |
|||
|---|---|---|---|---|
|
|
Mo−O1 |
Mo−N12 |
Mo−N22 |
Mo−N32 |
|
1 |
1.686(2) |
2.420(2) |
2.158(2) |
2.191(2) |
|
2 |
1.677(2) |
2.429(3) |
2.181(3) |
2.176(3) |
|
5A |
1.674(2) |
2.451(2) |
2.195(2) |
2.195(2) |
|
5B |
1.674(2) |
2.462(2) |
2.178(2) |
2.178(2) |
|
6A |
1.669(5) |
2.412(7) |
2.178(6) |
2.169(6) |
|
6B |
1.657(5) |
2.392(6) |
2.185(7) |
2.169(6) |
The electrochemistry of all complexes was studied by cyclic voltammetry with a scan rate of 200 mV s−1 from −0.4 V to +1.0 V, measurements were done in triplicate (Figure 3, S5, and S6), beginning at 0.1 V proceeding to more positive potentials. All complexes, except for complex 6, containing the N,N‐chelate, exhibit a reversible one‐electron process. The oxidation of MoIV to MoV for complexes 1–5 occurs in the potential range 0.033 to 0.486 V vs. NHE measured in DMF (Table 2), which is characteristic for molybdenum(IV) complexes.38 For solubility reasons we employed DMF for all our CV studies, which means that the oxidation potentials cannot be directly compared with those done in aqueous solutions.39, 40 However, our complexes show redox activity within the broad range of physiologically relevant potentials in cells (−0.4 V to +0.8 V).2 The redox potential of the complexes containing pyrones (1) and thiopyrones (2 and 3) are between 0.36–0.49 V, while the flavonol (4) and the thioflavonol (5) compounds show a reversible oxidation at a significantly lower potential, 0.033 and 0.038 V, respectively. The structure or type of the coordinating bidentate ligand has a higher influence on the redox potentials of compounds 1–5 than the coordinating atoms themselves; and therefore, the one‐electron processes can be found at similar potentials for compounds bearing maltol and its derivatives, while compounds bearing flavonol and thioflavonol exhibit lower potentials. During the cyclic voltammetry scans decomposition was observed in solutions of compounds 2, 3 and 4 and resulting secondary peaks (in Figure 3 compound 4 peaks at around 0.4 V) increased proportionally with the measuring time. Similar results have been observed for molybdenocene complexes bearing the ligand scaffolds utilized in this paper.41
Figure 3.

Cyclic voltammogram of the O,O‐chelates, compounds 1 and 4 in DMF referenced to the NHE.
Table 2.
Cyclic voltammetry data for compounds 1–5 in DMF. The redox potentials are listed vs. NHE with Fc/Fc+ as a reference.
|
Compound |
E 1/2 (V) |
|---|---|
|
1 |
0.357 |
|
2 |
0.483 |
|
3 |
0.486 |
|
4 |
0.033 |
|
5 |
0.038 |
In order to investigate the stability of the compounds in aqueous solution UV/Vis spectra were recorded every hour during a 24 hour period at 293 K. Due to solubility reasons, a mixture of solid complex 1–6: polyvinylpyrrolidone (PVP) (1:10) was dissolved in dichloromethane and the solvent was removed in vacuo. The resulting mixture was successfully dissolved in 10 % v/v phosphate‐buffered saline solution, PBS. All compounds except for 1 were stable in aqueous solution over 24 h, as no shifting of the peak maxima was observed. The complexes do, however, slowly precipitate out of solution over the 24 hours (especially complexes 1, 4 and 6) (Figures S7–S12). Compound 1 shows two inflexion points in the middle‐ultraviolet range (200–300 nm). The sample was examined in the microscope after 24 hours and small crystals were observed in the base of the cuvette. The wavelength of the peak maxima and molar extinction coefficients can be found in the Supporting Information (Table S14). In addition to its function as a solubilizer, the PVP must also play a role in stabilizing the dissolved molybdenum(IV) complexes. The PVP mixtures were, therefore, also used for the biological in vitro and in vivo tests.
Cytotoxic activity
In the search for novel anticancer metal complexes, limited solubility is a common hurdle that results in the abandonment of many research projects. In this regard, diverse tactics have been investigated to increase the aqueous solubility of metal complexes. An interesting strategy makes use of polyvinylpyrrolidone (PVP), a water‐soluble polymer, patented in 1939, originally used as a blood‐plasma substitute in World War II.42 However, it has not been used for this purpose for decades. Today, PVP is one of the most used pharmaceutical auxiliaries, also utilized in the medical and cosmetics industries42, 43 It is thought that π‐stacking interactions between PVP and the aromatic rings of the ligands in the complexes are the reason behind this increased solubility in aqueous solution.
The cytotoxic activities in vitro of complexes 1–6:PVP (1:10) mixtures as well as the uncoordinated KTpiPr ligand/PVP (1:10) mixture were determined through the colorimetric MTT assay in the human cancer cell lines A549 (non‐small cell lung carcinoma), CH1/PA‐1 (ovarian teratocarcinoma) and SW480 (colon carcinoma). The two most potent complexes were additionally tested in HCT116 (colon carcinoma) cells as well as in sublines thereof where bax or p53 had been knocked out (see Table 3; Figures S13–S15 in the Supporting Information). PVP showed no antiproliferative activity whatsoever at all tested concentrations (up to 2 mg mL−1), and also the potassium salt of the trispyrazolylborate ligand (KTpiPr) does not show pronounced cytotoxicity. Due to higher standard deviations than usual in the data for compound 1 in the CH1/PA‐1 and compound 2 in the SW480 cell line, much more than three independent experiments were carried out (for the results of all nine measurements see tables S15 and S16 in the Supporting Information). Compounds 4, 5, and 6 show typical activity profiles, being most active in CH1/PA‐1 cells, while 1 is most active in SW480 cells. All of them are least active in the cell line A549. Surprisingly and in contrast with the pyrone complexes, the flavonol complex 4, with an O,O‐leaving group, possesses greater cytotoxic activity than compound 5, containing the S,O‐flavonol derivative.
Table 3.
Cytotoxicity in human cancer cell lines; 50 % inhibitory concentrations (mean ± SD), obtained by the MTT assay (exposure time: 96 h). Values marked with (*) were poorly reproducible as indicated by the broad standard deviation. More information can be found in the Supporting Information.
|
Compound/PVP (1:10) |
IC50 values [μm] |
|||||
|---|---|---|---|---|---|---|
|
|
A549 |
SW480 |
CH1/PA‐1 |
HCT116 |
HCT116bax‐ko |
HCT116p53‐ko |
|
1 |
>50 |
7.1±1.6 |
14±8* |
n.d.[a] |
n.d. |
n.d. |
|
2 |
0.27±0.05 |
0.46±0.34* |
0.79±0.19 |
2.1±0.6 |
1.9±0.7 |
1.9±0.8 |
|
3 |
1.5±0.3 |
1.1±0.1 |
1.6±0.2 |
1.9±0.3 |
1.6±0.2 |
1.5±0.3 |
|
4 |
21±4 |
5.8±0.6 |
1.8±0.3 |
n.d. |
n.d. |
n.d. |
|
5 |
>50 |
14±2 |
6.4±1.1 |
n.d. |
n.d. |
n.d. |
|
6 |
16±1 |
15±1 |
10.5±0.2 |
n.d. |
n.d. |
n.d. |
|
KTpiPr |
>50 |
>50 |
46±3 |
n.d. |
n.d. |
n.d. |
|
L2[b] |
1.3±0.8 |
0.52±0.04 |
0.55±0.31 |
n.d. |
n.d. |
n.d. |
[a] N.d.=not determined. [b] See ref. 46.
Complexes 2 and 3 containing the S,O‐donor ligands thiomaltol and thioallomaltol, respectively, show the most promising IC50 values, in the very low micromolar and submicromolar range, with almost no differences between the cell lines in the case of 3 and an unusual activity profile in the case of 2. Especially but not exclusively in the case of platinum‐ or ruthenium‐based drugs, CH1/PA‐1 is usually the most sensitive of these cell lines and the multidrug‐resistant A549 the least sensitive.44, 45 The structural isomerism of the methyl group between L2 (thiomaltol) and L3 (thioallomaltol) is responsible for up to a five‐fold increase in the cytotoxicity of complex 2 when compared with complex 3. This result is intriguing and shows that even a small modification of the ligand can have a great effect on the cytotoxicity of the compounds.
The thiomaltol ligand (L2) is known to be highly cytotoxic by itself.46 While the activities in SW480 and CH1/PA‐1 cell lines of complex 2 are within the same range as that of the free ligand (L2), the activity of 2 in the A549 cell line is significantly greater (4 to 5 times) when compared with the free ligand L2. This greatest activity of 2 in the broadly chemoresistant A549 cell line indicates a mode of action very different to that of known cytotoxic metal complexes. Moreover, as far as we know, this compound is the first active molybdenum complex bearing a trispyrazolylborate ligand and, the most active molybdenum complex to the best of our knowledge. The only other molybdenum compounds which have shown cytotoxic activity in a similar range bear thiosemicarbazones as chelating ligands in general; however, in that case, the great antiproliferative activity is said to be equal to that of the free ligands.47 We believe that, in general, the anticancer activities of the molybdenum complexes are largely dependent on the activities of the bidendate ligands (L1–L6), however, not solely. For example, the use of completely inactive maltol (L1) as a ligand results in the partially active complex 1, which shows that other factors must also come into play.
In order to get a hint for the mode of action, variants of the HCT116 cell line where the proapoptotic factor bax (a key factor in induction of the mitochondrial pathway of apoptosis) or the tumor suppressor, regulator of the cell cycle and guardian of genomic stability p53 (a key factor in the response to DNA damage by chemotherapy) had been knocked out were employed to test the two most potent complexes 2 and 3.48, 49 However, differences between the sensitivities of these sublines and the parental cell line are negligible and within the standard deviation throughout (see Table 3; Figure S15 in the Supporting Information), implying that bax is not involved in the mode of action of these compounds and that DNA damage is most likely not the reason for cytotoxicity, thereby excluding a cisplatin‐like mode of action.
DCFH‐DA assay
To find out whether oxidative stress is involved in the biological activity of the compounds, we measured their ability to generate ROS (reactive oxygen species) by the fluorimetric DFCH‐DA assay every 10 min over 120 min. Four different concentrations (0.4, 2, 10, 50 μm) were applied, whereby the highest concentration was 25 times higher than the IC50 value after 96 h of exposure. However, neither complex 2 nor complex 3 showed a tendency to trigger ROS. On the contrary, they seem to exert a concentration‐dependent antioxidative effect, lowering ROS levels below those of untreated controls (Figure S16).
Annexin V/PI assay
The apoptosis inducing properties of compounds 2 and 3 were investigated by annexin V‐FITC/PI‐staining. Phosphatidylserine (PS) on the external membrane surface of cells indicates apoptosis, and annexin V‐mediated binding to PS allows the flow‐cytometric analysis of apoptotic cells. Necrosis can be differentiated by simultaneous staining with propidium iodide (PI).50 The dot plots (Figure 4) yielded from cells treated with complexes 2 (10 μm) and 3 (10 μm) after 24 h exposure are compared to untreated controls. Complexes 2 and 3 are able to induce apoptosis (early and late apoptosis taken together) in all three HCT116 cell lines at a concentration of 10 μm after 24 h, whereas SW480 cells required a concentration as high as 50 μm for comparable effect (Table S17 and Figure S17).
Figure 4.
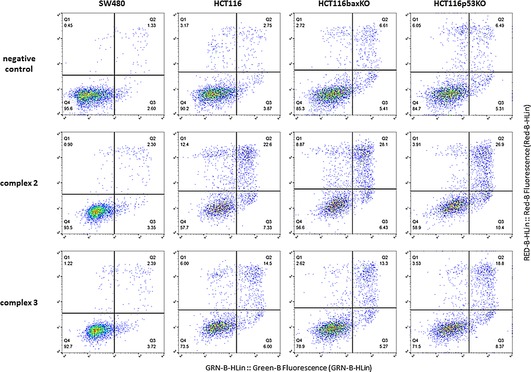
Representative scatter plots differentiating apoptotic and necrotic from viable cells based on annexin V‐FITC and PI staining after 24 h incubation with complexes 2 (10 μm) and 3 (10 μm) and flow cytometric analysis. (Q1) necrotic cells; (Q2) late apoptotic cells; (Q3) early apoptotic cells; (Q4) viable cells.
Electrophoretic dsDNA plasmid assay
The ability of molybdenum(IV) complexes to modify DNA secondary structure was investigated by performing a cell‐free, electrophoretic dsDNA plasmid assay. The pUC19 plasmid, when intact, assumes mostly a negatively supercoiled (sc) form, accompanied by a minor fraction of the open circular (oc) form. Upon interaction with a DNA‐unwinding compound, the sc form, as reflected by lowered electrophoretic mobility, gradually converges to the oc form, which may, if the compound has a bending effect on DNA, simultaneously adopt a higher electrophoretic mobility. The investigated compounds (50 μm) were incubated with pUC19 at 37 °C and allowed to interact for up to 6 h. Compound 2 exhibited negligible DNA interaction within this time (6.2 %) and compound 3 seems to induce single‐strand breaks at a low rate (18 %) (Figure 5) especially when the untreated control was calculated to have a 3.4 % baseline value (see Figure S18 for the quantification of the spots). Since complexes 2 and 3 differ only in the position of the methyl group, it seems that ligand L3 (thioallomaltol) may favor interaction with DNA more than the ligand L2 (thiomaltol) does. In comparison with platinum complexes, which show a very strong interaction with plasmid DNA,51 the very low activity of complexes 2 and 3 in this experiment is indicative of a totally different mode of action.
Figure 5.

Plasmid DNA interaction studies with molybdenum(IV) complexes (2 and 3) were performed by agarose (1 %) gel electrophoresis. The pUC19 plasmid was incubated with compounds 2 and 3 (50 μm) for 15 min, 30 min, 1 h, 2 h, 4 h and 6 h at 37 °C in TE buffer. C 6h corresponds to an untreated control incubated for 6 h, while C 0h corresponds to an untreated control at the beginning of the experiment.
In vivo experiments
In order to evaluate the anticancer potential of 2 and 3, the in vivo activity in CT‐26‐bearing Balb/c mice was evaluated. In total, two therapy settings were tested: On the one hand, six individual applications spread over 2 weeks (treatment scheme 1: day 3, 5, 7, 10, 12, and 14) and on the other hand, a dose‐dense Scheme, with applications on three consecutive days given once a week for two weeks (treatment scheme 2: day 3–5 and 10–12) was used. On each therapy day, a dose of 5 mg kg−1 (dissolved in water) was applied intraperitoneally to the animals. With both therapy settings, treatment‐associated loss in body weight was less than 5 % (data not shown). With regard to the anticancer activity, neither 2 nor 3 had a significant impact on the tumor burden or overall survival of the tumor‐bearing mice when treatment scheme 1 was used (Figure 6 A). In contrast, therapy with 3 (but not with 2) resulted in disease stabilization in the second week of the experiment when treatment scheme 2 was used (Figure 6 B). This led to significantly smaller tumors in 3‐treated animals compared to the solvent‐treated group on day 17 (p<0.01 by two‐way ANOVA and Bonferroni Posttest) and subsequently prolonged the overall survival of the animals. Here, especially one of the mice needs to be mentioned, which experienced a partial response and prolonged survival until day 40 (control mice usually have to be sacrificed on day 17). This interesting increased activity of compound 3 and non‐activity of 2 is in contrast with the IC50 values obtained in in vitro tests, where compound 2 was more active in all three cell lines. However, in this case the in vitro tests with the pUC19 plasmid, in which compound 3 was active and 2 was not was a better predictor of in vivo activity than the MTT assay.
Figure 6.

In vivo anticancer activity. CT‐26 cells were injected subcutaneously in the right flank of BALB/c mice. Mice were treated on the days indicated by ▾ intraperitoneal with 5 mg kg−1 2 or 3. Tumor volumes were calculated as described in the material and method section. Each experimental group contained four animals. Data are means ± SEM Statistical analysis was performed by two‐way ANOVA with Bonferroni post‐test (*, p<0.05; **, p<0.01; compared to control mice).
Conclusions
Six novel scorpionato molybdenum(IV) complexes containing (O,O‐) (S,O‐) (N,N‐) chelates such as pyrones, flavonoids and pyridylbenzimidazole have been successfully synthesized and characterized. Single crystals of all compounds, except for compound 4, were obtained and measured. All complexes except for 1 were found to be stable in aqueous solution (PBS), with the help of PVP, over 24 hours confirmed by UV/Vis spectroscopy. Precipitation over time was observed but no hydrolysis or decomposition compounds. The results of cyclic voltammetry studies show reversible peaks in the physiological region for most complexes, except for compound 6. This redox activity could potentially influence the cytotoxicity. Very promising antiproliferative activity was found in human cancer cell lines, especially for complexes 2 and 3, exhibiting IC50 values in the low to submicromolar range in all investigated cell lines. The structural isomerism in the thiopyrone ligand of compounds 2 and 3 has a remarkable impact on the cytotoxicity of the compounds. These are the first cancerostatic molybdenum complexes bearing a trispyrazolylborate ligand and, in general, the most cytotoxic molybdenum complexes to the best of our knowledge.
In vitro studies suggest that the anticancer activity involves neither the mitochondrial apoptosis pathway nor DNA damage, arguing against a cisplatin‐like mode of action. Surprisingly, the complexes lowered the ROS levels relative to the controls and hence act in an antioxidative manner. Nevertheless, further tests showed that both compounds 2 and 3 induce apoptosis in HCT116 cells. Studies with the pUC19 plasmid showed that compound 2 and 3 induce DNA single‐strand breaks only to a small extent, again confirming a non‐cisplatin‐like mode of action. In vivo tests showed the application schedule to be a determining factor in the success of the treatment, and with the right schedule compound 3 was effective in shrinking tumor sizes and prolonging the life of the mice. It is also interesting how the small difference in activity of compounds 2 and 3 with the pUC19 plasmid shows that even such a minor structural difference as the position of a methyl group in a ligand has an effect on the biological activity of the complexes.
Experimental Section
Materials and methods
All utilized solvents were of HPLC grade and used without any further purification, except for toluene and dichloromethane, which were dried over molecular sieves (4 Å) prior to use.52 Molybdic acid (85 %, Alfa Aesar), triphenylphosphine oxide (98 %, Sigma Aldrich), hydrochloric acid (30–33 %, Donauchem), sodium methoxide (≈95 %, Fluka), ethyl formate (97 %, Sigma Aldrich), isopropyl methyl ketone (≥98.5 %, Sigma Aldrich), hydrazine dichloride (≥98 %, Sigma Aldrich), Potassium borohydride (98 %, Sigma Aldrich), Lawesson's reagent (99 %, Acros Organics), sodium hydroxide (≥98 %, Sigma Aldrich), hydrogen peroxide (30 %, Sigma Aldrich), thionyl chloride (≥99 %, Fluka), zink powder (≥97 %, Fisher), triphenylphosphine (99 %, Alfa Aesar), triethylamine (99 %, Sigma Aldrich), PBS (sterile filtered, Sigma Life Science), maltol (L1) (99 %, Sigma–Aldrich), 2‐(2'‐pyridyl)‐1H‐benzimidazole (L6) (97 %, Sigma Aldrich) and polyvinylpyrrolidone—average mol wt 10.000 (PVP10, Sigma Aldrich) were purchased from the respective commercial source and used as obtained. Thiomaltol46, 53, 54 (L2), thioallomaltol55 (L3), 3‐hydroxy‐2‐(4′‐chlorophenyl)chromen‐4‐one56 (L4) and chlorohydrotris(3‐isopropyl‐1H‐pyrazolyl)borodioxomolybdenum(VI), TpiPrMoO2Cl,57, 58 were synthesized according to literature protocols. 3‐Hydroxy‐2‐(4′‐chlorophenyl)chromen‐4‐thione (L5) was synthesized by using the same procedure as for thiomaltol, described in the literature.48 The synthesis of potassium hydrotris[3‐isopropyl‐1H‐pyrazolyl]borate, KTpiPr, was slightly modified from the one in the literature.50, 51 NMR spectra were recorded with a Bruker FT‐NMR Avance IIITM 500 MHz spectrometer at 500.10 (1H), 125.75 (13C), and 202.53 MHz (31P), respectively. 2D‐NMR measurements were recorded using standard pulse programs at 500.32 MHz (1H) and 125.81 MHz (13C). Elemental Analysis was carried out by the Microanalytical Laboratory of the University of Vienna on a PerkinElmer 2400 CHN elemental analyzer or a FisonsEA 1108 CHNS‐O Element Analyzer. X‐ray diffraction analyses were performed on a Bruker X8 APEX II CCD diffractometer at 100 K. Electrospray ionization mass spectra were recorded on a Bruker AmaZon SL ion trap mass spectrometer (Bruker Daltonics GmbH). Data were attained and processed with Compass 1.3 and Data Analysis 4.0 (Bruker Daltonics GmbH). Infrared spectra were obtained on a Bruker Vertex 70 FT‐IR‐spectrometer with an ATR‐unit (attenuated total reflection unit) in the range of 4000‐600 cm−1. Intensities of the reported bands are described with s for strong, m for medium and w for weak, broad signals are additionally specified with the letter b in front of these abbreviations.
General procedure for chelate complexation
Chlorohydrotris(3‐isopropyl‐1H‐pyrazolyl)borodioxo‐molybdenum(VI), TpiPrMoO2Cl, (0.250 g, 0.50 mmol), the respective ligand (L1–L6) (0.55 mmol), and triphenylphosphine (0.144 g, 0.55 mmol) were dissolved in 15 mL dry deoxygenated toluene, to which was added dry deoxygenated triethylamine (100 μL, 0.72 mmol). The initially yellow/gold colored solution was stirred for 18 hours at room temperature and became a dark color. Column chromatography with hexane/ethyl acetate (1:1) for compounds 1, 2, 3, a 2:1 ratio for 6, a 3:1 ratio for 5 and a 5:1 ratio for 4 was carried out and the main colored fraction was collected. The solvent was removed in vacuo.
Hydrotris(3‐isopropyl‐1H‐pyrazolyl)boro[2‐methyl‐3‐(oxo‐κO)‐4H‐pyran‐4‐oato‐κO]oxomolybdenum(IV), 1
The complex was synthesized according to the general procedure by using TpiPrMoO2Cl (0.250 g, 0.50 mmol), 3‐hydroxy‐2‐methyl‐4H‐pyran‐4‐one (0.069 g, 0.55 mmol), triphenylphosphine (0.144 g, 0.55 mmol) and triethylamine (100 μL 0.72 mmol). Yield: 80.0 mg (28 %), purple powder. 1H NMR (Acetone‐d6) δ=0.90–0.97 (m, 6 H, 2CH3 of iPr), 1.18–1.32 (m, 12 H, 4CH3 of iPr), 2.63 (s, H, CH3 of maltol) 2.58–2.68 (m, H, CH of iPr), 3.39–3.49 (m, H, CH of iPr), 3.56–3.66 (m, H, CH of iPr), 5.81 (d, 3 J(H,H)=2.2 Hz, H, py 4‐CH), 6.27 (d, 3 J(H,H)=2.2 Hz, H, py 4‐CH), 6.29 (d, 3 J(H,H)=2.2 Hz, H, py 4‐CH), 7.11 (s, H, maltol 5‐CH), 7.33 (d, 3 J(H,H)=2.1 Hz, H, py 5‐CH), 7.83 (d, 3J(H,H)=2.2 Hz, H, py 5‐CH), 7.92 (d, 3 J(H,H)=2.2 Hz, H, py 5‐CH), 8.47 (d, 3 J(H,H)=5.0 Hz, H, maltol 6‐CH) ppm. 13C NMR (Acetone–d6) δ=14.7 (CH3 of maltol), 23.7, 23.8, 23.9, 24.0, 24.4, 24.5 (CH3 of iPr), 27.3, 28.8, 28.8 (CH of iPr), 101.2, 102.9, 103.1 (py 4‐CH), 112.1 (maltol 5‐CH), 134.9, 138.7, 139.5 (py 5‐CH), 156.9 (maltol 3‐C), 157.1 (maltol 6‐CH), 160.2 (maltol 2‐C), 164.3, 165.0, 165.2 (py 5‐C), 181.9 (maltol C=O) ppm. Anal. Calcd for C24H33BMoN6O4: C, 50.02; H, 5.77; N, 14.58 %. Found: C, 50.36; H, 5.97; N, 14.33 %. (ESI+) m/z: 578.17 [M]+. IR: ν=2493 bw (νB−H), 1272 m (νC−N), 940 m (νMo=O) cm−1.
Hydrotris(3‐isopropyl‐1H‐pyrazolyl)boro[2‐methyl‐3‐(oxo‐κO)‐4H‐pyran‐4‐thioato‐κS]oxomolybdenum(IV), 2
The complex was synthesized according to the general procedure by using TpiPrMoO2Cl (0.250 g, 0.50 mmol), 3‐hydroxy‐2‐methyl‐4H‐pyran‐4‐thione (0.078 g, 0.55 mmol), triphenylphosphine (0.144 g, 0.55 mmol) and triethylamine (100 μL, 0.72 mmol). Yield: 96.8 mg (37 %), green powder. 1H NMR (CDCl3) δ=0.77 (d, 3 J(H,H)=6.7 Hz, 3 H, CH3 of iPr), 0.92 (d, 3 J(H,H)=6.7 Hz, 3 H, CH3 of iPr), 1.21–1.41 (m, 12 H, 4CH3 of iPr), 2.49–2.59 (m, H, CH of iPr), 2.67 (s, H, CH3 of thiomaltol), 3.72–3.82 (m, H, CH of iPr), 3.89–3.99 (m, H, CH of iPr), 5.70 (bs, H, py 4‐CH), 6.20 (d, 3 J(H,H)=1.6 Hz, H, py 4‐CH), 6.22 (bs, H, py 4‐CH), 7.23 (d, 3 J(H,H)=1.2 Hz, H, py 5‐CH), 7.72–7.77 (m, 3 H, thiomaltol 5‐CH and twice py 5‐CH), 7.95 (d, 3 J(H,H)=4.4 Hz, H, thiomaltol 6‐CH) ppm. 13C NMR (CDCl3): δ=15.6 (CH3 of thiomaltol), 22.4, 23.0, 23.6, 23.8, 24.1, 24.3 (CH3 of iPr), 26.4, 27.4, 29.6 (CH of iPr), 101.0, 102.0, 102.2 (py 4‐CH), 121.1 (thiomaltol 5‐CH), 133.9, 137.2, 137.7 (py 5‐CH), 147.9 (thiomaltol 6‐CH), 157.1 (thiomaltol 3‐C), 163.4 (thiomaltol 2‐C), 164.1, 164.3, 164.3 (py 5‐C), 175.2 (thiomaltol C=S) ppm. Anal. Calcd for C24H33BMoN6O3S: C, 48.66; H, 5.61; N, 14.19; S, 5.41 %. Found: C, 48.76; H, 5.69; N, 13.90; S, 5.18 %. (ESI+) m/z: 594.15 [M]+. IR: ν=2485 bw (νB−H), 1274 m (νC−N), 941 m (νMo=O) cm−1.
Hydrotris(3‐isopropyl‐1H‐pyrazolyl)boro[6‐methyl‐3‐(oxo‐κO)‐4H‐pyran‐4‐thioato‐κS]oxomolybdenum(IV), 3
The complex was synthesized according to the general procedure by using TpiPrMoO2Cl (0.125 g, 0.25 mmol), 3‐hydroxy‐3‐methyl‐4H‐pyran‐4‐thione (0.036 g, 0.25 mmol), triphenylphosphine (0.065 g, 0.25 mmol), and triethylamine (35 μL, 0.30 mmol). Yield: 57.5 mg (39 %), green powder. 1H NMR (Acetone–d6) δ=0.83 (d, 3 J(H,H)=6.8 Hz, 3 H, CH3 of iPr), 0.92 (d, 3 J(H,H)=6.8 Hz, 3 H, CH3 of iPr), 1.16–1.36 (m, 12 H, 4CH3 of iPr), 2.65 (s, H, CH3 of thioallomaltol), 2.64–2.74 (m, H, CH of iPr), 3.83 (m, 2 H, CH of iPr), 5.78 (d, 3 J(H,H)=1.3 Hz, H, py 4‐CH), 6.28 (d, 3 J(H,H)=1.6 Hz, H, py 4‐CH), 6.33 (d, 3 J(H,H)=1.6 Hz, H, py 4‐CH), 7.33 (d, 3 J(H,H)=1.1 Hz, H, py 5‐CH), 7.76–7.91 (m, 3 H, thioallomaltol 5‐CH and twice py 5‐CH), 8.34 (s, H, thioallomaltol 2‐CH) ppm. 13C NMR (Acetone–d6) δ=19.7 (CH3 of thioallomaltol), 23.2, 23.4, 23.7, 24.0, 24.5, 24.6 (CH3 of iPr), 27.0, 28.3, 30.2 (CH of iPr), 101.4, 103.0, 103.2 (py 4‐CH), 121.2 (thioallomaltol 5‐CH), 135.0, 138.3, 138.8 (py 5‐CH), 144.0 (thioallomaltol 2‐CH), 155.5 (thioallomaltol 3‐C), 164.2 (py 5‐C), 164.3 (thioallomaltol 6‐C), 164.9, 165.1 (py 5‐C), 181.7 (thioallomaltol C=S) ppm. Anal. Calcd for C24H33BMoN6O3S: C, 48.66; H, 5.61; N, 14.19; S, 5.41 %. Found: C, 48.64; H, 5.71; N, 13.99; S, 5.22 %. (ESI+) m/z: 594.15 [M]+. IR: ν=2482 bw (νB‐H), 1711 bw (νC=N), 1289 m (νC−N), 949 m (νMo=O) cm−1.
Hydrotris(3‐isopropyl‐1H‐pyrazolyl)boro[3‐(oxo‐κO)‐2‐(4'‐chlorophenyl)chromen‐(4‐oato‐κO)]oxomolybdenum(IV), 4
The complex was synthesized according to the general procedure by using TpiPrMoO2Cl, (0.250 g, 0.50 mmol), 3‐hydroxy‐2‐(4′‐chlorophenyl)chromen‐4‐one (0.150 g, 0.55 mmol), triphenylphosphine (0.144 g, 0.55 mmol) and triethylamine (100 μL, 0.72 mmol). Yield: 68.5 mg (42 %), green powder. 1H NMR (Acetone–d6) δ=0.71 (d, 3 J(H,H)=5.4 Hz, 3 H, CH3 of iPr), 0.79 (d, 3J(H,H)=5.3 Hz, 3 H, CH3 of iPr), 1.16–1.51 (m, 12 H, 4CH3 of iPr), 2.71–2.81 (m, H, CH of iPr), 3.60–3.70 (m, H, CH of iPr), 3.87–3.97 (m, H, CH of iPr), 5.83 (d, 3 J(H,H)=2.2 Hz, H, py 4‐CH), 6.35 (d, 3 J(H,H)=2.4 Hz, H, py 4‐CH), 6.40 (d, 3 J(H,H)=2.4 Hz, H, py 4‐CH), 7.40 (d, 3 J(H,H)=2.2 Hz, H, py 5‐CH), 7.61–7.64 (m, 2 H, 2′‐CH of phenyl), 7.70–7.75 (m, H, chromone 6‐CH), 7.92 (d, 3 J(H,H)=2.4 Hz, H, py 5‐CH), 8.00 (d, 3 J(H,H)=2.4 Hz, H, py 5‐CH), 8.02–8.06 (m, H, chromone 7‐CH), 8.10–8.13 (m, H, chromone 5‐CH), 8.43–8.46 (m, H, chromone 8‐CH), 8.86–8.90 (m, 2 H, 3′‐CH of phenyl) ppm. 13C NMR (Acetone–d6) δ=23.3, 23.5, 23.6, 24.0, 24.2, 24.7 (CH3 of iPr), 27.4, 28.8, 29.1 (CH of iPr), 101.3, 103.0, 103.1 (py 4‐CH), 119.7 (chromone 5‐CH), 120.1 (chromone 9‐C), 125.4 (chromone 8‐CH), 127.0 (chromone 6‐CH), 129.7 (phenyl 2′‐CH and 6′‐CH), 130.4 (phenyl 3′‐CH and 5′‐CH), 131.5 (phenyl 1′‐C), 135.1 (py 5‐CH), 135.6 (chromone 7‐CH), 137.0 (phenyl 4′‐C), 138.9, 139.7 (py 5‐CH), 151.0 (chromone 2‐C), 155.8 (chromone 3‐C), 156.3 (chromone 10‐C), 164.0, 164.2, 165.1 (py 5‐C), 180.6 (chromone C=O) ppm. Anal. Calcd for C33H36BClMoN6O4: C, 54.83; H, 5.02; N, 11.63 %. Found: C, 54.73; H, 5.08; N, 11.31 %. (ESI+) m/z: 724.16 [M]+. IR: ν=2460 bw (νB−H), 1289 m (νC−N), 950 m (νMo=O) cm−1.
Hydrotris(3‐isopropyl‐1H‐pyrazolyl)boro[3‐(oxo‐κO)‐2‐(4'‐chlorophenyl)chromen‐(4‐thiooato‐κS)]oxomolybdenum(IV), 5
The complex was synthesized according to the general procedure by using TpiPrMoO2Cl (0.050 g, 0.10 mmol), 3‐hydroxy‐2‐(4′‐chlorophenyl)chromen‐4‐thione (0.029 g, 0.10 mmol), triphenylphosphine (0.026 g, 0.10 mmol) and triethylamine (20 μL, 0.14 mmol). Yield: 36.9 mg (37 %), brown powder. 1H NMR (Acetone–d6) δ=0.65 (d, 3 J(H,H)=6.9 Hz, 3 H, CH3 of iPr), 0.76 (d, 3 J(H,H)=6.9 Hz, 3 H, CH3 of iPr), 1.19 (d, 3 J(H,H)=6.9 Hz, 3 H, CH3 of iPr), 1.23–1.30 (m, 6 H, 2CH3 of iPr), 1.40 (d, 3 J(H,H)=6.9 Hz, 3 H, CH3 of iPr), 2.73–2.83 (m, H, CH of iPr), 3.79–3.96 (m, 2 H, CH of iPr), 5.82 (d, 3 J(H,H)=2.1 Hz, H, py 4‐CH), 6.37–6.42 (m, 2 H, py 4‐CH), 7.43 (d, 3 J(H,H)=2.0 Hz, H, py 5‐CH), 7.65 (d, 3 J(H,H)=8.8 Hz, 2 H, phenyl 2‐C′H), 7.76–7.79 (m, H, chromone 6‐CH), 7.90–7.94 (m, 2 H, py 5‐CH), 7.97–8.03 (m, H, chromone 7‐CH), 8.55 (d, 3 J(H,H)=8.6 Hz, H, chromone 5‐CH), 8.74–8.78 (m, H, chromone 8‐CH), 8.90 (d, 3 J(H,H)=8.8 Hz, 2 H, phenyl 3‐C′H) ppm. 13C NMR (Acetone–d6) δ=23.7, 23.7, 23.9, 24.1, 24.4, 24.6 (CH3 of iPr), 27.0, 28.0, 30.2 (CH of iPr), 101.5, 103.1, 103.3 (py 4‐CH), 119.6 (chromone 5‐CH), 126.4 (chromone 9‐C), 127.5 (chromone 8‐CH), 128.1 (chromone 6‐CH), 130.0 (phenyl 2′‐CH and 6′‐CH), 131.1 (phenyl 1′‐C), 131.8 (phenyl 3′‐CH and 5′‐CH), 134.5 (chromone 7‐CH), 135.3 (py 5‐CH), 138.2 (phenyl 4′‐C), 138.5, 138.8 (py 5‐CH), 151.1 (chromone 2‐C), 151.9 (chromone 10‐C), 164.0, 165.1, 165.3 (py 5‐C), 166.0 (chromone 3‐C), 176.7 (chromone C=S) ppm. Anal. Calcd for C33H36BClMoN6O3S*0.5C3H6O: C, 53.96; H, 5.12; N, 10.94; S, 4.17 %. Found: C, 54.03; H, 5.38; N, 10.93; S, 3.92 %. (ESI+) m/z: 740.14 [M]+. IR: ν=2456 bw (νB−H), 1283 m (νC−N), 957 m (νMo=O) cm−1.
Hydrotris(3‐isopropyl‐1H‐pyrazolyl)boro[2‐(2'‐pyridyl‐κN)‐benzimidazolyl‐κN]oxomolybdenum(IV), 6
The complex was synthesized according to the general procedure by using TpiPrMoO2Cl (0.250 g, 0.50 mmol), 2‐(2'‐pyridyl)‐1H‐benzimidazole (0.107 g, 0.55 mmol), triphenylphosphine (0.144 g, 0.55 mmol), and triethylamine (85 μL, 0.60 mmol). Yield: 103.6 mg (32 %), salmon colored powder. 1H NMR (Acetone–d6) δ=−0.11 (d, 3 J(H,H)=6.9 Hz, 3 H, CH3 of iPr), 0.17 (d, 3 J(H,H)=6.9 Hz, 3 H, CH3 of iPr), 0.97 (d, 3 J(H,H)=6.7 Hz, 3 H, CH3 of iPr), 1.15 (d, 3 J(H,H)=6.7 Hz, 3 H, CH3 of iPr), 1.25 (d, 3 J(H,H)=6.8 Hz, 3 H, CH3 of iPr), 1.33–1.43 (m, H, CH of iPr), 1.50 (d, 3 J(H,H)=7.0 Hz, 3 H, CH3 of iPr), 3.08–3.18 (m, H, CH of iPr), 3.69–3.79 (m, H, CH of iPr), 5.75 (d, 3J(H,H)=2.2 Hz, H, py 4‐CH), 6.55 (d, 3 J(H,H)=2.2 Hz, H, py 4‐CH), 6.88–6.91 (m, H, bzm CH), 6.98 (dd, 3 J(H,H)=7.5 Hz, 4 J(H,H)=1.5 Hz, H, bzm CH), 7.09 (dd, 3 J(H,H)=7.5 Hz, 4 J(H,H)=1.5 Hz, H, bzm CH), 7.50–7.53 (m, H, py 5‐CH), 7.69–7.75 (m, 2 H, bzm CH and pyridyl 5′‐CH), 7.96–7.99 (m, H, py 5‐CH), 8.06–8.09 (m, H, py 5‐CH), 8.45 (dd, 3 J(H,H)=7.8 Hz, 4 J(H,H)=1.6 Hz, H, pyridyl 4′‐CH), 8.63–8.71 (m, 2 H, pyridyl 3′ and 6′‐CH) ppm. 13C NMR (Acetone–d6) δ=22.3, 22.5, 22.9, 23.0, 24.8, 25.3 (CH3 of iPr), 26.1, 29.4, 29.7 (CH of iPr), 102.0, 103.7, 104.2 (py 4‐CH), 117.4, 120.4, 122.2 (bzm CH), 122.6 (pyridyl 3′‐CH), 123.1 (bzm CH), 124.2 (pyridyl 5′‐CH), 136.1, 139.0, 140.0 (py 5‐CH), 143.8 (pyridyl 4′‐CH), 154.9 (pyridyl 6′‐CH), 149.5, 150.0 (bzm C), 153.8 (pyridyl 1′C), 160.8 (bzm C), 163.5, 164.3, 165.3 (py 5‐C) ppm. Anal. Calcd for C30H37BMoN9O: C, 55.74; H, 5.77; N, 19.50 %. Found: C, 55.91; H, 5.73; N, 19.20 %. (ESI+) m/z: 648.23 [M]+. IR: ν=2485 bw (νB−H), 1272 m (νC−N), 962 m (νMo=O) cm−1.
Determination of solubility
The solubility of the compounds 1–6 was determined by dissolving a mixture of PVP10 and compound (10:1 ratio) in dichloromethane. The obtained clear solution was concentrated in vacuo and a solid was obtained. The solubility in water of the PVP mixture obtained for compounds 1–6 is sufficient (>1.00 mg mL−1) for biological experiments.
Cyclic voltammetry
Cyclic voltammograms (CVs) were measured in a three‐electrode cell by using a 2 mm diameter glassy carbon disk working electrode, a platinum auxiliary electrode and a Ag|Ag+ (0.1 m AgNO3 in ACN) reference electrode. Measurements were performed at room temperature on a Princeton applied research Potentiostat/Galvanostat Model 273A. Deoxygenation of solutions was accomplished by purging a stream of argon through the solution for 3 min and the experiment was run under an argon atmosphere. The potentials were measured at compound concentrations of 2 mm in freshly prepared solutions of (nBu4N)[BF4] (0.1 m) in DMF using ferrocene (Fe(η5‐C5H5)2) (E 1/2=+0.72 V vs. NHE)59 as an internal standard and are quoted relative to the normal hydrogen electrode (NHE). The sweep was performed between −0.4 V to +1.0 V with a scan rate of 200 mV s−1. Each compound was measured in triplicate (Figures 3, S5, and S6).
Cell lines and culture conditions
CH1/PA‐1 (provided by, L. R. Kelland, CRC Centre for Cancer Therapeutics, Institute of Cancer Research, UK Sutton, confirmed by STR profiling as PA‐1 ovarian teratocarcinoma cells at Multiplexion, Heidelberg, Germany), SW480 colon carcinoma and A549 non‐small cell lung cancer cells (both obtained from ATCC) were grown in minimal essential medium (MEM) supplemented with 1 mm sodium pyruvate, 4 mm l‐glutamine, 1 % (v/v) nonessential amino acids from 100‐fold stock (all purchased from Sigma–Aldrich) and 10 % heat‐inactivated fetal bovine serum (BioWest). HCT116 colon carcinoma cells (from ATCC) as well as the bax‐ko and p53‐ko variants thereof (both provided by, B. Vogelstein, Ludwig Center at Johns Hopkins University, Baltimore, MD, USA) were grown in RPMI 1640 medium supplemented with 4 mm l‐glutamine and 10 % heat‐inactivated fetal bovine serum. Cultures were maintained as monolayers in 75 cm2 culture flasks (Starlab) at 37 °C in a humidified atmosphere of 5 % CO2 in air.
Cytotoxicity tests
Cytotoxicity of the compounds was determined by the 3‐(4,5‐dimethylthiazol‐2‐yl)‐2,5‐diphenyl‐2H‐tetrazolium bromide (MTT) assay in at least three independent experiments. Cells were harvested from culture flasks by using trypsin‐EDTA (Sigma–Aldrich), and the following cell numbers were seeded into 96‐well microculture plates (Starlab): 1×10³ CH1/PA‐1, 2×10³ HCT116 (including sublines), 2.5×10³ SW480, 3×10³ A549 cells per well (each in 100 mL). After 24 h, dry mixtures of the test compounds with PVP (1:10) were dissolved and serially diluted in complete MEM and each dilution added to plates in triplicate (100 mL per well). After exposure for 96 h, the medium was replaced with 100 mL of drug‐free RPMI 1640 medium and 20 mL of MTT solution (5 mg mL−1) in phosphate‐buffered saline. After incubation for 4 h, these mixtures were removed, and the formazan products were dissolved in 150 mL of DMSO per well. Optical densities at 550 nm (and at 690 nm as a reference) were measured with a microplate reader (Biotek ELx808), and IC50 values were interpolated.
DCFH‐DA assay
To monitor the cellular levels of ROS, SW480 and HCT116 cells were seeded into 96‐well plates (2.5×10⁴ cells/well) in volumes of 100 μL per well. After a 24 h pre‐incubation period, the cells were washed with 200 μL Hanks’ balanced salt solution (HBSS, Sigma–Aldrich, containing 1 % FCS) and stained by adding 100 μL of 25 μm DCFH‐DA (2′,7′‐dichlorofluorescein diacetate, Sigma–Aldrich) in HBSS (containing 1 % FCS) for 45 min at 37 °C. Cells were subsequently washed with 200 μL HBSS and incubated with compounds 2 and 3 at concentrations of 0.4 μm, 2 μm, 10 μm and 50 μm in 200 μL MEM (without phenol red) or RPMI 1640 medium (1 % FCS) in triplicates. Positive controls were treated with 400 μm tert‐butylhydroperoxide. ROS production was measured at 10 min intervals with the Biotek Synergy HT reader (excitation: 485/20 nm, emission: 516/20 nm) over a 2 h period.
Annexin V/PI assay
For quantifying apoptotic, necrotic and viable cells by the flow‐cytometric annexin V/PI assay, SW480, HCT116, HCT116p53‐ko, HCT116bax‐ko cells were seeded in densities of 7×10⁴ cells/well into 24‐well plates (Starlab) and 24 h later exposed to compounds 2 and 3 at concentrations of 0.4 μm, 2 μm, 10 μm and 50 μm for 24 h. After treatment, the drug‐containing media were collected, cells were washed once with 37 °C warm PBS, and trypsinized for 5 min with TrypLETM Express (Gibco). Following trypsinisation, the cell suspensions were added to the pre‐collected media, and cells were pelleted by centrifugation (300 g, 3 min). The supernatants were discarded and cell pellets were resuspended with FITC‐conjugated annexin V (0.4 μg mL−1; BioVision, USA) in binding buffer (10 mm HEPES/NaOH pH 7.4, 140 mm NaCl, 2.5 mm CaCl2) and incubated at 37 °C for 15 min. Cells were subsequently stained with PI (propidium iodide, 1.6 μg mL−1; Fluka) and analyzed with a guava easyCyte 8 HT flow cytometer (Millipore) and InCyte software. The obtained readings were further analyzed with FlowJo software (TreeStar).
Electrophoretic dsDNA plasmid assay
To study the impact of test compounds on DNA secondary structure, 300 ng of the pUC19 plasmid (2686 bp) were incubated with the test compounds (50 μm) at 37 °C for different periods of time (15 min to 6 h) with continuous shaking. 4 μL of a 6x DNA loading dye were added to the 20 μL reaction solution, and the DNA samples were loaded on an agarose gel (1 % w/v in 1 x TBE) and subjected to electrophoresis initially at 60 V for 5 min and subsequently at 120 V for 90 min, in 1×TBE buffer. DNA visualization was achieved by ethidium bromide (EtBr) staining of the agarose gel in 1 x TBE (0.75 μg mL−1) for 20 min. Images were captured with the GelDoc‐It Imaging System Fusion Fx7 (Vilber Lourmat, Germany).
Animal studies
Eight to twelve week old female Balb/c mice were purchased from Envigo (San Pietro al Natisone, Italy). The animals were kept in a pathogen‐free environment and every procedure was done in a laminar airflow cabinet. Experiments were carried out according to the Austrian and FELASA guidelines for animal care and protection. The experimental design was reviewed and approved by local government; registration no. BMWF‐66.009/0157‐V/3b/2019.
Xenograft experiments
CT‐26 cells (5×10⁵ in serum‐free cell culture medium) were injected subcutaneously into the right flank. Therapy (5 mg kg−1 intraperitoneal, PVP mixtures dissolved in H2O was either on day 3–5 and 5–10 or on day 3,5,7, 10, 12, and 14)) started when tumors were palpable. Animals were controlled for distress development every day, and tumor size was assessed regularly by calliper measurement. Tumor volume was calculated using the formula: length × width2/ 2.
CCDC https://www.ccdc.cam.ac.uk/services/structures?id=doi:10.1002/chem.201903605 contain the supplementary crystallographic data for this paper. These data are provided free of charge by http://www.ccdc.cam.ac.uk/.
Conflict of interest
The authors declare no conflict of interest.
Supporting information
As a service to our authors and readers, this journal provides supporting information supplied by the authors. Such materials are peer reviewed and may be re‐organized for online delivery, but are not copy‐edited or typeset. Technical support issues arising from supporting information (other than missing files) should be addressed to the authors.
Supplementary
Acknowledgements
We thank the University of Vienna for financial support. Many thanks to Gerhard Zeitler for devoted animal care. The authors declare no competing financial interests.
I. Berasaluce, K. Cseh, A. Roller, M. Hejl, P. Heffeter, W. Berger, M. A. Jakupec, W. Kandioller, M. S. Malarek, B. K. Keppler, Chem. Eur. J. 2020, 26, 2211.
References
- 1. Kisker C., Schindelin H., Rees D. C., Annu. Rev. Biochem. 1997, 66, 233–267. [DOI] [PubMed] [Google Scholar]
- 2. McMaster J., Enemark J. H., Curr. Opin. Chem. Biol. 1998, 2, 201–207. [DOI] [PubMed] [Google Scholar]
- 3. Hille R., Chem. Rev. 1996, 96, 2757–2816. [DOI] [PubMed] [Google Scholar]
- 4. Collison D., Garner C. D., Joule J. A., Chem. Soc. Rev. 1996, 25, 25–32. [Google Scholar]
- 5. Hille R., Hall J., Basu P., Chem. Rev. 2014, 114, 3963–4038. [DOI] [PMC free article] [PubMed] [Google Scholar]
- 6. Grunden A. M., Shanmugam K. T., Arch. Microbiol. 1997, 168, 345–354. [DOI] [PubMed] [Google Scholar]
- 7. Wagner U. G., Stupperich E., Kratky C., Structure 2000, 8, 1127–1136. [DOI] [PubMed] [Google Scholar]
- 8. Galanski M., Jakupec M., Keppler B., Curr. Med. Chem. 2005, 12, 2075–2094. [DOI] [PubMed] [Google Scholar]
- 9. Galanski M., Recent Pat. Anti-Cancer Drug Discovery 2006, 1, 285–295. [DOI] [PubMed] [Google Scholar]
- 10. Jung Y., Lippard S. J., Chem. Rev. 2007, 107, 1387–1407. [DOI] [PubMed] [Google Scholar]
- 11. Kaluderović G. N., Paschke R., Curr. Med. Chem. 2011, 18, 4738–4752. [DOI] [PubMed] [Google Scholar]
- 12. Jakupec M. A., Galanski M., Arion V. B., Hartinger C. G., Keppler B. K., Dalton Trans. 2008, 2, 183–194. [DOI] [PubMed] [Google Scholar]
- 13. Matos M. R. P. N., Romão C. C. E. N. B. B., Pereira C. C. L., Rodrigues S. S. E. B. E., Mora M., Silva M. J. P., Alves P. M., Reis C. A., EP1737874A1, January 3, 2007.
- 14. Fujita H., Fujita T., Sakurai T., Yamase T., Seto Y., Tohoku J. Exp. Med. 1992, 168, 421–426. [DOI] [PubMed] [Google Scholar]
- 15. Luo X. M., Wei H. J., Yang S. P., J. Natl. Cancer Inst. 1983, 71, 75–80. [PubMed] [Google Scholar]
- 16. Garzon F. T., Berger M. R., Keppler B. K., Schmähl D., Cancer Lett. 1987, 34, 325–330. [DOI] [PubMed] [Google Scholar]
- 17. Trofimenko, Scorpionates S., The Coordination Chemistry of Polypyrazolylborate Ligands, Imperial College Press, London, 1999. [Google Scholar]
- 18. Pettinari C., Scorpionates II: Chelating Borate Ligands, Imperial College Press, London, 2008. [Google Scholar]
- 19. García-Fernández A., Díez J., Manteca Á., Sánchez J., García-Navas R., Sierra B. G., Mollinedo F., Gamasa M. P., Lastra E., Dalton Trans. 2010, 39, 10186–10196. [DOI] [PubMed] [Google Scholar]
- 20. Gandin V., Tisato F., Dolmella A., Pellei M., Santini C., Giorgetti M., Marzano C., Porchia M., J. Med. Chem. 2014, 57, 4745–4760. [DOI] [PubMed] [Google Scholar]
- 21. Xing Y. H., Sun Z., Zou W., Song J., Aoki K., Ge M. F., J. Struct. Chem. 2006, 47, 913–922. [Google Scholar]
- 22. Kandioller W., Kurzwernhart A., Hanif M., Meier S. M., Henke H., Keppler B. K., Hartinger C. G., J. Organomet. Chem. 2011, 696, 999–1010. [Google Scholar]
- 23. Reddy V. D., Dayal D., Szalda D. J., Cosenza S. C., Ramana Reddy M. V., J. Organomet. Chem. 2012, 700, 180–187. [Google Scholar]
- 24. Middleton E., Kandaswami C., Theoharides T. C., Pharmacol. Rev. 2000, 52, 673–751. [PubMed] [Google Scholar]
- 25. Ng V. W. L., Taylor M. K., Hill L. M. R., White J. M., Young C. G., Eur. J. Inorg. Chem. 2010, 21, 3261–3269. [Google Scholar]
- 26. Ng V. W. L., Taylor M. K., Young C. G., Inorg. Chem. 2012, 51, 3202–3211. [DOI] [PubMed] [Google Scholar]
- 27. Roberts S. A., Young C. G., Cleland W. E., Ortega R. B., Enemark J. H., Inorg. Chem. 1988, 27, 3044–3051. [Google Scholar]
- 28. Man W.-L., Lam W. W. Y., Ng S.-M., Tsang W. Y. K., Lau T.-C., Chem. Eur. J. 2012, 18, 138–144. [DOI] [PubMed] [Google Scholar]
- 29. Doonan C. J., Millar A. J., Nielsen D. J., Young C. G., Inorg. Chem. 2005, 44, 4506–4514. [DOI] [PubMed] [Google Scholar]
- 30. Comprehensive Coordination Chemistry II: From Biology to Nanotechnology, Vol. 1–10, 2nd ed. (Eds.: J. A. McCleverty, T. J. Meyer, E. Constable), Elsevier Science, Amsterdam, 2003. [Google Scholar]
- 31. Young C. G., Malarek M. S., Evans D. J., Doonan C. J., Ng V. W. L., White J. M., Inorg. Chem. 2009, 48, 1960–1966. [DOI] [PubMed] [Google Scholar]
- 32. Vitze H., Bolte M., Lerner H.-W., Wagner M., Eur. J. Inorg. Chem. 2016, 2443–2454. [Google Scholar]
- 33. White J. M., Ng V. W. L., Clarke D. C., Smith P. D., Taylor M. K., Young C. G., Inorg. Chim. Acta 2009, 362, 4570–4577. [Google Scholar]
- 34. Chaves S., Jelic R., Mendonça C., Carrasco M., Yoshikawa Y., Sakurai H., Santos M. A., Met. Integr. Biometal Sci. 2010, 2, 220–227. [DOI] [PubMed] [Google Scholar]
- 35. Kandioller W., Hartinger C. G., Nazarov A. A., Bartel C., Skocic M., Jakupec M. A., Arion V. B., Keppler B. K., In Vitro. Chem. Eur. J. 2009, 15, 12283–12291. [DOI] [PubMed] [Google Scholar]
- 36. Hasan A., Rasheed L., Malik A., Asian J. Chem. 2007, 19, 937–948. [Google Scholar]
- 37. Burgmayer S. J. N., Kim M., Petit R., Rothkopf A., Kim A., BelHamdounia S., Hou Y., Somogyi A., Habel-Rodriguez D., Williams A., Kirk M. L., J. Inorg. Biochem. 2007, 101, 1601–1616. [DOI] [PMC free article] [PubMed] [Google Scholar]
- 38. Purohit S., Koley A. P., Prasad L. S., Manoharan P. T., Ghosh S., Inorg. Chem. 1989, 28, 3735–3742. [Google Scholar]
- 39. Pavlishchuk V. V., Addison A. W., Inorg. Chim. Acta 2000, 298, 97–102. [Google Scholar]
- 40. Cleland W. E., Barnhart K. M., Yamanouchi K., Collison D., Mabbs F. E., Ortega R. B., Enemark J. H., Inorg. Chem. 1987, 26, 1017–1025. [Google Scholar]
- 41. Kandioller W., Reikersdorfer M., Theiner S., Roller A., Hejl M., Jakupec M. A., Malarek M. S., Keppler B. K., Organometallics 2018, 37, 3909–3916. [Google Scholar]
- 42. Fischer F., Bauer S., ChiuZ 2009, 43, 376–383. [Google Scholar]
- 43. Bühler V., Polyvinylpyrrolidone Excipients for Pharmaceuticals: Crospovidone and Copovidone Povidone, Springer, Heidelberg, 2005. [Google Scholar]
- 44. Varbanov H. P., Göschl S., Heffeter P., Theiner S., Roller A., Jensen F., Jakupec M. A., Berger W., Galanski M., Keppler B. K., J. Med. Chem. 2014, 57, 6751–6764. [DOI] [PMC free article] [PubMed] [Google Scholar]
- 45. Pichler V., Valiahdi S. M., Jakupec M. A., Arion V. B., Galanski M., Keppler B. K., Dalton Trans. 2011, 40, 8187. [DOI] [PubMed] [Google Scholar]
- 46. Hackl C. M., Legina M. S., Pichler V., Schmidlehner M., Roller A., Dömötör O., Enyedy E. A., Jakupec M. A., Kandioller W., Keppler B. K., Chem. Eur. J. 2016, 22, 17269–17281. [DOI] [PubMed] [Google Scholar]
- 47. Vrdoljak V., Đilović I., Rubčić M., Kraljević Pavelić S., Kralj M., Matković-Čalogović D., Piantanida I., Novak P., Rožman A., Cindrić M., Eur. J. Med. Chem. 2010, 45, 38–48. [DOI] [PubMed] [Google Scholar]
- 48. Vogelstein B., Lane D., Levine A. J., Nature 2000, 408, 307. [DOI] [PubMed] [Google Scholar]
- 49. Zhang L., Yu J., Park B. H., Kinzler K. W., Vogelstein B., Science 2000, 290, 989–992. [DOI] [PubMed] [Google Scholar]
- 50. Demchenko A. P., Cytotechnology 2013, 65, 157–172. [DOI] [PMC free article] [PubMed] [Google Scholar]
- 51. Göschl S., Schreiber-Brynzak E., Pichler V., Cseh K., Heffeter P., Jungwirth U., Jakupec M. A., Berger W., Keppler B. K., Metallomics 2017, 9, 309–322. [DOI] [PMC free article] [PubMed] [Google Scholar]
- 52. Williams D. B. G., Lawton M., J. Org. Chem. 2010, 75, 8351–8354. [DOI] [PubMed] [Google Scholar]
- 53. Lewis J. A., Puerta D. T., Cohen S. M., Inorg. Chem. 2003, 42, 7455–7459. [DOI] [PubMed] [Google Scholar]
- 54. Kandioller W., Hartinger C. G., Nazarov A. A., Kuznetsov M. L., John R. O., Bartel C., Jakupec M. A., Arion V. B., Keppler B. K., Vitro. Organometallics 2009, 28, 4249–4251. [Google Scholar]
- 55. Schmidlehner M., Pichler V., Roller A., Jakupec M. A., Kandioller W., Keppler B. K., J. Organomet. Chem. 2015, 782, 69–76. [Google Scholar]
- 56. Qin C. X., Chen X., Hughes R. A., Williams S. J., Woodman O. L., J. Med. Chem. 2008, 51, 1874–1884. [DOI] [PubMed] [Google Scholar]
- 57. Trofimenko S., Calabrese J., Domaille J. P., Thompson J., Inorg. Chem. 1989, 28, 1091–1101. [Google Scholar]
- 58. Xiao Z., Bruck M. A., Doyle C., Enemark J. H., Grittini C., Gable R. W., Wedd A. G., Young C. G., Inorg. Chem. 1995, 34, 5950–5962. [DOI] [PubMed] [Google Scholar]
- 59. Barrette W. C., Sawyer D. T., Anal. Chem. 1984, 56, 653–657. [DOI] [PubMed] [Google Scholar]
Associated Data
This section collects any data citations, data availability statements, or supplementary materials included in this article.
Supplementary Materials
As a service to our authors and readers, this journal provides supporting information supplied by the authors. Such materials are peer reviewed and may be re‐organized for online delivery, but are not copy‐edited or typeset. Technical support issues arising from supporting information (other than missing files) should be addressed to the authors.
Supplementary