Abstract
Background
Impaired intestinal barrier structure and function have been validated as an important pathogenic process in type 2 diabetes mellitus (T2DM). Gut dysbiosis is thought to be the critical factor in diabetic intestinal pathogenesis. As the most abundant commensal bacteria, Faecalibacterium prausnitzii (F. prausnitzii) play important roles in gut homeostasis. The microbial anti‐inflammatory molecule (MAM), an F. prausnitzii metabolite, has anti‐inflammatory potential in inflammatory bowel disease (IBD). Thus, we aimed to explore the function and mechanism of MAM on the diabetic intestinal epithelium.
Methods
16S high‐throughput sequencing was used to analyze the gut microbiota of db/db mice (T2DM mouse model). We transfected a FLAG‐tagged MAM plasmid into human colonic cells to explore the protein‐protein interactions and observe cell monolayer permeability. For in vivo experiments, db/db mice were supplemented with recombinant His‐tagged MAM protein from E. coli BL21 (DE3).
Results
The abundance of F. prausnitzii was downregulated in the gut microbiota of db/db mice. Immunoprecipitation (IP) and mass spectroscopy (MS) analyses revealed that MAM potentially interacts with proteins in the tight junction pathway, including zona occludens 1 (ZO‐1). FLAG‐tagged MAM plasmid transfection stabilized the cell permeability and increased ZO‐1 expression in NCM460, Caco2, and HT‐29 cells. The db/db mice supplemented with recombinant His‐tagged MAM protein showed restored intestinal barrier function and elevated ZO‐1 expression.
Conclusions
Our study shows that MAM from F. prausnitzii can restore the intestinal barrier structure and function in DM conditions via the regulation of the tight junction pathway and ZO‐1 expression.
Keywords: diabetes mellitus, diabetic pathology, Faecalibacterium prausnitzii, gut microbiota, intestinal barrier
Highlights
Diabetic conditions induce compositional dysbiosis of the gut microbiota and impair gut barrier integrity.
Diabetic conditions markedly downregulate the abundance of Faecalibacterium prausnitzii in the gut.
Under diabetic conditions, microbial anti‐inflammatory molecules from Faecalibacterium prausnitzii restore the gut barrier and ZO‐1 expression possibly through the tight junction pathway.
摘要
背景
肠道屏障结构和功能异常是 2 型糖尿病的重要病理改变之一。 而肠道菌群失调被认为是诱发糖尿病肠道病变的关键因素。 普拉梭菌作为肠道中最为常见的共生菌, 在维持肠道内环境稳态中扮演着重要的角色。前沿研究发现, 源于普拉梭菌的活性产物:微生物抗炎分子(MAM)对炎症性肠病具有炎症抑制潜能。因此, 我们在本研究中探索 MAM 在糖尿病肠道上皮中的功能及机制。
方法
我们运用 16S 高通量测序分析 db/db 小鼠(2 型糖尿病小鼠模型)的肠道菌群。其次, 通过合成 FLAG 标记的 MAM 质粒, 并进行结肠上皮细胞转染, 以探索蛋白‐蛋白互作机制并观测细胞间通透性改变情况。在体内实验中, 我们构建起 E.coli BL21(DE3)细菌蛋白表达系统用于合成 His 标签重组 MAM 蛋白。运用所合成提纯的重组 MAM 蛋白对 db/db 小鼠进行肠道干预, 观察体内干预后肠道上皮屏障结构和功能改善情况。
结果
db/db 小鼠肠道内普拉梭菌丰度显著下降。免疫沉淀联合蛋白质谱分析提示 MAM
可能与细胞紧密连接通路相关蛋白相互作用, 其中一个可能的靶点为 ZO‐1。经过 FLAG 标记的MAM 质粒转染后, NCM460、Caco2 及 HT‐29 肠道细胞的肠道屏障功能增强, 伴随着 ZO‐1表达量的上调。与之相对应的, db/db 小鼠经过 His 标签 MAM 重组蛋白肠道干预后, 显示其肠道屏障功能得到改善, 并且 ZO‐1 的表达量也有明显提升。
结论
我们的研究表明来源于普拉梭菌的 MAM 可通过调控紧密连接通路及ZO‐1表达, 修复糖尿病状态下受损的肠道屏障及功能。
Keywords: 糖尿病, 糖尿病病变, 普拉梭菌, 肠道菌群, 肠道屏障
1. BACKGROUND
In past decades, the prevalence of diabetes mellitus (DM) around the globe has continued to grow. DM and its complications have become important global health issues. Previous studies have shown that DM patients and animal models suffer impaired intestinal barrier structure and function.1, 2 Malfunction of the intestinal barrier promotes the absorption of pathogens and toxins from the lumen, which induces intestinal inflammation and hyperglycemia deterioration.3, 4 These pathological alterations worsen DM prognosis. Thus, effective strategies to repair barrier structure and function are urgently needed for DM prevention and treatment.
The gut microbiota is a complex biological ecosystem that intensively interacts with the host intestinal epithelium. Increasingly, studies have revealed that gut microbiota play important roles in host health and disease progression.5, 6, 7, 8, 9 Recent findings suggest that moderate gut dysbiosis exists in DM patients and animal models.10, 11, 12, 13 Although the characteristics of the DM gut microbiome are still mired in controversy, gut microbiome studies have hinted at the biological functions or pathogenic roles of gut microbiota in DM progression.14, 15, 16 The differential richness of specific bacteria is potentially correlated with DM development.17 Faecalibacterium prausnitzii (F. prausnitzii) are the predominant butyrate‐producing bacteria in the gastrointestinal tract. Studies have revealed that F. prausnitzii are critical in host health and in many diseases.18, 19, 20
Metabolites from F. prausnitzii culture supernatant possess beneficial effects in inflammatory bowel disease (IBD).21 Recently, a protein produced by F. prausnitzii called microbial anti‐inflammatory molecule (MAM) was identified.22 In an IBD rat model, supplementation with MAM effectively relieved gut inflammation and restored the epithelial mucosa. The discovery of MAM broadened the knowledge about the biological regulatory effects of F. prausnitzii on the host intestinal epithelium and further implies that MAM from F. prausnitzii has a beneficial effect on the intestinal epithelium of DM patients. However, the downstream targets and mechanism remain unknown. The identification of MAM functions and mechanisms will broaden the understanding of the role of gut microbiota in DM development.
Accordingly, the present study focused on the association between gut microbiota dysbiosis and intestinal epithelium barrier impairment under DM conditions. We sought to investigate the interaction between F. prausnitzii‐derived MAM protein and the intestinal epithelium in DM.
2. METHODS
2.1. Mice
The BKS.Cg‐Dock7m +/+ Leprdb/JNju (db/db) mice and littermate mice (normal control) were purchased from Nanjing Biomedical Research Institute of Nanjing University (Nanjing, China) and maintained under specific pathogen‐free conditions. db/db mice become hyperglycemic at 6‐8 weeks old.
Monitoring. Caudal vein blood was collected to monitor random blood glucose by glucometer biweekly (Johnson & Johnson, New Brunswick, NJ). At the end of the intervention, mice were euthanized and sacrificed. Colon tissues were collected. All animal experiments were carried out in strict accordance with the principles of the Affidavit of Approval of Animal Use Protocol provided by the Institutional Animal Care and Use Committee, Sun Yat‐Sen University (approval number: 2016‐0112).
2.1.1. DM mouse gut microbiota sequencing and F. prausnitzii quantification
The DM group (db/db mice, n = 6) and control group (littermate mice, n = 6) were monitored from 8 weeks old. Fresh stool samples were collected following blood glucose measurement biweekly (8, 10, and 12 weeks old). The stool genomic DNA was extracted and purified by a QIAamp Fast DNA Stool Mini Kit (QIAGEN, Germantown, MD) according to the manufacturer's instructions.
High‐throughput DNA sequencing (double‐end 2 × 100 bp, Illumina HiSeq 2500, Illumina, San Diego, CA) was performed. Quantitative Insights Into Microbial Ecology (QIIME) software was used for the raw data analysis. Uclust was used to select operational taxonomic units (OTUs), ChimeraSlayer was used to eliminate erroneous nucleic acid sequences, and the National Center for Biotechnology Information (NCBI) nucleic acid database was used to identify gut bacteria. Finally, the gut microbiota was analyzed for biodiversity and composition.
The abundance of F. prausnitzii in the gut microbiota was quantified by qRT‐PCR. The specific F. prausnitzii 16S primers were synthesized as previously described (see Table 1).23 The bacterial 16S rDNA conserved region was used as the internal reference. The relative abundance of F. prausnitzii was calculated by the △△CT (cycle threshold) method.
Table 1.
The primer sequences used in qRT‐PCR
| Gene | 5′‐3′ |
|---|---|
| Homo‐ZO‐1 Forward | GCA TGA TGA TCG TCT GTC CTA CCT |
| Homo‐ZO‐1 Reverse | CCG CCT TCT GTG TCT GTG TCT T |
| Homo‐B‐Actin Forward | CAT GTA CGT TGC TAT CCA GGC |
| Homo‐B‐Actin Reverse | CTC CTT AAT GTC ACG CAC GAT |
| Mus‐ZO‐1 Forward | GAC TTG TCA GCT CAG CCA GT |
| Mus‐ZO‐1 Reverse | GGC TCC TCT CTT GCC AAC TT |
| Mus‐B‐Actin Forward | GTC ATC ACT ATT GGC AAC GAG C |
| Mus‐B‐Actin Reverse | TAC GGA TGT CAA CGT CAC ACT T |
| F. prausnitzii 16S‐2 Forward | GGA GGA AGA AGG TCT TCG G |
| F. prausnitzii 16S‐645 Reverse | AAT TCC GCC TAC CTC TGC ACT |
| Universal 16S‐926 Forward | AAA CTC AAA KGA ATT GAC GG |
| Universal 16S‐1062 Reverse | CTC ACR RCA CGA GCT GAC |
| MAM Forward | TCG CCG AAG TTG TTC TTC TCA |
| MAM Reverse | GAC AGC CCC AAT CTG GAC ACT |
2.2. Cell culture
The human colon epithelium NCM460 cell was purchased from INCELL Corporation (San Antonio, TX). Human embryonic kidney 293 T cells, human colon cancer epithelium Caco2, and HT‐29 cells were obtained from ATCC (Manasses, VA). Cells were grown in Dulbecco's modified Eagle medium (DMEM) in the presence of 10% fetal bovine serum (FBS) and cultured in 5% CO2 at 37°C in a humidified environment.
2.3. FLAG‐tagged MAM plasmid construction and cell transfection
We improved Quévrain's method22 to construct a plasmid encoding a full‐length MAM sequence. The optimized full‐length MAM sequence (synthesized by Geneary, Shanghai, China) was inserted into the p3 × flag‐cmv‐7.1/Empty (empty) vector and subsequently named p3 × flag‐cmv‐7.1/MAM (or FLAG‐tagged MAM).
Cells were seeded in 6‐well plates overnight to adhere. The empty or FLAG‐MAM plasmids were transfected into cells by mixing with Lipofectamine 3000 at an appropriate ratio (Invitrogen, Carlsbad, CA).
2.4. Immunoprecipitation (IP) and mass spectrometry (MS)24
Briefly, protein A/G plus agarose (Millipore, Burlington, MA) was precleared by modified IP buffer (Thermo Fisher, Waltham, MA). Cells were collected and lysed in modified IP buffer. After centrifugation, samples were collected and separated into two equal volumes for the specific IPs and control IPs (IgG). The supernatant was incubated with rabbit anti‐FLAG antibody (14 793, 1:100, Cell Signaling Technology [CST], Danvers, MA) or rabbit IgG (3900, 1:100, CST) overnight at 4°C with gentle rotation. The protein A/G plus agarose was then added and incubated for 2 hours at 4°C with gentle agitation to precipitate the FLAG antibody and interacting proteins. After centrifugation, the pellet was discarded, and the IP complex was washed three times with modified IP buffer and once with ice‐cold PBS.
Subsequently, samples were resolved by 10% SDS‐PAGE. Following in‐gel staining with Coomassie blue, the gel lane of interest was extracted and subjected to MS analysis. MS was performed in profile mode with a range of m/z 380‐1600 at a resolution of 60 000 (FMHW, m/z 400). The raw peptide data were queried in the UniProt protein database to verify the bait candidates.
2.5. Gene ontology analysis
The MS results or the microarray data were subjected to gene ontology analysis using the Database for Annotation, Visualization and Integrated Discovery (DAVID) (https://david.ncifcrf.gov/) and Kyoto Encyclopedia of Genes and Genomes (KEGG) (http://www.genome.jp/kegg/) with default parameters to search for biological process and signaling pathways, respectively. Differentially immunoprecipitated proteins (or genes) were analyzed. Only the top 10 enriched gene ontology terms of the biological process category and signaling pathways are shown.
2.6. Measurement of cell permeability
To establish an impaired cell permeability model, cells were treated with 1 g/mL lipopolysaccharide (LPS) for 48 hours.25 Then, they were digested and seeded in the upper chamber of a 0.22 μm transwell overnight. Each upper chamber was added with 200 μL of FITC‐dextran (Sigma‐Aldrich, Natick, MA). After a 1 hour incubation, the FITC‐dextran concentration in the lower chamber was detected by a SpectraMax M5 fluorescence spectrophotometer (Molecular Devices Corporation, San Jose, CA; excitation wavelength: 485 nm; emission wavelength: 535 nm).
2.7. Recombinant MAM protein
The pET‐6xHis/TEV/MAM plasmid (or His‐tagged MAM) was constructed and transformed into E. coli BL21 (DE3). BL21 (DE3) cultures were shaken at 300 rpm and 37°C overnight in LB medium and then induced with 1 mM isopropyl β‐D‐thiogalactoside (IPTG) at 37°C for another 4 hours. After centrifugation, the pellet was collected, and recombinant protein was extracted using Bugbuster Master Mix (Millipore). Protein purification was performed using the Amicon Pro Purification System (Millipore).
2.8. In vivo MAM intervention
Previously, 5 × 10⁹ CFU/200 μL of F. prausnitzii or engineering bacteria were used for in vivo interventions.22 As an equivalent to the bacterial protein yield, we selected the appropriate concentration and dose (1 μg/μL, 200 μL) of MAM for intervention. Typically, mice were randomly divided into four groups (n = 6): (a) control+PBS: littermate mice treated with 200 μL of PBS; (b) control+MAM: littermate mice treated with 200 μL of His‐tagged MAM; (c) DM + PBS: db/db mice treated with 200 μL of PBS; and (d) DM + MAM: db/db mice treated with 200 μL of His‐tagged MAM. Mice were treated once per day. The intervention lasted for 4 weeks.
2.9. Immunohistochemistry
Colon tissue slides were acquired by fixation and hydration. After antigen retrieval, the slides were blocked with goat serum (Maxim, Fujian, China) and incubated overnight at 4°C with an anti‐zona occludens 1 (ZO‐1) rabbit mAb (13663S, 1:100, CST). Then, the samples were incubated with a goat anti‐rabbit secondary antibody (8114, CST) for 30 minutes at room temperature. After incubation in 3,3′‐diaminobenzidine tetrahydrochloride (DAB, Maxim) with 0.05% H2O2 for 5 minutes, the nucleus was counterstained with hematoxylin. Stained samples were photographed with a Nikon TE2000‐U camera (Nikon, Tokyo, Japan).
2.10. In vivo measurement of intestinal permeability
LPS could enter the bloodstream via the leaky gut, causing host inflammation. Thus, the serum LPS concentration could indirectly reflect the intestinal permeability in mice. The serum LPS concentration was determined by a Chromogenic End‐point TAL kit (Chinese Horseshoe Crab Reagent Manufactory, Fujian, China).
2.11. Transmission electron microscopy
Transmission electron microscopy (TEM) was used to observe intestinal epithelial tight junctions and evaluate the intestinal integrity, as described previously.26 Observations were made on a JEM‐100CX II (JEOL, Tokyo, Japan). The TEM parameters were as follows: acceleration voltage 100 kV, magnification 40 000 ×. A total of three images per mouse were analyzed.
2.12. RNA isolation and qRT‐PCR
Total RNA was extracted by TRIzol reagent (Takara, Shiga, Japan) and reverse‐transcribed to cDNA by a PrimeScript RT Reagent kit (Takara). cDNA was amplified and quantified by specific primers (Table 1) and SYBR Premix Ex Taq (Takara) in a CFX‐96 system (Bio‐Rad, Hercules, CA). β‐actin was used as an internal reference, and the △△CT was used for the expression analysis.
2.13. Western blotting
Samples were lysed in RIPA lysis buffer (Thermo Fisher). The protein concentration was quantified by the BCA assay kit (Thermo Fisher). The expression of proteins of interest was investigated using Western blotting. The dilutions of antibodies were applied as follows: ZO‐1 rabbit mAb (13663S, CST) 1:2000; FLAG‐tag rabbit mAb (CST) 1:1000; His‐tag rabbit mAb (12 698, CST) 1:2000; β‐actin rabbit mAb (4970, CST) 1:2000; HRP‐conjugated anti‐rabbit IgG (7074, CST) 1:2000. Protein bands were visualized by chemiluminescence (ECL) reagent (Millipore). The integrated intensity of the protein was determined by ImageJ (National Institutes of Health, Bethesda, MD), normalized to β‐Actin.
2.14. Statistical analysis
All measurement data in this study were presented as the mean ± SE (SE). Samples in each experiment were tested at least three times. Data analysis was performed in GraphPad Prism 6 (GraphPad Software, http://www.graphpad.com). Statistical significance was set at P < 0.05.
3. RESULTS
3.1. Impaired intestinal barrier structure and function in DM mice
Our results showed that db/db mice had fivefold higher blood LPS levels than littermate mice (DM: 1.84 ± 0.52 EU/ml vs control: 0.30 ± 0.21 EU/ml), which indicated increased intestinal permeability in db/db mice (Figure 1A; P < 0.05). TEM observation demonstrated that the intercellular gaps of the colonic epithelium of db/db mice were widened and disrupted when compared to those of the littermate mice (Figure 1B).
Figure 1.
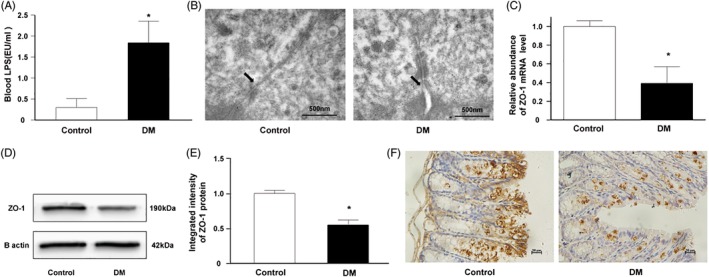
Damaged intestinal barrier structure and function in diabetic mice. (A) The blood LPS concentration in the DM group was markedly elevated in contrast to those in the control group (n = 6, *P < 0.05). (B) The intestinal tight junction ultrastructure (arrows) was disrupted in the DM group compared to the control group (bars = 500 nm). (C‐E) Compared to the control group, the expression of ZO‐1 mRNA and protein were significantly decreased in the colonic epithelium of the DM group (n = 6, *P < 0.05). (F) IHC indicated the lower intestinal ZO‐1 expression in the DM group in contrast to the control group (bar = 20 μm). (DM group: db/db mice, control group: littermate mice)
Tight junctions are important components of the intestinal barrier, and ZO‐1 is the key factor. The colons of db/db mice showed significantly lower levels of ZO‐1 mRNA and protein than those of littermate mice (Figures 1C‐E; P < 0.05). Immunohistochemistry (IHC) results demonstrated that db/db mice had reduced ZO‐1 expression in the intestinal epithelium. Unlike the extensive distribution in littermate mice, ZO‐1 was mainly localized in epithelial cells near the lumen in db/db mice (Figure 1F). Collectively, these results confirm the aberrant intestinal barrier structure and function of db/db mice.
3.2. Gut dysbiosis in DM mice
We analyzed the gut microbiota in db/db mice from 8 weeks to 12 weeks old. The estimated biodiversity by both indexes (Chao1 and Shannon index) in db/db mice was significantly lower than that in littermate mice (Figure 2A, B, P < 0.05). Firmicutes and Bacteroidetes comprise up to 90% of the gut microbiota. The Firmicutes/Bacteroidetes (F/B) ratio represents the major bacterial composition. The decrease in the F/B ratio in db/db mice suggested that the gut microbiota structure was shifted under DM conditions (Figure 2C). For other phyla, the abundance of Deferribacteres and Proteobacteria in littermate mice was relatively higher than that in db/db mice (Figure 2D).
Figure 2.
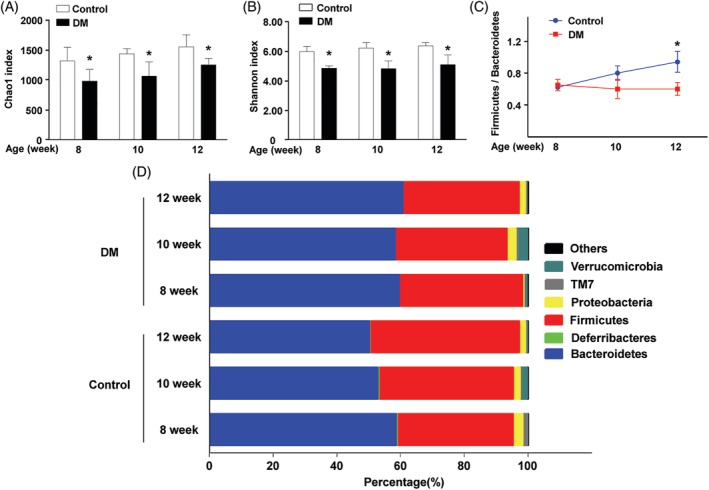
DM‐induced gut microbiota dysbiosis. (A, B) The gut microbiota Chao1 and Shannon index in the DM group were significantly lower than those in the control group (*P < 0.05). (C) The Firmicutes to Bacteroidetes ratio (F/B) in the DM group continuously descended while F/B in the control group kept ascending during the observation (*P < 0.05). (D) The gut microbiota composition of DM and control groups at the phylum level. (DM group: db/db mice, control group: littermate mice)
Next, the heatmap at the genus level showed differentiated genus distributions between db/db and littermate mice (Figure 3A). There were eight genera with reduced abundance in the gut microbiota of db/db mice (P < 0.05): Faecalibacterium, Dehalobacterium, Oscillospira, Ruminococcus, Mucispirillum, Prevotella, Bifidobacterium, and Allobaculum. In contrast, the abundance of four genera was increased in the gut microbiota of db/db mice (P < 0.05): Streptococcus, Candidatus Arthromitus, Anaerofustis, and Helicobacter.
Figure 3.
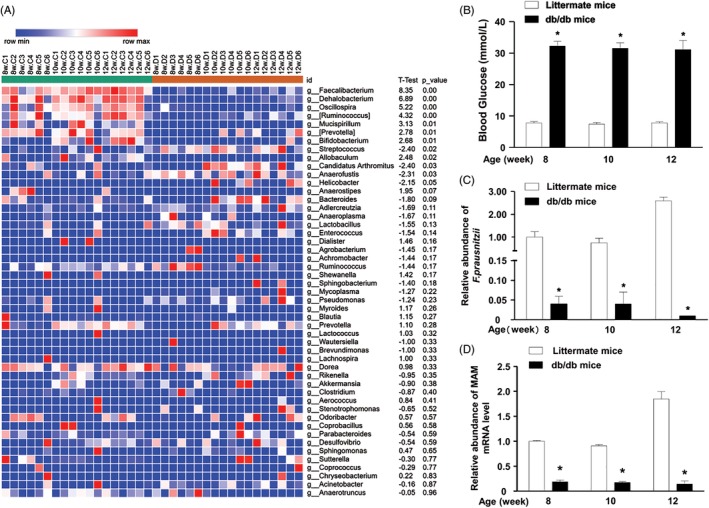
F. prausnitzii dramatically decreased in DM mice. (A). Heatmap depicted the relative percentage of each bacterial genus in the DM and control groups. (bacterial genus on the Y‐axis, sample name on X‐axis). (B). The blood glucose in the DM group sustained at a high level (8 weeks: 32.25 ± 1.46 mmol/L; 10 weeks: 31.50 ± 1.78 mmol/L; 12 weeks: 31.12 ± 2.94 mmol/L). By comparison, the blood glucose of control group kept steady at a low level (8 weeks: 7.83 ± 0.43 mmol/L; 10 weeks: 7.43 ± 0.55 mmol/L; 12 weeks: 7.83 ± 0.31 mmol/L). (C) The qRT‐PCR indicated the drastically low abundance of F. prausnitzii in the DM gut microbiota (*P < 0.05). (D) The qRT‐PCR indicated the markedly low expression of MAM mRNA in the DM gut microbiota (*P < 0.05). (DM group: db/db mice, control group: littermate mice)
3.3. Depletion of F. prausnitzii in the DM mouse gut
Only one species has been discovered in the Faecalibacterium genus F. prausnitzii, which makes single species research possible. The random blood glucose levels of DM mice were significantly higher than those of the littermate mice (Figure 3B, P < 0.05). In contrast to littermate mice, db/db mice maintained an extremely low F. prausnitzii abundance (Figure 3C, P < 0.05). Consistently, the abundance of MAM mRNA in db/db mice was markedly lower than that in littermate mice. Our data indicate that the abundance of F. prausnitzii and MAM are negatively correlated with the random blood glucose level.
Lukovac et al27 established a murine intestinal epithelial organoid model and explored the transcriptional response upon exposure to the supernatant of Akkermansia muciniphila or F. prausnitzii. We carried out a bioinformatic analysis of their microarray data (GSE59644). Our results implied that the most significant transcriptional response upon exposure to F. prausnitzii supernatant was cell adhesion (Figure S1A). Cell adhesion consists of the interaction between cell‐adhesion molecules and cell junction structures. The KEGG analysis suggested one of the signaling pathways that F. prausnitzii supernatant potentially modulates is tight junctions (Figure S1B). Our bioinformatic analysis indicated that metabolites from F. prausnitzii potentially regulate the intestinal barrier. The depletion of F. prausnitzii might critically alter the intestinal barrier in DM.
3.4. MAM from F. prausnitzii interacts with the tight junction pathway in the colonic epithelium
Given that gut bacteria exert biological functions via specific metabolites. MAM is a newly discovered metabolite of F. prausnitzii that potentially suppresses intestinal inflammation. Therefore, we sought to explore its functions in the intestinal epithelium. We transfected FLAG‐tagged MAM into colonic epithelial cells: NCM460, Caco2, and HT‐29. Two transfection concentrations (low: lipofectamine 3.75 μL and plasmid 5 μg; high: lipofectamine 7.5 μL and plasmid 5 μg) were tested. Cells transfected with the FLAG‐tagged MAM plasmid, especially at the high concentration, had exponentially increased expression levels of MAM mRNA (Figure 4A, P < 0.05). The data showed that colonic cells successfully expressed MAM, and the high concentration was optimal.
Figure 4.
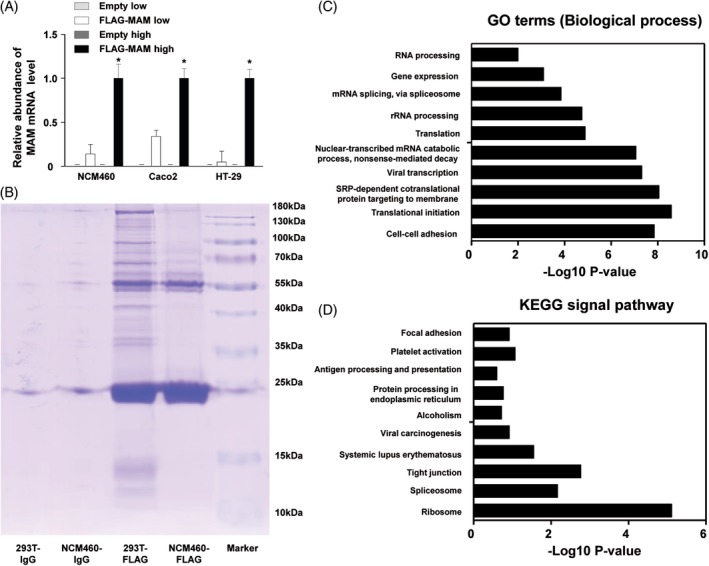
The establishment of MAM in vitro experiment model; the exploration of MAM downstream factors and modulation mechanisms. (A) The MAM expressions were successfully detected after transfection of FLAG‐MAM in NCM460, Caco2, and HT‐29 (*P < 0.05). (B) MAM‐interacted proteins were captured by IP. Prior to the MS analysis, proteins were separated by 10% SDS‐PAGE and stained with Coomassie blue. 293 T was taken as the transfection positive control. NCM460‐FLAG and 293 T‐FLAG: NCM460 and 293 T were incubated with FLAG antibody for IP. NCM460‐IgG and 293 T‐IgG: NCM460 and 293 T were incubated with nonimmune rabbit IgG polyclonal antibody for IP. (C) Gene ontology analysis on MAM‐interacted candidates reveals the potential functions of MAM in regulating intestinal epithelium biological processes. (D) KEGG analysis suggests MAM protein is potentially involved in the modulation of many signaling pathways. The regulation on the tight junctions is one of the most correlated pathways
Next, we transfected NCM460 cells with FLAG‐tagged MAM and performed an IP and MS to identify target candidates for an in‐depth mechanistic study (Figure 4B). 293T cells were used as the transfection positive control. An overall list of 139 single protein sequences was found, and 87 known human protein sequences were identified. The gene ontology analysis revealed groups of candidates involved in specific biological processes (Figure 4C). The most enriched biological process was cell‐cell adhesion junction, containing 18 related proteins: ZO‐1, DDX3X, ANXA2, FASN, FLNA, FLOT2, HSP90AB1, HSPA1B, JUP, KRT18, MYH9, PRDX1, PUF60, RACK1, RSL1D1, RPL14, RPL24, and YWHAZ. Moreover, the KEGG analysis showed that one of the most enriched pathways was the tight junction pathway (Figure 4D and Figure S2). The downstream effects of the tight junction pathway include tight junction assembly, adherens junction assembly, and paracellular permeability. Our analysis suggested that MAM regulates cell tight junction proteins, which might contribute to the maintenance of the intestinal barrier. ZO‐1, a key tight junction protein in cell adhesion, has been found to be drastically downregulated in the intestinal epithelium in DM. Thus, we sought to verify the effect of MAM on ZO‐1 and barrier function in the intestine in DM conditions.
3.5. MAM restores cell permeability in intestinal epithelial cells
The FLAG‐tagged MAM or empty vector was transfected into the human colonic epithelial NCM460, Caco2, and HT‐29 cells to confirm the effect of MAM on intercellular tight junctions. Compared with the empty transfection cells, NCM460 cells transfected with FLAG‐tagged MAM showed an evidently lower concentration of FITC‐dextran. Consistently, Caco2 and HT‐29 cells transfected with FLAG‐tagged MAM permitted less FITC‐dextran to pass through the transwell into the lower chamber than those transfected with the empty vector (Figure 5A, P < 0.05).
Figure 5.
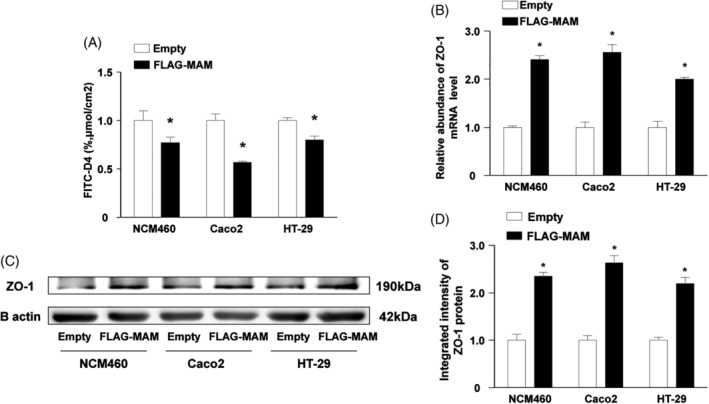
Transfection of FLAG‐tagged MAM protein decreased cell permeability and upregulated ZO‐1 expression in different colonic epithelial cells after LPS treatment. (A) NMC460, Caco2, and HT‐29 were treated with 1 g/mL LPS for 48 hours to establish the impaired cell permeability model. Meanwhile, cells were transfected with FLAG‐tagged MAM or empty vector. FLAG‐tagged MAM decreased FITC‐D4 permeation in NMC460, Caco2, and HT‐29. (B–D) The abundance of ZO‐1 mRNA and protein increased after transfection of FLAG‐tagged MAM in the impaired cell permeability model (NMC460, Caco2, and HT‐29 with LPS treatment) (*P < 0.05)
In all three colonic cell lines, in contrast to empty vector transfection, FLAG‐tagged MAM transfection upregulated ZO‐1 mRNA expression (Figure 5B, P < 0.05). Consistent with the mRNA expression data, the ZO‐1 protein level was significantly restored after FLAG‐tagged MAM plasmid transfection (Figure 5C, D, P < 0.05). Collectively, our data reveal that MAM protein upregulates ZO‐1 expression in intestinal epithelial cells.
3.6. MAM repairs the disrupted intestinal barrier in DM mice
The recombinant His‐tagged MAM protein was synthesized and purified for in vivo interventions (Figure 6A, B). The serum LPS levels in db/db mice drastically decreased (Figure 6C, P < 0.05) after His‐tagged MAM intervention. Furthermore, the TEM analysis showed no significant changes in intercellular gaps and structures in the colonic epithelium of littermate mice after treatment. Compared with the DM + PBS group, the His‐tagged MAM intervention group showed a reduced colonic epithelial intercellular gap (Figure 6D).
Figure 6.
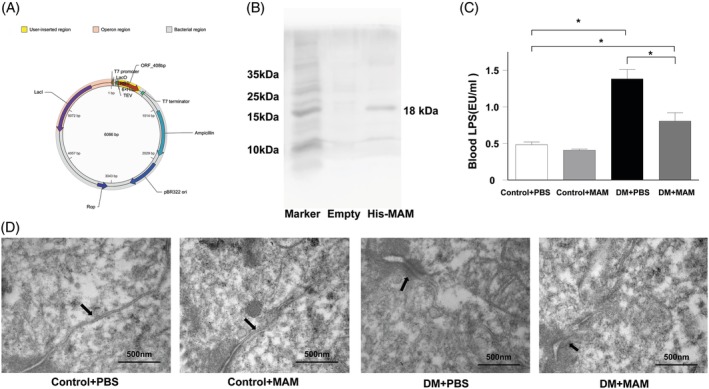
The intervention of recombinant His‐tagged MAM protein repaired DM mice intestine barrier. (A) Profile of pET‐6xHis/TEV/MAM plasmid encoded the full length of MAM sequence (named His‐tagged MAM). (B) Western blot with anti‐His antibody for His‐tagged MAM protein verification in BL21(DE3) bacterial protein extraction after IPTG induction. (C) His‐tagged MAM supplementation reduced the blood LPS concentration in db/db mice (DM + MAM vs DM + PBS, *P < 0.05). (D) Constitutive tight junction and undamaged intercellular gaps (arrows) were observed in both DM + PBS and DM + MAM groups; restored tight junctions and narrower intervals (arrows) were observed among colon epithelium in the DM + MAM group compared to the DM + PBS group (bars = 500 nm)
Our results show that His‐tagged MAM supplementation restored intestinal ZO‐1 mRNA and protein expression in the DM + MAM group compared to the DM + PBS group (Figures 7A‐C, P < 0.05). Compared with that in the control+PBS group, the mRNA and protein levels of ZO‐1 in the control+MAM group was upregulated but not significantly (P > 0.05). IHC suggested that ZO‐1 was extensively expressed in the colonic epithelium in the control+PBS and control+MAM mice. ZO‐1 expression was upregulated in the colonic epithelium of mice in the DM + MAM group compared to the DM + PBS group (Figure 7D). In total, our data show that MAM supplementation could restore the barrier structure and function of the intestine in DM mice.
Figure 7.
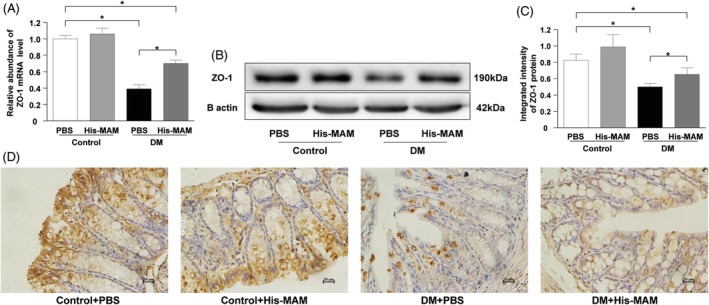
The intervention of recombinant His‐MAM protein upregulated ZO‐1 expression in DM mice. (A) Intestinal ZO‐1 mRNA abundance was upregulated in the DM + MAM group compared to the DM + PBS group (*P < 0.05). (B, C) His‐tagged MAM protein intervention increased the colonic epithelial ZO‐1 protein expression in the DM + MAM group compared to the DM + PBS group (*P < 0.05). (D) IHC showed the ZO‐1 positive cell distributed evenly in colonic epithelium in the DM + MAM group whereas they mainly distributed in epithelial cells near the lumen in the DM + PBS group (bar = 20 μm)
4. CONCLUSIONS
Increasingly, observations are revealing an aberrant gut microbiome in DM patients and animal models.28, 29 Gut dysbiosis is induced by the DM state.13 Conversely, the imbalance of gut microbiota plays a critical role in the DM development.30, 31 It has been proposed that the disrupted gut microbiota in T2DM conditions may contribute to the disrupted intestinal barrier in T2DM patients.32 Our observations indicate that gut dysbiosis is associated with a damaged intestinal barrier structure and function in DM mice. In the disrupted DM gut microbiota, we found that the F. prausnitzii abundance was markedly reduced. F. prausnitzii is well defined as the predominant butyrate producer in the gut microenvironment and accounts for up to 4% of the gut microbiota.33, 34Previous studies have shown the beneficial effects of F. prausnitzii on host health.35 Research has shown a decreased butyrate‐producing capacity in the gut microbiome of DM patients, which implies the absence of F. prausnitzii.10 Collectively, our results show that F. prausnitzii could be a promising biomarker and potential therapeutic target for DM.
Mounting evidence suggests that metabolites from F. prausnitzii modulate the intestinal epithelium. In a gnotobiotic rodent model, supernatant from F. prausnitzii influenced the production of mucosal glycans to maintain the development of colonic goblet cells.36 Moreover, F. prausnitzii supernatant can reduce intestinal permeability and ameliorate intestinal inflammation in mice with DSS‐induced colitis. The mechanism underlying the effects of F. prausnitzii may involve the expression of certain tight junction proteins but has not yet been elucidated.37, 38 A previous study utilized F. prausnitzii supernatant to treat mouse intestinal organoids.27 We applied bioinformatic analysis on their microarray data. Interestingly, the results indicated that F. prausnitzii supernatant potentially regulates cell‐cell adhesion and the tight junction pathway, which are key to the intestinal barrier integrity. MAM, a newly discovered protein product of F. prausnitzii, shows anti‐inflammatory effects in the intestine in IBD.22, 39 We questioned whether MAM could act on the intestinal barrier. Our results suggest that MAM potentially modulates numerous biological processes and signaling pathways of the intestinal epithelium. The most abundant biological functions and signaling pathways were cell‐cell adhesion and the tight junction pathway, respectively.
One of the MAM‐interacting proteins, ZO‐1, participates in both cell adhesion and the tight junction pathway. As an important structural protein of tight junctions, ZO‐1 maintains the integrity of tight junction complexes primarily by linking claudins, occluding, and cytoskeletal proteins. The aberrant expression of ZO‐1 may hinder the formation of intercellular tight junctions and impair the intestinal mechanical barrier, allowing pathogens and bacterial toxins to enter the bloodstream and leading to systematic complications such as intestinal infections, systemic inflammatory response syndrome, and multiple organ failure.40, 41 In an IBD mouse model, decreased ZO‐1 abundance and elevated intestinal permeability were found to occur ahead of obvious colonic inflammation, suggesting a critical role for ZO‐1 in the intestinal barrier.42 We observed decreased intestinal ZO‐1 expression associated with the depletion of F. prausnitzii in DM mice. MAM from F. prausnitzii potentially interacts with the tight junction pathway. One of the downstream effects of the tight junction pathway is tight junction protein assembly. Therefore, we hypothesized that MAM might activate the tight junction pathway and upregulate ZO‐1 expression to enhance intestinal barrier structure and function.
To verify our hypothesis, we assessed the effect of MAM protein in different colonic epithelial cell lines. Interestingly, in vitro experiments indicated that MAM positively regulates ZO‐1 expression and further promotes intercellular tight junctions after LPS treatment. Next, we sought to confirm the effect of MAM on the impaired intestinal barrier of DM mice. Recombinant His‐tagged MAM protein supplementation increased ZO‐1 expression and restored the intestinal barrier function in DM mice. However, the His‐tagged MAM intervention induced minor improvements in normal mice (control+MAM vs control+PBS). This differential effect may be partially due to the integrity of the normal mouse gut. The gut microbiome and metabolites participate in the maintenance of the intestinal structure. In normal mice, the gut microbiota and intestinal integrity are sustained in a balance state. Therefore, additional MAM supplementation may not substantially enhance the undamaged intestinal barrier. In total, for the first time, these results indicate that the F. prausnitzii metabolite MAM modulates the tight junction pathway to upregulate ZO‐1 expression and restore the aberrant intestinal barrier structure and function in DM mice.
In conclusion, we suggest that F. prausnitzii is depleted in the DM mouse gut microbiome and it could be used as a biomarker of DM. ZO‐1 and the tight junction pathway are direct downstream targets of F. prausnitzii‐derived MAM. Decreased F. prausnitzii abundance and MAM protein production may be one of the causes of disrupted intestinal permeability in DM. The present study informs the mechanistic understanding of the gut microbiota in DM progression and indicated the therapeutic potential of MAM for DM.
DISCLOSURE
There is no conflict of interest to be declared.
Supporting information
Figure S1 Bioinformatic analysis transcriptional responses of mouse gut organoids upon F. prausnitzii supernatant exposure. (a) Gene ontology analysis revealed metabolites from F. prausnitzii supernatant potentially regulate many intestinal epithelium biological processes. (b) KEGG analysis showed metabolites from F. prausnitzii supernatant are involved in multiple signaling pathways. The regulation on the tight junction is one of the most correlated signaling pathways.
Figure S2 MAM‐interacted proteins involved in tight junction pathway.
Profile of tight junction pathway from KEGG revealed proteins form tight junction pathway interacted with MAM (⭐:MAM‐interacted proteins).
ACKNOWLEDGEMENTS
This study was supported by National Natural Science Foundation of China (No. 81370475) and Natural Science Foundation of Guangdong Province (No. 2017A030313647).
Xu J, Liang R, Zhang W, et al. Faecalibacterium prausnitzii‐derived microbial anti‐inflammatory molecule regulates intestinal integrity in diabetes mellitus mice via modulating tight junction protein expression. Journal of Diabetes. 2020;12:224–236. 10.1111/1753-0407.12986
Funding information National Natural Science Foundation of China, Grant/Award Number: 81370475; Natural Science Foundation of Guangdong Province, Grant/Award Number: 2017A030313647
REFERENCES
- 1. Min XH, Yu T, Qing Q, et al. Abnormal differentiation of intestinal epithelium and intestinal barrier dysfunction in diabetic mice associated with depressed Notch/NICD transduction in Notch/Hes1 signal pathway. Cell Biol Int. 2014;38:1194‐1204. [DOI] [PubMed] [Google Scholar]
- 2. Pasini E, Corsetti G, Assanelli D, et al. Effects of chronic exercise on gut microbiota and intestinal barrier in human with type 2 diabetes. Minerva Med. 2019;110:3‐11. [DOI] [PubMed] [Google Scholar]
- 3. Thaiss CA, Levy M, Grosheva I, et al. Hyperglycemia drives intestinal barrier dysfunction and risk for enteric infection. Science. 2018;359:1376‐1383. [DOI] [PubMed] [Google Scholar]
- 4. Klüppelholz B, Thorand B, Koenig W, et al. Association of subclinical inflammation with deterioration of glycaemia before the diagnosis of type 2 diabetes: the KORA S4/F4 study. Diabetologia. 2015;58:2269‐2277. [DOI] [PubMed] [Google Scholar]
- 5. Koren O, Goodrich JK, Cullender TC, et al. Host remodeling of the gut microbiome and metabolic changes during pregnancy. Cell. 2012;150:470‐480. [DOI] [PMC free article] [PubMed] [Google Scholar]
- 6. Zhang Z, Li J, Zheng W, et al. Peripheral lymphoid volume expansion and maintenance are controlled by gut microbiota via RALDH+ dendritic cells. Immunity. 2016;44:330‐342. [DOI] [PMC free article] [PubMed] [Google Scholar]
- 7. Arthur JC, Gharaibeh RZ, Mühlbauer M, et al. Microbial genomic analysis reveals the essential role of inflammation in bacteria‐induced colorectal cancer. Nat Commun. 2014;5:4724. [DOI] [PMC free article] [PubMed] [Google Scholar]
- 8. Belcheva A, Irrazabal T, Robertson SJ, et al. Gut microbial metabolism drives transformation of MSH2‐deficient colon epithelial cells. Cell. 2014;158:288‐299. [DOI] [PubMed] [Google Scholar]
- 9. Carter R, Wolf J, van Opijnen T, et al. Genomic analyses of pneumococci from children with sickle cell disease expose host‐specific bacterial adaptations and deficits in current interventions. Cell Host Microbe. 2014;15:587‐599. [DOI] [PMC free article] [PubMed] [Google Scholar]
- 10. Qin J, Li Y, Cai Z, et al. A metagenome‐wide association study of gut microbiota in type 2 diabetes. Nature. 2012;490:55‐60. [DOI] [PubMed] [Google Scholar]
- 11. Karlsson FH, Tremaroli V, Nookaew I, et al. Gut metagenome in European women with normal, impaired and diabetic glucose control. Nature. 2013;498:99‐103. [DOI] [PubMed] [Google Scholar]
- 12. Neyrinck AM, Possemiers S, Druart C, et al. Prebiotic effects of wheat arabinoxylan related to the increase in bifidobacteria, Roseburia and Bacteroides/Prevotella in diet‐induced obese mice. PLoS One. 2011;6:e20944. [DOI] [PMC free article] [PubMed] [Google Scholar]
- 13. Larsen N, Vogensen FK, van den Berg FW, et al. Gut microbiota in human adults with type 2 diabetes differs from non‐diabetic adults. PLoS One. 2010;5:e9085. [DOI] [PMC free article] [PubMed] [Google Scholar]
- 14. Zhang L, Qin Q, Liu M, Zhang X, He F, Wang G. Akkermansia muciniphila can reduce the damage of gluco/lipotoxicity, oxidative stress, and inflammation and normalize intestine microbiota in streptozotocin‐induced diabetic rats. Pathog Dis. 2018;76:1‐15. [DOI] [PubMed] [Google Scholar]
- 15. Pace F, Carvalho BM, Zanotto TM, et al. Helminth infection in mice improves insulin sensitivity via modulation of gut microbiota and fatty acid metabolism. Pharmacol Res. 2018;132:33‐46. [DOI] [PubMed] [Google Scholar]
- 16. Zhao L, Zhang F, Ding X, et al. Gut bacteria selectively promoted by dietary fibers alleviate type 2 diabetes. Science. 2018;359:1151‐1156. [DOI] [PubMed] [Google Scholar]
- 17. Navab‐Moghadam F, Sedighi M, Khamseh ME, et al. The association of type II diabetes with gut microbiota composition. Microb Pathog. 2017;110:630‐636. [DOI] [PubMed] [Google Scholar]
- 18. Geirnaert A, Calatayud M, Grootaert C, et al. Butyrate‐producing bacteria supplemented in vitro to Crohn's disease patient microbiota increased butyrate production and enhanced intestinal epithelial barrier integrity. Sci Rep. 2017;7:11450. [DOI] [PMC free article] [PubMed] [Google Scholar]
- 19. Martín R, Miquel S, Benevides L, et al. Functional characterization of novel Faecalibacterium prausnitzii strains isolated from healthy volunteers: a step forward in the use of F. prausnitzii as a next‐generation probiotic. Front Microbiol. 2017;8:1226. [DOI] [PMC free article] [PubMed] [Google Scholar]
- 20. Munukka E, Rintala A, Toivonen R, et al. Faecalibacterium prausnitzii treatment improves hepatic health and reduces adipose tissue inflammation in high‐fat fed mice. ISME J. 2017;11:1667‐1679. [DOI] [PMC free article] [PubMed] [Google Scholar]
- 21. Zhang M, Qiu X, Zhang H, et al. Faecalibacterium prausnitzii inhibits interleukin‐17 to ameliorate colorectal colitis in rats. PLoS One. 2014;9:e109146. [DOI] [PMC free article] [PubMed] [Google Scholar]
- 22. Quévrain E, Maubert MA, Michon C, et al. Identification of an anti‐inflammatory protein from Faecalibacterium prausnitzii, a commensal bacterium deficient in Crohn's disease. Gut. 2016;65:415‐425. [DOI] [PMC free article] [PubMed] [Google Scholar]
- 23. Ramirez‐Farias C, Slezak K, Fuller Z, Duncan A, Holtrop G, Louis P. Effect of inulin on the human gut microbiota: stimulation of Bifidobacterium adolescentis and Faecalibacterium prausnitzii . Br J Nutr. 2009;101:541‐550. [DOI] [PubMed] [Google Scholar]
- 24. Maccarrone G, Bonfiglio JJ, Silberstein S, Turck CW, Martins‐de‐Souza D. Characterization of a protein Interactome by co‐immunoprecipitation and shotgun mass spectrometry. Methods Mol Biol. 2017;1546:223‐234. [DOI] [PubMed] [Google Scholar]
- 25. Cheng D, Xu JH, Li JY, et al. Butyrate ameliorated‐NLRC3 protects the intestinal barrier in a GPR43‐dependent manner. Exp Cell Res. 2018;368:101‐110. [DOI] [PubMed] [Google Scholar]
- 26. Yu T, Lu XJ, Li JY, et al. Overexpression of miR‐429 impairs intestinal barrier function in diabetic mice by down‐regulating occludin expression. Cell Tissue Res. 2016;366:341‐352. [DOI] [PubMed] [Google Scholar]
- 27. Lukovac S, Belzer C, Pellis L, et al. Differential modulation by Akkermansia muciniphila and Faecalibacterium prausnitzii of host peripheral lipid metabolism and histone acetylation in mouse gut organoids. MBio. 2014;5:e01438‐14. [DOI] [PMC free article] [PubMed] [Google Scholar]
- 28. Forslund K, Hildebrand F, Nielsen T, et al. Disentangling type 2 diabetes and metformin treatment signatures in the human gut microbiota. Nature. 2015;528:262‐266. [DOI] [PMC free article] [PubMed] [Google Scholar]
- 29. Bagarolli RA, Tobar N, Oliveira AG, et al. Probiotics modulate gut microbiota and improve insulin sensitivity in DIO mice. J Nutr Biochem. 2017;50:16‐25. [DOI] [PubMed] [Google Scholar]
- 30. Li K, Zhang L, Xue J, et al. Dietary inulin alleviates diverse stages of type 2 diabetes mellitus via anti‐inflammation and modulating gut microbiota in db/db mice. Food Funct. 2019;10(4):1915‐1927. [DOI] [PubMed] [Google Scholar]
- 31. de Groot P, Scheithauer T, Bakker GJ, et al. Donor metabolic characteristics drive effects of faecal microbiota transplantation on recipient insulin sensitivity, energy expenditure and intestinal transit time. Gut. 2019; pii: gutjnl‐2019‐318320 [Epub ahead of print]. [DOI] [PMC free article] [PubMed] [Google Scholar]
- 32. Spiljar M, Merkler D, Trajkovski M. The immune system bridges the gut microbiota with systemic energy homeostasis: focus on TLRs, mucosal barrier, and SCFAs. Front Immunol. 2017;8:1353. [DOI] [PMC free article] [PubMed] [Google Scholar]
- 33. Benevides L, Burman S, Martin R, et al. New insights into the diversity of the genus Faecalibacterium . Front Microbiol. 2017;8:1790. [DOI] [PMC free article] [PubMed] [Google Scholar]
- 34. Arumugam M, Raes J, Pelletier E, et al. Enterotypes of the human gut microbiome. Nature. 2011;473:174‐180. [DOI] [PMC free article] [PubMed] [Google Scholar]
- 35. Lopez‐Siles M, Duncan SH, Garcia‐Gil LJ, Martinez‐Medina M. Faecalibacterium prausnitzii: from microbiology to diagnostics and prognostics. ISME J. 2017;11:841‐852. [DOI] [PMC free article] [PubMed] [Google Scholar]
- 36. Wrzosek L, Miquel S, Noordine ML, et al. Bacteroides thetaiotaomicron and Faecalibacterium prausnitzii influence the production of mucus glycans and the development of goblet cells in the colonic epithelium of a gnotobiotic model rodent. BMC Biol. 2013;11:61. [DOI] [PMC free article] [PubMed] [Google Scholar]
- 37. Martín R, Miquel S, Chain F, et al. Faecalibacterium prausnitzii prevents physiological damages in a chronic low‐grade inflammation murine model. BMC Microbiol. 2015;15:67. [DOI] [PMC free article] [PubMed] [Google Scholar]
- 38. Carlsson AH, Yakymenko O, Olivier I, et al. Faecalibacterium prausnitzii supernatant improves intestinal barrier function in mice DSS colitis. Scand J Gastroenterol. 2013;48:1136‐1144. [DOI] [PubMed] [Google Scholar]
- 39. Breyner NM, Michon C, de Sousa CS, et al. Microbial anti‐inflammatory molecule (MAM) from Faecalibacterium prausnitzii shows a protective effect on DNBS and DSS‐induced colitis model in mice through inhibition of NF‐κB pathway. Front Microbiol. 2017;8:114. [DOI] [PMC free article] [PubMed] [Google Scholar]
- 40. Hering NA, Richter JF, Krug SM, et al. Yersinia enterocolitica induces epithelial barrier dysfunction through regional tight junction changes in colonic HT‐29/B6 cell monolayers. Lab Invest. 2011;91:310‐324. [DOI] [PubMed] [Google Scholar]
- 41. König J, Wells J, Cani PD, et al. Human intestinal barrier function in health and disease. Clin Transl Gastroenterol. 2016;7:e196. [DOI] [PMC free article] [PubMed] [Google Scholar]
- 42. Gong Y, Li H, Li Y. Effects of Bacillus subtilis on epithelial tight junctions of mice with inflammatory bowel disease. J Interferon Cytokine Res. 2016;36:75‐85. [DOI] [PubMed] [Google Scholar]
Associated Data
This section collects any data citations, data availability statements, or supplementary materials included in this article.
Supplementary Materials
Figure S1 Bioinformatic analysis transcriptional responses of mouse gut organoids upon F. prausnitzii supernatant exposure. (a) Gene ontology analysis revealed metabolites from F. prausnitzii supernatant potentially regulate many intestinal epithelium biological processes. (b) KEGG analysis showed metabolites from F. prausnitzii supernatant are involved in multiple signaling pathways. The regulation on the tight junction is one of the most correlated signaling pathways.
Figure S2 MAM‐interacted proteins involved in tight junction pathway.
Profile of tight junction pathway from KEGG revealed proteins form tight junction pathway interacted with MAM (⭐:MAM‐interacted proteins).


