Abstract
Most DNA evidence is a mixture of two or more people. Cybergenetics TrueAllele® system uses Bayesian computing to separate genotypes from mixture data and compare genotypes to calculate likelihood ratio (LR) match statistics. This validation study examined the reliability of TrueAllele computing on laboratory‐generated DNA mixtures containing up to ten unknown contributors. Using log(LR) match information, the study measured sensitivity, specificity, and reproducibility. These reliability metrics were assessed under different conditions, including varying the number of assumed contributors, statistical sampling duration, and setting known genotypes. The main determiner of match information and variability was how much DNA a person contributed to a mixture. Observed contributor number based on data peaks gave better results than the number known from experimental design. The study found that TrueAllele is a reliable method for analyzing DNA mixtures containing up to ten unknown contributors.
Keywords: forensic science, DNA mixture, validation study, genotype deconvolution, genotype separation, likelihood ratio, low‐template DNA, Bayesian analysis, probabilistic genotyping, TrueAllele® system
DNA evidence is the gold standard of forensic science 1. With the advent of polymerase chain reaction (PCR), minute quantities of DNA could be amplified a billion‐fold to detectable levels 2. For twenty years, PCR amplification of short tandem repeat (STR) testing 3 has enabled forensic scientists to identify people through crime scene evidence, or exclude them 4. For a DNA item from one person, the strength of match is statistically expressed as a likelihood ratio (LR)—one over the matching genotype’s rarity in a population.
Most DNA evidence contains two or more people (e.g., rape kits, handguns, and clothing). These DNA mixtures are highly probative, able to associate several people to an evidence item collected from a crime scene. A suspect may be unable to explain why his DNA is there. Mixtures can also show who did not leave their DNA.
DNA signals from one person are easy to interpret and statistically report 5. This is because there is just one genotype possibility, having only one or two alleles at a locus. However, different combinations of contributor genotypes can explain a mixture’s quantitative STR peak height data. These multiple genotype possibilities must all be considered, and assigned accurate probabilities, in order to calculate a valid LR match statistic. The combinatorial task is beyond human calculation, especially with more than two contributors in the mix 6.
Cybergenetics developed the TrueAllele® probabilistic genotyping method twenty years ago to solve the DNA mixture problem 7. Using Bayesian modeling 8, the computer considers genotype combinations of multiple contributors, assigns genotype probabilities, and compares genotypes to calculate LR match statistics 9. The system helped identify victim remains in the World Trade Center disaster 10 and has been used in forensic casework since 2009 11. TrueAllele and related software 12, 13, 14, 15, 16, 17 systems are widely used by crime labs for resolving DNA mixtures.
Early validation studies entailed detailed comparison of computer and human interpretation. But computers rapidly outpaced human mixture analysis. The LR statistic usefully summarizes much of DNA collection, testing, analysis, interpretation, reporting, and testimony in a single number 18. Moreover, the log(LR) logarithm is a standard additive scientific unit of information, called the “weight of evidence” 19. Modern DNA mixture validation studies use these LR summary match statistics 20, 21, 22, 23.
Early TrueAllele validation studies were conducted on single source DNA samples 24. Later peer‐reviewed TrueAllele validations studied mixtures containing up to two 9, 20, 25, three 26, four 27, 28, or five 29 people. Typical validation metrics included sensitivity, specificity, and reproducibility. Other assessed variables and features were low‐template DNA, joint data analysis, and contributor number. The studies tested both laboratory‐generated and casework DNA mixture data.
This study assesses the validity of TrueAllele® computer interpretation on complex DNA mixtures. It extends previous validation work 9, 26, 29 by examining STR data from laboratory‐generated mixtures containing up to ten unknown contributors. The study measures log(LR) match information along the usual axes of sensitivity, specificity, and reproducibility 18, 22, 26. It also examines the influence of contributor number on these metrics, and the effect of statistical sampling duration. Other results include the impact of “peeling” away multiple layers of genotype contributors, and how the number of input data peaks affects the LR. Mixture composition followed a randomized design, with two TrueAllele interpretation groups independently analyzing the same STR data using their own in‐house computer systems.
Materials and Methods
Data Generation
The Cuyahoga County Regional Forensic Science Laboratory (CCRFSL) prepared 18 DNA mixture samples. The number of contributors ranged from 2 through 10, with two samples per contributor number. To design the DNA mixtures, reference genotypes for a sample were randomly drawn from 20 preset male and female individuals of predominantly Caucasian descent. Mixture weights were randomly drawn from a uniform Dirichlet distribution; these designed mixture proportions are shown in Table 1.
Table 1.
Study design.
| Name | 2‐1 | 2‐2 | 3‐1 | 3‐2 | 4‐1 | 4‐2 | 5‐1 | 5‐2 | 6‐1 | 6‐2 | 7‐1 | 7‐2 | 8‐1 | 8‐2 | 9‐1 | 9‐2 | 10‐1 | 10‐2 |
|---|---|---|---|---|---|---|---|---|---|---|---|---|---|---|---|---|---|---|
| Designed (Des) | 2 | 3 | 4 | 5 | 6 | 7 | 8 | 9 | 10 | |||||||||
| Observed (Obs) | 2 | 2 | 2 | 3 | 3 | 4 | 4 | 5 | 5 | 5 | 5 | 5 | 6 | 5 | 5 | 6 | 6 | 5 |
| Reference weight | 78 | 66 | 94 | 55 | 66 | 41 | 39 | 36 | 56 | 35 | 65 | 21 | 33 | 42 | 32 | 24 | 46 | 25 |
| 22 | 34 | 5 | 33 | 22 | 26 | 37 | 30 | 19 | 20 | 17 | 20 | 20 | 16 | 20 | 17 | 18 | 19 | |
| 1 | 12 | 7 | 20 | 16 | 21 | 13 | 18 | 5 | 19 | 18 | 15 | 15 | 17 | 17 | 14 | |||
| 5 | 14 | 6 | 9 | 9 | 13 | 4 | 15 | 13 | 12 | 11 | 11 | 6 | 13 | |||||
| 1 | 5 | 2 | 8 | 4 | 13 | 9 | 8 | 7 | 9 | 5 | 12 | |||||||
| 1 | 6 | 3 | 8 | 3 | 5 | 7 | 8 | 5 | 6 | |||||||||
| 3 | 4 | 2 | 2 | 4 | 8 | 1 | 5 | |||||||||||
| 1 | 1 | 3 | 6 | 1 | 3 | |||||||||||||
| 1 | 0.2 | 1 | 1 | |||||||||||||||
| 0.5 | 1 | |||||||||||||||||
The sample name (Name) gives the number of contributors in the study design, followed by an instance number. The number of contributors Cybergenetics observed (Obs) did not exceed the actual number in the study design (Des). Each column gives the mixture contributor weight as percentages. In a column where Des is greater than Obs, Des–Obs grayed out contributors could not be inferred.
CCRFSL generated the STR mixture data in their laboratory. DNA quantity was measured with Applied Biosystems® (AB, Foster City, CA) Quantifier® Duo quantification kit using a 7500 SDS Real‐Time PCR System. Each 0.5 ng DNA mixture sample was amplified using the PowerPlex® Fusion amplification system (Promega, Madison, WI).
A 0.5 μL volume of amplified DNA product was size‐separated using an AB 3500 genetic analyzer. The analyzer recorded electropherogram (EPG) data as .hid files. CCRFSL determined a ratio of 0.37 for 3130 to 3500 AB genetic analyzer relative fluorescence units (RFU). TrueAllele analysis multiplied peak heights by this ratio, rescaling 3500 data down to the 3130 levels specified in prior probability parameters.
Interpretation Methods
TrueAllele® Casework (Cybergenetics, Pittsburgh, PA) was used to separate the STR mixture data and calculate DNA match statistics. The software version numbers were 3.25.5840.1 for the genotyping server, and 3.3.5926.1 for the Visual User Interface (VUIer™) client. The system has no analytical threshold. Signals were used at or above 10 RFU, a level within baseline noise.
Genotype Separation and Mixture Weight
TrueAllele uses a hierarchical Bayesian probability model that adds genotype alleles, accounts for artifacts, and determines variance to explain STR data and derive parameter values and their uncertainty 9, 20. The computer employs Markov chain Monte Carlo (MCMC) statistical sampling 30 to solve the Bayesian equations. The resulting joint posterior probability provides marginal distributions for contributor genotypes, mixture weights, and other explanatory variables.
Starting from DNA mixture data, TrueAllele separates out contributor genotypes, up to probability. This statistical inference is objective, since there are no data choices, and the separation process does not know the comparison references. The inference is thorough, since the computer considers tens of thousands of possible values for each variable.
With laboratory‐generated data, observed mixture proportions may differ from designed proportions, due to pipetting or amplification variation. TrueAllele can determine more precise mixture weights by conditioning on all known contributor genotypes 29, as used here for presenting more exact weights.
Match Information
After genotype separation, TrueAllele calculates an LR match statistic between a separated unknown genotype and a reference genotype, relative to a population genotype 9. This comparison gives the strength of association (or “weight of evidence”) between the two genotypes, recorded in log(LR) ban units 31.
The LR is the final common pathway in forensic DNA analysis, summarizing identification information from the entire STR process in one number that can be reported or presented in court. Key validation metrics can be statistically assessed in terms of additive log(LR) values 18.
Linear Relationship
The amount of DNA match information is proportional to the amount of contributor DNA, measured on logarithmic scales 20, 29. No DNA gives zero information. As contributor DNA amount increases, so too does average LR. The log–log relationship is linear (Fig. 1), with a predictable slope 29. When evidence genotype probability reaches 100%, the contributor’s log(LR) plateaus at its maximum value. The relationship is inverted with exclusionary information.
Figure 1.
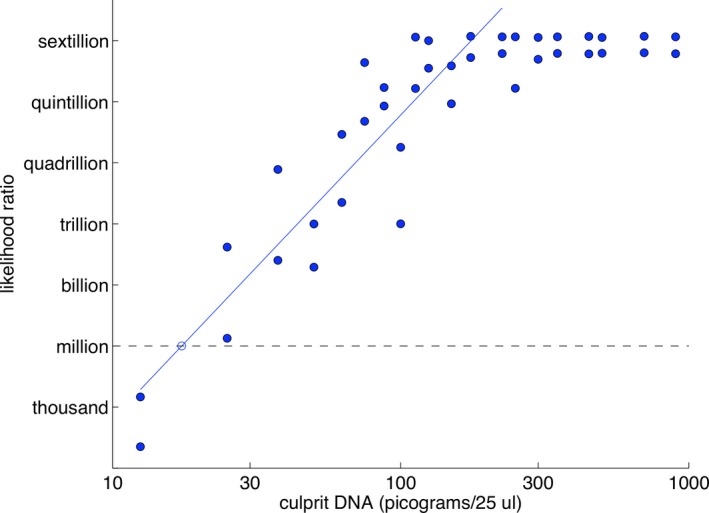
Linearity. Scatterplot showing log(LR) match information (y‐axis) versus log(DNA) (x‐axis) for TrueAllele analysis of forty two‐person mixtures solved assuming a known contributor genotype. The data (blue dots) follow an increasing regression line ramp (solid blue line) that plateaus once reaching maximum match information. The million LR match level is shown (dashed gray line). Reproduced from 20 with permission of the author (https://doi.org/10.1371/journal.pone.0008327.g007)
Some mixture ratios disrupt the ramp‐shaped relationship. Equal contributor weights dent the ramp downward 20. This is because peak height data become less helpful in separating genotypes when contributor amounts are similar. The less separated genotypes give lower log(LR) values, which fall below the line.
Allele Dropout
Genotype alleles appear as peaks in EPG data. An allele’s expected peak height is proportional to the number of molecules (grouped from all contributors) in the pre‐PCR DNA template. PCR is a random counting process, so competition for the polymerase DNA copying enzyme favors those alleles that are present in greater amounts 32. Less amplified alleles may show lower peaks that “drop out” from the data (e.g., are below an analytical threshold of, say, 30–300 RFU) for DNA interpretation methods that use such thresholds. Entirely missing peaks may result from absent alleles.
TrueAllele’s likelihood function compares observed data with a hypothesized peak pattern to assess how well the pattern explains the data. A pattern that closely approximates the data has greater likelihood; conversely, poor data explanations have lower likelihood. With dropout, the true allele does not appear in the data. Therefore, the true genotype containing that allele poorly explains the data and receives a lower likelihood.
In Bayesian inference, this lower likelihood imparts a lower probability to the true genotype. TrueAllele accounts for dropout by assigning lower probability to genotype values that lack data support. When comparing with references, low evidence genotype probability may translate into exclusionary LRs at a locus.
TrueAllele Processing
Procedure
TrueAllele analysts processed the samples in two ways, using designed and observed contributor numbers. The designed number of contributors was defined by the experimental design. Mixtures showing fewer data peaks could indicate a smaller number of observed contributors.
Analysts counted STR data peaks, and considered the height pattern, to estimate the observed number of contributors. TrueAllele interpretation requests were run at least twice. MCMC burn‐in was as long as read‐out, running up to 100,000 (100K) cycles in this study (Table 2). Each MCMC sampling cycle visited all variables.
Table 2.
Independent analysis requests.
| Mixture | Contributors | Sampling | |||
|---|---|---|---|---|---|
| Designed | Observed | 1000’s (K) of Cycles | |||
| CYB | CCRFSL | CYB | CCRFSL | ||
| 2‐1 | 2 | 2 | 2 | 5 | 5 |
| 2‐2 | 2 | 2 | 2 | 5 | 5 |
| 3‐1 | 3 | 2 | 2 | 10 | 15 |
| 3‐2 | 3 | 3 | 3 | 10 | 15 |
| 4‐1 | 4 | 3 | 3 | 25 | 25 |
| 4‐2 | 4 | 4 | 4 | 25 | 25 |
| 5‐1 | 5 | 4 | 4 | 50 | 50 |
| 5‐2 | 5 | 5 | 5 | 50 | 50 |
| 6‐1 | 6 | 5 | 5 | 100 | 100 |
| 6‐2 | 6 | 5 | 5 | 100 | 100 |
| 7‐1 | 7 | 5 | 5 | 100 | 100 |
| 7‐2 | 7 | 6 | 6 | 100 | 100 |
| 8‐1 | 8 | 6 | 6 | 100 | 100 |
| 8‐2 | 8 | 5 | 6 | 100 | 100 |
| 9‐1 | 9 | 5 | 6 | 100 | 100 |
| 9‐2 | 9 | 6 | 6 | 100 | 100 |
| 10‐1 | 10 | 6 | 6 | 100 | 100 |
| 10‐2 | 10 | 5 | 7 | 100 | 100 |
Each mixture item (Mixture) was processed using a user‐specified number of contributors (Contributors) and MCMC sampling cycles (Sampling). The contributor number was based on either the study design (Designed) or observed data peaks (Observed). Parameters are shown for Cybergenetics (CYB) and Cuyahoga County crime laboratory (CCRFSL) processing. In the number of sampling cycles, “K” denotes a thousand.
To calculate match statistics, inferred genotypes were compared with known reference genotypes, relative to the National Institute of Standards and Technology (NIST) 1036 African‐American, Caucasian, and Hispanic ethnic populations 33. The co‐ancestry coefficient was set to 1%. The reported log(LR) was the minimum calculated across ethnic populations. Labels of log(LR) bins represent the least integer value of a unit‐length interval. For example, bin “3” collected log(LR) values in the [3,4) interval between 3 and 4 ban.
Peeling
Known genotypes can be entered into TrueAllele, remaining constant throughout a computer run. These fixed parameters reduce the number of unknown genotypes in a mixture. The additional information can produce sharper probability distributions for the remaining genotypes. For example, in a two‐person sexual assault mixture, assuming the victim’s known genotype can help infer an unknown assailant genotype. In the Australian Robert Xie case 34, TrueAllele peeling helped separate the genotypes of five family members mixed together in a garage floor bloodstain.
In sequential genotype “peeling,” with N contributors the initial TrueAllele run separates out N unknown genotypes. Comparing these inferred genotypes with provided references establishes a first contributor genotype, based on the highest match statistic. In the next run, the computer is given the first established genotype, and solves for the remaining N−1 unknown genotypes to establish a second contributor genotype. Continuing, the third run assumes the first and second established genotypes to solve for N−2 unknown genotypes and establishes a third contributor genotype. Genotype peeling continues until all contributors are resolved.
There is no fixed log(LR) cutoff for peeling away a contributor genotype. An unhelpful known genotype assumption may depress a match statistic, or leave it unchanged. Alternatively, peeling order can be determined by mixture weight.
Genotype peeling has an equivalent LR formation. Let Ki be a known genotype, Uj an unknown genotype, and S a subject’s comparison genotype. At the M th peeling stage with M known genotypes in an N contributor mixture, the LR is,
Sampling
Longer MCMC sampling generally improves genotype inference. The mixtures were processed over a range of sampling times. The usual sampling time was 100K cycles for both burn‐in and read‐out. Additional sampling times of 5K, 10K, 25K, and 50K MCMC cycles were explored to assess log(LR) sensitivity and reproducibility. Specificity was assessed on five‐observed‐contributor samples, since this mixture group yielded the most inferred genotypes.
Peak Number
TrueAllele EPG analysis quantitatively models the peaks that are present in DNA data. The system’s likelihood function permits the number of modeled genotype alleles to differ from the number of data peaks 9. To accelerate the inference process, a maximum number of peaks can limit DNA data at a locus. Ranking peaks by descending height can also remove some low‐level baseline artifacts.
DNA mixture samples containing two, three, four, or five observed contributors were processed at a default peak limit of 10 peaks. These mixtures were also re‐examined using up to 20 peaks. Samples containing six or more contributors were processed at a 20‐peak limit.
Independence
Cybergenetics and CCRFSL ran their own TrueAllele systems independently on the same STR data of the 18 mixture samples. The two groups used the same server software version. Software operators independently determined observed contributor number. Table 2 lists the processing parameters Cybergenetics and CCRFSL used for TrueAllele mixture separation requests.
Validation Metrics
SWGDAM guidelines advise assessing sensitivity, specificity, and reproducibility in probabilistic genotyping validation studies 22. These three metrics were evaluated on log(LR) results based on observed contributor number. Summary statistics and distributions were calculated for each metric, and grouped by contributor number.
The sensitivity metric measures how well a genotyping system detects true contributors to a DNA mixture 22, 26. Sensitivity was evaluated by examining the log(LR) distribution of genotype comparisons to true contributors. Values under zero ban were considered contributor negatives for purposes of this study.
The specificity metric measures how well a genotyping system rejects noncontributors 22, 26. A log(LR) distribution was formed by collating match statistics that compared a set of inferred mixture contributor genotypes with 10,000 randomly generated Caucasian reference genotypes. Values over zero were considered noncontributor positives in this study. The cumulative probability of noncontributor positive match values was determined.
The reproducibility metric describes the closeness of match values on replicate computer runs 22, 26. MCMC has sampling variation, which was quantified by measuring within‐group standard deviation 18. This root‐mean‐square σw statistic describes the variation of a group of log(LR) values for one contributor to a DNA mixture, where genotypes derived from multiple independent computer runs are compared with the same corresponding reference genotype.
Results
Sensitivity
Contributors Decrease Match Strength
As the number of mixture contributors increased, average match strength decreased. Match statistic histogram distributions shifted toward zero information, as the contributor number increased from two to six contributors (Fig. 2).
Figure 2.
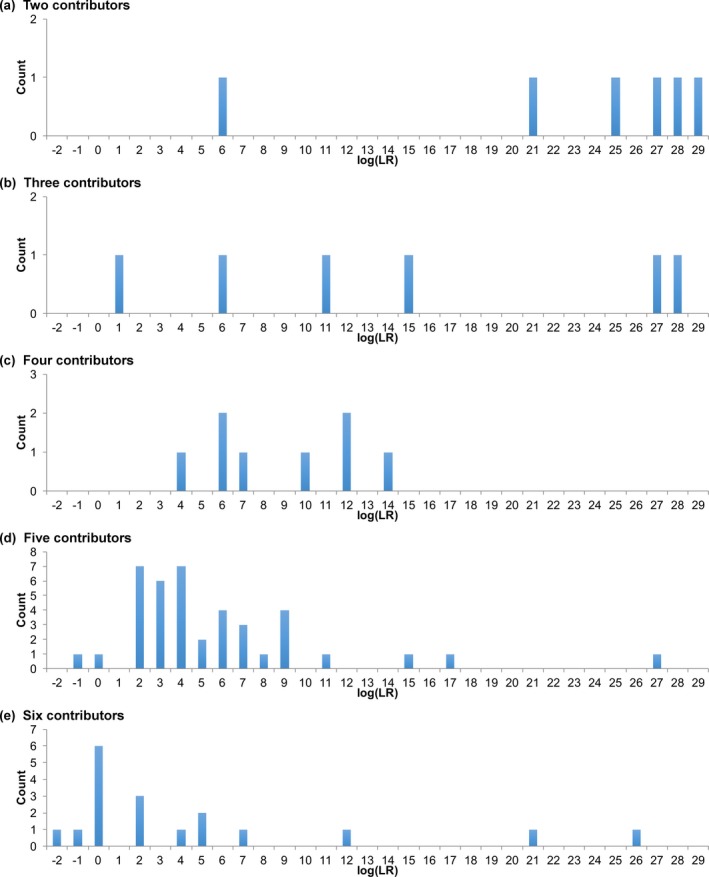
Sensitivity. Histograms show match statistics for comparisons to true contributors. The horizontal axis gives match statistics as binned log(LR) values. The vertical axis is the number of comparisons for each log(LR) bin. The distributions are shown for (a) two through (e) six observed unknown contributors
Minimum and mean log(LR) values decreased with increasing contributor number (Table S1a). Mean log(LR) decreased from 23 ban for two contributors, to 5 ban with six contributors. The minimum log(LR) fell more gradually, decreasing from 6 ban for two contributors to −1 ban with six contributors.
Genotypes inferred from mixtures were usually uncertain. In contrast, a genotype inferred from a single‐source DNA sample from one person generally showed little or no uncertainty, giving a probability of one at matching allele pairs. More definite genotypes generally yielded higher match statistics.
A single source evidence genotype most often produced a log(LR) value over 25 ban, when testing on 22 PowerPlex Fusion loci. With more mixture contributors, the maximum log(LR) value of the major contributor remained relatively constant at 26 ban (Fig. 2; Table S1a).
Contributors Increase Negatives
With more mixture contributors, the log(LR) distribution shifted leftward toward zero ban. This shift increased the chance of a contributor negative log(LR) value. Negative log(LR) values were seen with five or six contributor mixtures (Table S1a). Out of 78 comparisons to true contributors, 3 gave negative log(LR) values (Table S1b). The lowest value was −1.06 ban, seen in a six‐contributor mixture.
Specificity
Contributors Decrease Specificity
The noncontributor distribution shifted progressively rightward toward zero ban with more mixture contributors (Fig. 3). For two‐person mixtures, the average log(LR) value was −33 ban. Average log(LR) gradually increased to −13 ban with six unknown contributors. Almost all the noncontributor comparisons produced a negative log(LR) value, regardless of contributor number.
Figure 3.
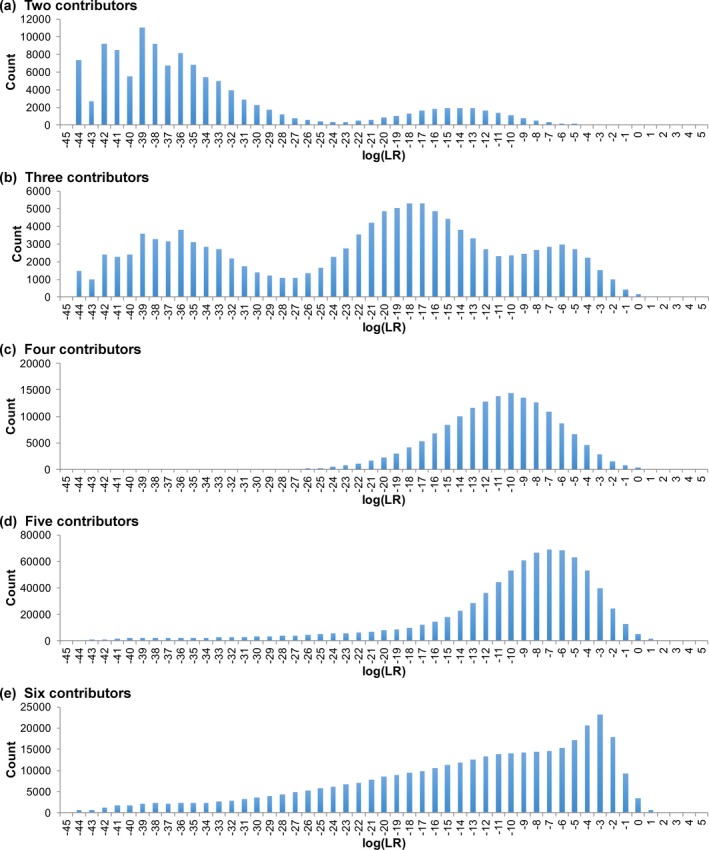
Specificity. Histograms show the log(LR) distribution for comparisons to noncontributors. The horizontal axis gives match statistics as binned log(LR) values. The vertical axis is the number of occurrences for each log(LR) value. The distributions are shown for (a) two through (e) six observed unknown contributors
Right Tail Distribution
The average log(LR) of the noncontributor distribution measured expected specificity. Far to the right of this noncontributor average, positive log(LR) outliers formed a forensically relevant tail distribution (Table S2a). The right tail’s 99.99 percentile increased from −1.46 ban for two contributors, to 2.45 ban for six contributors, showing some dependence on contributor number.
Positive Match Support
More contributors to a mixture generally produced more noncontributor positives (Table 3). The frequency and magnitude of noncontributor positive log(LR) events increased with contributor number. With two contributors, there was one noncontributor positive event, having a value under 1 ban. With three or four contributors, log(LR) remained under 4 ban. One five‐contributor mixture gave a value over 5 ban. With five or six contributors, a positive noncontributor occurred 1% of the time.
Table 3.
Specificity.
| log(LR) | Observed Contributor Number | ||||
|---|---|---|---|---|---|
| 2 | 3 | 4 | 5 | 6 | |
| Comparisons | 120,000 | 120,000 | 160,000 | 800,000 | 360,000 |
| 0 | 1 | 180 | 344 | 5297 | 3364 |
| 1 | 0 | 54 | 113 | 1747 | 750 |
| 2 | 0 | 14 | 33 | 326 | 94 |
| 3 | 0 | 2 | 11 | 39 | 10 |
| 4 | 0 | 0 | 0 | 16 | 1 |
| 5 | 0 | 0 | 0 | 1 | 0 |
| Total | 1 | 250 | 501 | 7426 | 4219 |
Noncontributor positive events are counted for different match strengths and contributor numbers. When evidence genotypes were compared with noncontributor genotypes, noncontributor positive events were seen. The first table column shows log(LR) bin values, while the following columns are for different numbers of observed contributors. In each log(LR) row, table entries count the number of noncontributor positive events.
Probability of Misleading Evidence
Conditioned on a match statistic, the probability of misleading evidence (PME) for uncertain genotypes gave the chance that a noncontributor had a match statistic at least as large as the one observed 35, 36. While the chance of a positive noncontributor log(LR) was 1% for five or six contributors, the PME dropped to 0.05% with log(LR) over 2 ban (Table S2b). The PME became quite small as LR increased.
PME generally increased with more contributors (Table S2b). There were no log(LR) values over 3 ban for two‐contributor mixtures. PME increased to 0.000031 (one in 30,000 comparisons) with six contributors. The PME provided a frequency context for assessing match error beyond a given log(LR) value.
Reproducibility
Contributors Increase Variation
Match statistic variation increased with more contributors, with more dispersion seen in replicate computer runs (Fig. 4). The within‐group standard deviation σw quantified the log(LR) variation in independent computer runs (Table S1a). Two‐contributor mixtures gave highly reproducible results (σw = 0.17 ban). Variation increased with more contributors, reaching its largest value at six contributors (σw = 1.00 ban).
Figure 4.
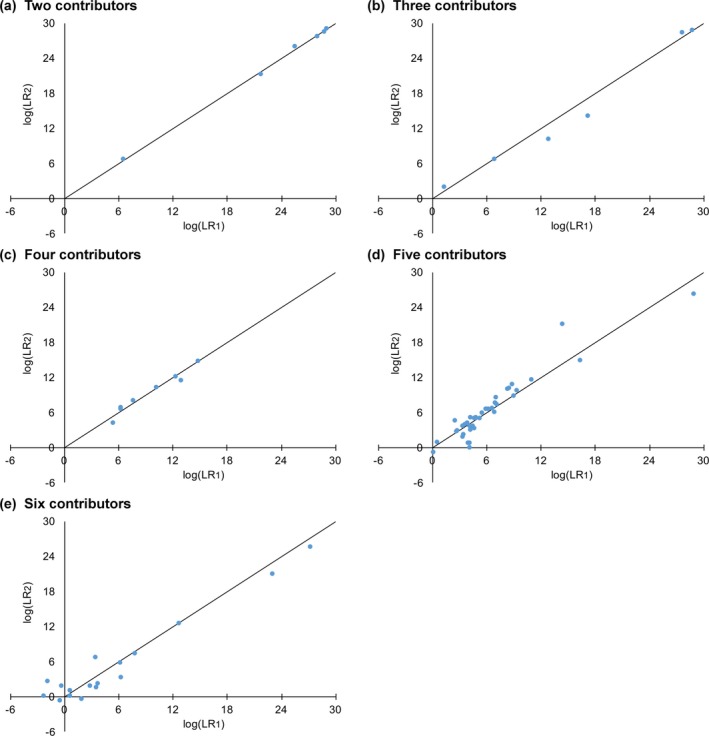
Reproducibility. Horizontal and vertical axes show match statistics for true contributor comparisons. Each point is a pair of log(LR) values from two separate Cybergenetics computer runs. Black lines represent equal values in replicate runs. The graphs are shown for (a) two through (e) six observed unknown contributors
Relation to LR Magnitude
Reproducibility improved with match strength. Larger log(LR) values had less variation, with replicate pairs lying closer to the equality line (Fig. 4, black line). Smaller log(LR) values showed more dispersion, which became more apparent with more contributors (Fig. 4 d,e).
Independent Analysis
Cybergenetics and the CCRFSL independently operated TrueAllele on the same mixture data. Both groups found an average log(LR) of 8 ban (Table 4), ranging from about −9 to 29 ban. The overall σw of replicate log(LR) values (one per group for each comparison) between these two independent groups was 0.70 ban, comparable to the replicate σw variation of 0.83 ban produced by the Cybergenetics group.
Table 4.
Independent analysis.
| Operator Site | ||
|---|---|---|
| Cybergenetics | CCRFSL | |
| Genotypes | 78 | 78 |
| Minimum | −5.16 | −9.14 |
| Mean | 8.36 | 8.48 |
| Median | 5.98 | 5.61 |
| Maximum | 29.03 | 29.12 |
| SD | 8.37 | 8.54 |
| σw | 0.70 | |
How independently running the software by operators located at different sites affects the contributor distribution. Summary statistics show center, spread, and extreme values. Within‐group standard deviation shows the difference between log(LR) values, one replicate from each group. The mixture samples were processed using observed contributor number.
Quantity
The total DNA amount was divided between the contributors to a sample. Therefore, more contributors decreased the average amount of DNA per contributor. The minor component of a two‐person mixture could contain more DNA than the major component of a five‐person mixture. For example, the minor contributor in two‐contributor sample 2‐2 had 170 picograms (pg) of DNA, whereas the major contributor in seven‐contributor sample 7‐2 had only 105 pg (Table 1).
Contributors Divide the Sample
The amount of DNA per contributor generally decreased as contributor number increased (Fig. 5). Two‐ and three‐person mixture contributors spanned the full 25 to 470 pg range, averaging 205 pg (Table 1). But with four or more contributors, the DNA amount averaged only 90 pg and was largely in the 25 pg to 150 pg range.
Figure 5.
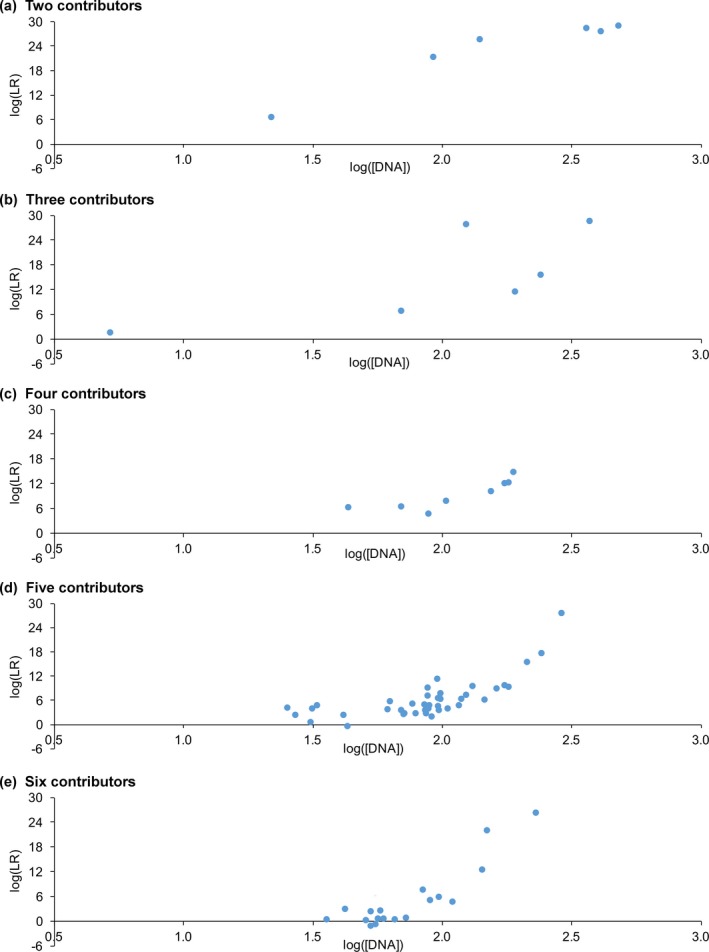
DNA amount. Plots show how match statistics depend on DNA amount for different numbers of contributors. The horizontal axis gives the logarithm of DNA contributor amount (picograms). The vertical axis shows log(LR) match statistics. The plots are shown for (a) two through (e) six observed unknown contributors
Sensitivity Improvement
Contributors comprising more DNA generally yielded larger match statistics (Fig. 5). The relationship between DNA amount and match strength was linear with constant slope, regardless of contributor number 29. Deviations from linearity were due to similar contributor amounts, which reduced inferred genotype information and depressed match statistics 20. Beyond 250 pg, match strength plateaued, giving log(LR) values between 27 ban and 29 ban for definite genotypes (Fig. 5).
Four‐contributor maximum log(LR) dipped to 15 ban due to the limited range of DNA amounts in these mixtures, which was at most 190 pg. The largest amount of DNA for other contributor numbers generally exceeded 250 pg (Fig. 5).
Average log(LR) decreased when there was less DNA (Table 5, sensitivity column). DNA amounts over 250 pg averaged 28 ban. Under 50 pg, average log(LR) fell to 3 ban. Contributor negative values came from low‐level minor genotypes. 92% of comparisons to true contributors gave positive log(LR) values. Over 100 pg, all log(LR) values were positive.
Table 5.
DNA amount.
| DNA amount (pg) | Sensitivity | Specificity | Reproducibility | ||
|---|---|---|---|---|---|
| Mean log(LR) | Positive log(LR) values (%) | Mean log(LR) | Negative log(LR) values (%) | σw | |
| 0–50 | 3.00 | 91.67 | −6.97 | 98.35 | 0.76 |
| 50–100 | 4.60 | 94.59 | −9.25 | 98.87 | 0.78 |
| 100–150 | 11.59 | 100 | −12.91 | 99.58 | 0.58 |
| 150–250 | 13.70 | 100 | −20.66 | 99.98 | 1.26 |
| 250–500 | 28.34 | 100 | −38.15 | 100 | 0.59 |
Measures of genotype information (columns) are shown for different DNA amounts (rows). Means and true outcome percentages are provided for sensitivity and specificity metrics. Within‐group standard deviations are shown for reproducibility.
With more contributors, less DNA was apportioned to each one. This DNA reduction decreased average sensitivity (Fig. 2 and Table S1). Unlike maximum value, mean log(LR) decreased with additional minor contributors.
Specificity Improvement
The eight samples observed to contain five contributors yielded the most (forty) genotypes (Table 1). The five‐contributor specificity distribution encompassed the largest range of log(LR) values, −44 to 5 ban (Table S2a). On this genotype subset, specificity increased with contributor DNA amount. Noncontributor log(LR) averaged −6 ban for DNA amounts under 25 pg (Fig. 6 a). Over 250 pg, average log(LR) decreased to −38 ban (Fig. 6 e). Specificity shifted leftward, toward more exclusionary values for contributors with more DNA.
Figure 6.
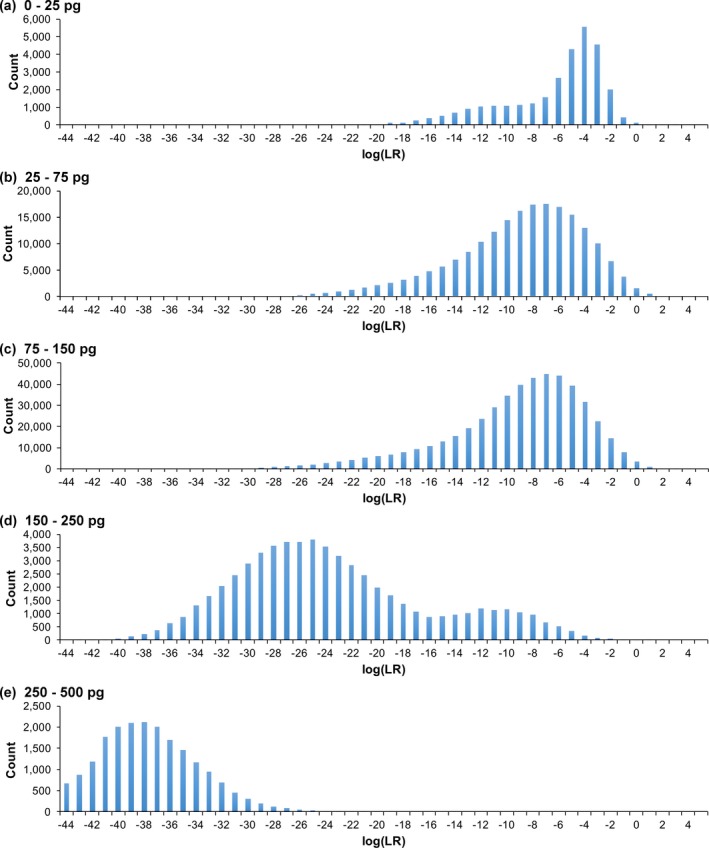
DNA amount specificity. Each histogram shows the frequency distributions for comparisons to noncontributors. Results are for five‐contributor mixtures, grouped by DNA amounts ranging from (a) under 25 pg to (e) over 250 pg
DNA amount affected the noncontributor tail distribution (Table S3a). The 99.99 percentile was 2.6 ban for under 25 pg of DNA, but −19.9 ban when over 250 pg. Maximum log(LR) decreased from 3 ban to −20 ban across these DNA levels.
The number of noncontributor positive log(LR) values showed how specificity depended on DNA amount (Table S3b). No noncontributor positive values occurred for DNA amounts over 250 pg. More positive log(LR) events were seen with less DNA over a broader range. Between 150 and 250 pg, noncontributor positive values were under 2 ban. Under 150 pg, noncontributor log(LR) positives reached 5 ban.
Cumulative noncontributor tail probability decreased with increased template DNA (Table S3c). Under 25 pg, the probability of noncontributor positive log(LR) was 0.0065. Over 250 pg, no false‐positive events were seen.
Amount versus Contributors
DNA amount explained genotype specificity better than did contributor number. The log(LR) specificity distribution for major contributors (≥250 pg) from five‐person mixtures centered around –37 ban (Fig. 6 e), comparable to two‐person mixtures, which averaged −33 ban (Fig. 3 a). Percentile values showed major contributors from five‐person mixtures having greater specificity than for two‐person mixtures, at −19.9 ban (Table S3a) and −1.46 ban (Table S2a), respectively. Considering all contributor numbers, specificity similarly increased with more DNA (Table 5, specificity column).
These observations are consistent with the linear relationship between log(LR) match information and DNA quantity. A validation specificity distribution is the average of its component probabilistic genotype specificity distributions 36. Therefore, DNA amount determines the log(LR) distribution’s center, while genotype uncertainty sets the distribution’s spread.
Mixtures having more contributors spawned more low‐level minor components (Table 1) to populate specificity distributions. Since genotype specificity decreased with DNA amount, having proportionately more minors decreased specificity (Table 5).
Reproducibility Improvement
As contributor DNA amount increased, reproducibility improved from a σw of 0.76 ban to 0.59 ban (Table 5, reproducibility column). The relative σw/log(LR) variation steadily decreased as well, from 0.25 to 0.02. The major genotype split in a duplicate run for mixture 6‐1; this reduced log(LR) from 21.07 to 14.34 ban, which elevated σw to 1.26 ban in the 150–250 pg range.
Assumptions
Contributors
The observed number of contributors differed from the study design (Table 1). While there were only two samples in each designed contributor group, there could be greater or fewer samples in an observed contributor group. For example, three samples were processed in the two‐observed‐contributor group, producing six genotypes (Fig. 2, Tables 2 and S1).
As contributor number increased, so too did the variation in the estimated number of contributors. The analyst’s observed contributor number did not exceed the designed number (Table 1, rows Des and Obs). For mixtures with up to six designed contributors, the observed number differed from designed by at most one. The difference between designed and observed numbers increased along with the designed number. Cybergenetics and CCRFSL consistently agreed on the number of observed contributors until there were eight or more designed contributors (Table 2).
Varying the number of assumed contributors did not affect overall sensitivity. True contributor log(LR) values were similar under different contributor number assumptions (data not shown). There were four outliers at higher match strength, with designed log(LR) values less than observed; due to excess assumed designed contributors, three major genotypes had split into less definite genotypes, giving lower inclusionary log(LR) values.
The average log(LR) value was about 7 ban for both sensitivity distributions. The difference between observed and designed contributor assumptions affected the minimum, median, and maximum values by less than one log unit (Table S4a). With a Kolmogorov–Smirnov test statistic of 0.1613, a p‐value of 0.37 showed no significant difference between sensitivity distributions (Table S4b). On average, match statistics from observed and designed contributor groups varied with a σw of 1.39 ban.
With more designed than observed contributors, the extra assumed contributors gave more inferred genotypes. However, these excess genotypes were generally uninformative, since (as observed in the EPG) they had little support in the STR data. This surplus was especially noticeable in the −10 to 0 ban range (Fig. 7). The contributor number assumption did not materially change the overall specificity distribution (Table S5a). For both designed and contributor numbers, the minimum log(LR) was –44 ban, and the maximum was about 5 ban.
Figure 7.
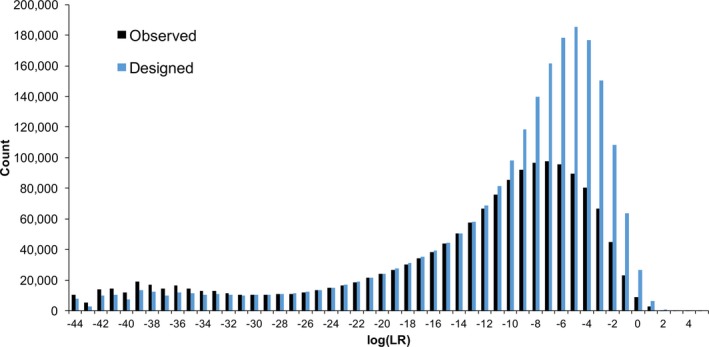
Contributor specificity. The histograms show the distribution of log(LR) match statistics for comparisons to noncontributors from computer processing using observed (black) and designed (blue) contributor number approaches. Fewer genotypes were inferred under observed contributor number assumptions (156) than with designed contributor numbers (216), leading to fewer observed (1,560,000) than designed (2,160,000) comparisons
Assuming the designed instead of observed contributor number yielded excess noncontributor positive log(LR) values. Positive counts increased from about 12,000 to 34,000 (Table 6). The excess genotypes had log(LR) values mainly between 0 and 2 ban. Beyond 3 ban, the noncontributor positive cumulative probability was essentially the same under different contributor number assumptions (Table S5b).
Table 6.
Contributors specificity.
| log(LR) | Observed | Designed |
|---|---|---|
| Comparisons | 1,560,000 | 2,160,000 |
| 0 | 9186 | 26,772 |
| 1 | 2664 | 6498 |
| 2 | 467 | 966 |
| 3 | 62 | 94 |
| 4 | 17 | 16 |
| 5 | 1 | 0 |
| Total | 12,397 | 34,346 |
Counting positive‐valued events for noncontributor log(LR) distributions. Results are shown when assuming either an observed or designed number of contributors. The positive counts are binned by integer log(LR) value.
Peeling
The genotype peeling method was applied to a ten‐contributor mixture (Table 7). The log(LR) values of minor contributors were generally larger when peeling with known genotypes. For example, the 15% minor contributor initially had a log(LR) of 3 ban (Table 7, row 15%). Following peeling, the match statistic had become a more informative 8 ban.
Table 7.
Peeling sensitivity.
| Mixture weight (%) | Peeling Round | ||||||
|---|---|---|---|---|---|---|---|
| 0 | 1 | 2 | 3 | 4 | 5 | 6 | |
| 13 | 7 | K | K | K | K | K | K |
| 22 | 6 | 7 | K | K | K | K | K |
| 12 | 5 | 4 | 5 | K | K | K | K |
| 16 | 4 | 4 | 5 | 6 | K | K | K |
| 13 | 4 | 3 | 2 | 1 | 6 | K | K |
| 15 | 3 | 3 | 4 | 1 | 6 | 8 | K |
| 2 | 1 | 1 | 1 | 1 | 3 | 3 | 4 |
| 2 | 0 | 2 | 2 | 3 | 2 | 3 | 4 |
| 4 | 0 | 1 | 1 | 1 | 2 | 0 | 2 |
| 1 | 0 | 0 | 0 | 0 | −1 | −1 | 0 |
Match statistic progression with successive rounds of genotype peeling for sample 10‐2. Contributor mixture weight (first column), as inferred by computer modeling, is shown as a percentage of total DNA amount (rows). Each rightward moving column represents the next round of peeling. Table entries show contributor comparison log(LR) values, rounded to the nearest integer. A “K” indicates that a contributor’s genotype was assumed as known in that peeling round.
Peeling improved average specificity of inferred genotypes. Without peeling, the noncontributor distribution of the ten‐person mixture was centered around a log(LR) of −3 ban (Fig. 8). This lower specificity reflected more contributors with small DNA amounts (Fig. 6 a). Peeling on the same DNA mixture data yielded more exclusionary log(LR) values (Fig. 8). Genotype peeling reduced exclusionary match statistics by about 3 ban, and minimum log(LR) by 16 ban (Table S6a). This use of known genotypes also reduced the number of noncontributor positives two‐fold (Table 8) and their cumulative probability (Table S6b).
Figure 8.
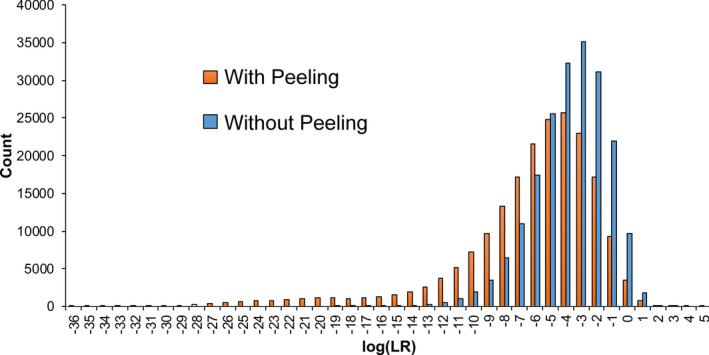
Peeling specificity. The histograms show log(LR) frequency distributions for genotype comparisons to noncontributors. The genotypes were inferred, both with (orange) and without (blue) peeling, from ten‐contributor sample 10‐2.
Table 8.
Peeling specificity.
| log(LR) | Without Peeling | With Peeling |
|---|---|---|
| Comparisons | 200,000 | 200,000 |
| 0 | 9693 | 3480 |
| 1 | 1752 | 787 |
| 2 | 179 | 85 |
| 3 | 9 | 21 |
| 4 | 0 | 4 |
| 5 | 0 | 2 |
| Total | 11,633 | 4379 |
Noncontributor positive log(LR) comparison events, both with and without peeling. Rows show positive log(LR) counts binned by integer log(LR) value.
Early peeling rounds found sharpened evidence genotypes corresponding to true contributors. Once these genotypes had largely accounted for the data, later peeling rounds were less informative, producing less focused genotypes. These minor genotypes (mixture weights under 5%) from residual data showed less specificity, producing more false log(LR) positives over 3 ban. Without peeling, however, inferred genotypes were more similar, less separated, and less informative.
Sampling
With few contributors, MCMC sampling cycles had little effect on the match statistic. From 5K through 100K cycles, log(LR) for the minor and major contributor of a two‐person mixture were consistently 21 ban and 27 ban, respectively (Fig. 9 a). With more contributors, sampling under 25K cycles showed more variation (Fig. 9). Beyond 25K cycles, match statistics remained consistent.
Figure 9.
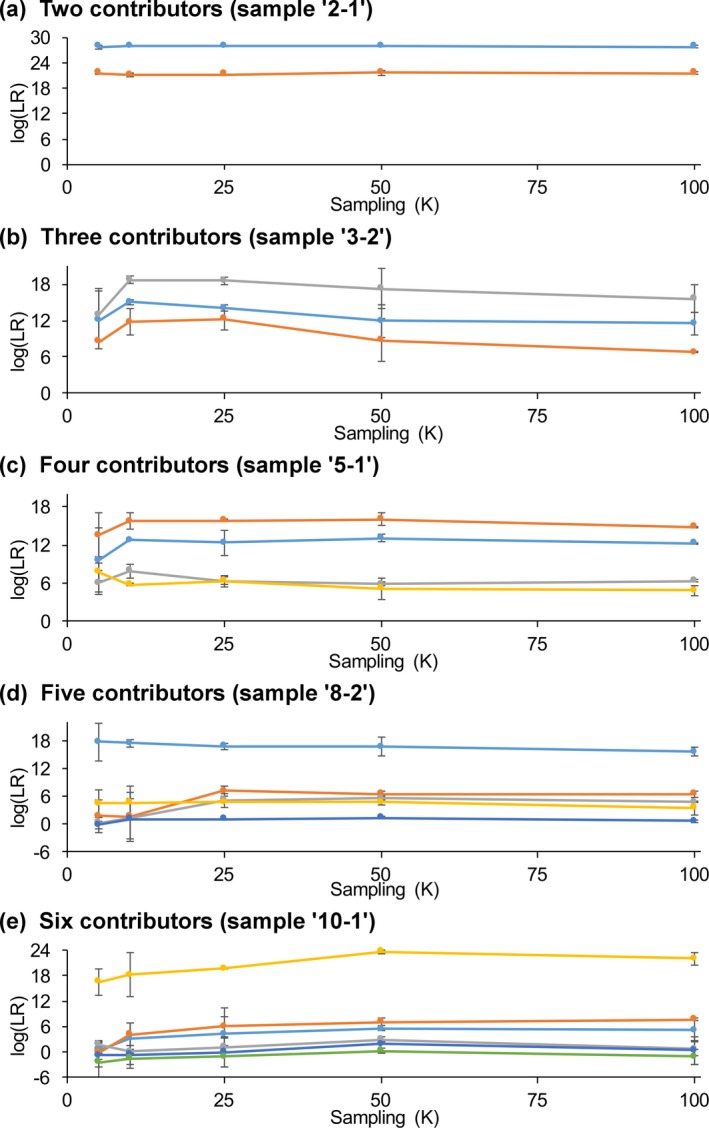
Sampling. Plots show the influence of sampling on match statistics for true contributors of mixtures with (a) two through (e) six contributors. In a plot, each true contributor’s colored line shows its average log(LR) values at different sampling times. Vertical error bars express standard deviations between replicate computer runs
For example, the orange contributor line of Fig. 9 e showed log(LR) values ranging from 0 ban to 6 ban for sampling between 5K and 25K cycles. Beyond 25K cycles, the line stayed constant at 7 ban. The average log(LR) value for 50K sampling was consistently within 1 log unit of the average log(LR) for 100K sampling (Table S7).
Abundant contributor DNA yielded larger log(LR) values, showing little dependence on sampling time. Match statistics for these contributors were relatively constant between 5K and 100K cycles, regardless of contributor number. For example, a five‐person mixture major contributor had a log(LR) of 17 ban that remained within 2 ban when sampling from 5K to 100K cycles (Fig. 9 d, light blue line). Large match values were relatively unchanged from 5K through 100K sampling (Fig. 9).
Sampling had greater impact on contributors having less DNA. Initially low log(LR) values from 5K sampling increased when additional sampling was conducted. For example, a mixture with five (observed) contributors showed 1 ban with 5K sampling; going beyond 10K cycles increased the statistic to 5 ban.
Sensitivity distributions were developed for five‐observed‐contributor mixtures. More sampling reduced contributor negative log(LR) results. With 5K sampling, five comparisons produced negative log(LR) values (Fig. 10 a). Beyond 5K sampling, just one of those five comparisons gave a negative log(LR).
Figure 10.
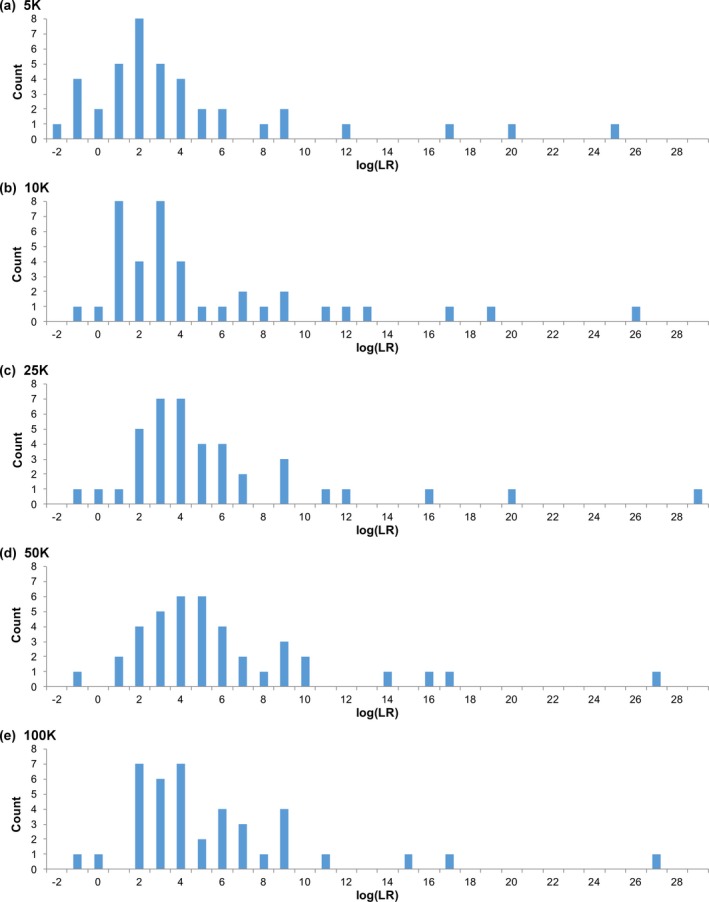
Sampling sensitivity. Histograms show sensitivity distributions for mixtures having five observed contributors. The charts show the results for varying sampling from (a) 5K through (e) 100K cycles
Specificity distributions were developed for mixtures having five observed contributors. Increasing sampling from 5K to 25K reduced genotype specificity (Table 9) by more thoroughly exploring the posterior genotype distribution; probability was diffused over more allele pair possibilities, lowering match strength. More sampling time was needed to observe these less probable allele pair events. Figure 11 shows that average specificity shifted rightward from −17 ban (5K sampling) to −11 ban (25K sampling). Noncontributor positive cumulative probability was less dependent on sampling, yielding relatively constant 99.99 percentile values (Table S8a).
Table 9.
Sampling specificity.
| Sampling Time (thousands of cycles) | |||||
|---|---|---|---|---|---|
| log(LR) | 5K | 10K | 25K | 50K | 100K |
| 0 | 1139 | 1698 | 3801 | 2896 | 2689 |
| 1 | 351 | 461 | 924 | 944 | 849 |
| 2 | 45 | 77 | 143 | 186 | 161 |
| 3 | 7 | 6 | 17 | 19 | 21 |
| 4 | 0 | 0 | 3 | 3 | 9 |
| 5 | 0 | 0 | 0 | 1 | 0 |
| Total | 1542 | 2242 | 4888 | 4049 | 3729 |
The effect of sampling duration on positive log(LR) right‐tail events in the noncontributor distribution. Positive log(LR) events are binned by integer log(LR) value (left column). Results are shown for 400,000 noncontributor comparisons, using mixture genotypes inferred assuming five observed contributors.
Figure 11.
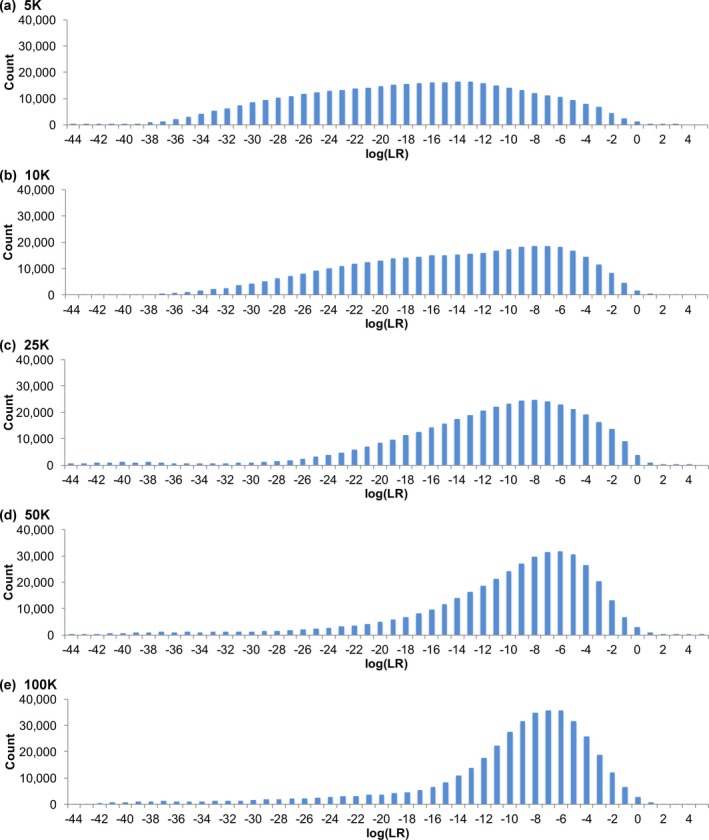
Sampling specificity. Histograms show match statistic distributions for comparison to noncontributors with MCMC sampling ranging from (a) 5K through (e) 100K cycles for mixtures of five observed unknown contributors
Regardless of contributor number, more sampling increased match statistic reproducibility (Table 10). Additional sampling improved reproducibility for mixtures containing more contributors, as measured by within‐group variation σw. At 100K sampling, σw was 1 ban or less, regardless of the number of contributors.
Table 10.
Sampling reproducibility.
| Contributors | Sampling Time (thousands of cycles) | ||||
|---|---|---|---|---|---|
| 5K | 10K | 25K | 50K | 100K | |
| 2 | 0.68 | 0.65 | 0.08 | 0.51 | 0.17 |
| 3 | 4.82 | 0.82 | 0.67 | 1.61 | 0.88 |
| 4 | 2.02 | 2.42 | 2.13 | 0.84 | 0.36 |
| 5 | 1.74 | 1.59 | 0.76 | 0.59 | 0.87 |
| 6 | 1.81 | 2.28 | 1.67 | 0.98 | 1.00 |
For each observed contributor number (rows), the effect of sampling duration (columns) on reproducibility is summarized. Reproducibility is measured as the within‐group standard deviation (σw) of log(LR) results between replicate computer runs.
Peaks
Sensitivity was largely unaffected by peak limit. Comparing sensitivity at a locus limit of 10 or 20 data peaks, log(LR) averages were within 0.1 ban, regardless of contributor number (Table 11). Overall σw was 0.71 ban. This small variation was comparable to routine processing (without peeling), where σw ranged from 0.17 ban to 0.87 ban (Table S1a). Since TrueAllele models baseline noise, additional nonallelic peaks did not materially affect genotype or LR results.
Table 11.
Peaks sensitivity.
| Contributors | Number of Peaks | |||
|---|---|---|---|---|
| 10 | 20 | |||
| Mean | SD | Mean | SD | |
| 2 | 23.50 | 8.37 | 23.43 | 8.48 |
| 3 | 17.15 | 10.58 | 17.15 | 10.63 |
| 4 | 8.49 | 4.56 | 8.55 | 5.39 |
| 5 | 6.33 | 5.55 | 6.40 | 5.66 |
For each observed contributor number (rows), the effect of peak limit (columns) on contributor distribution is summarized. The log(LR) statistical measures are distribution mean and standard deviation (SD).
Conclusion
Mixtures combine the DNA of different people into one biological sample. The interpretation task is to un‐mix the biological data and to determine the genotype of each contributor. That inverse problem, recovering input genotypes from output data, is difficult for human analysts, but can be accomplished using modern statistical computing to solve a mathematical model.
A Bayesian probability framework makes few assumptions and derives parameters of interest directly from the evidence data. Parameter uncertainty is represented through probability. A key variable of interest is the genotype of each contributor, described as a probability distribution at each locus over all possible allele pairs. The ratio of posterior genotype probability (after having seen data) to prior probability (before observing data) is the LR, used in forensic science to assess association strength between two biological items. The LR logarithm is a standard measure of information.
The DNA match statistic (i.e., the LR) is the final common pathway of forensic identification, regardless of calculation method. The number can statistically include or exclude people from a mixture and is used in court to summarize match strength. The log(LR) forms the basis of forensic validation 18, 22, reducing genotype comparison information to a single value.
Separated genotypes follow a predictive empirical law. When compared with a person’s genotype, their log(LR) match information is proportional to the logarithmic amount of DNA contributed by the person 20, 29 until a maximum LR is reached. A well‐understood deviation is that equal contributor amounts lower LR values 20. The study measured sensitivity, specificity, and reproducibility using log(LR), and the metrics all obeyed this linear law. The results were consistent with a linear relationship between DNA amount and identification information.
The data showed that contributor DNA quantity determines mixture information and its variability. The 2016 President’s Council of Advisors on Science and Technology (PCAST) policy report suggested limiting DNA mixture usage based on contributor number and mixture weight 37. Our empirical validation study underscores why this forensic policy proposal is scientifically unfounded:
The number of contributors, and their relative weight in a mixture, are merely factors affecting contributor DNA quantity—the main independent variable.
The linear relationship between DNA quantity and match information provides a useful predictive theory that explains match strength.
Mixture interpretation validation studies demonstrate a continuum of predictable match information (from none to all). There is no scientific evidence supporting PCAST’s proposal to impose arbitrary limits.
While virtually all of TrueAllele’s Bayesian model parameters are derived from DNA evidence data, the system does have some user settable parameters. The study measured the impact of these inputs on match information. It found that assuming a sufficient number of contributors to explain the data gave reliable results. Supplying known contributors could provide additional genotype data that sharpened match association. Sampling for twenty‐five thousand MCMC cycles generally sufficed. Moreover, considering excess data peaks had minimal impact on the answer.
An interesting finding involved the number of observed contributors empirically estimated from the STR data. When assuming this empirical number, genotypes faithfully represented the data. By contrast, a larger experimental design number gave excess uninformative contributors. Many mixtures contain DNA contributors that are imperceptible in STR data. Bayesian reasoning is based on the data we have, not on desired meta‐knowledge we lack. This finding lets users confidently operate the system when assuming a contributor number estimated from observed data.
Many validation studies are based on laboratory‐generated samples, rather than casework items. However, the study supports interpreting evidence based on data observation, not unknowable facts. A small amount of contributor DNA may suffer allele dropout or imbalance, and so express its genotype unfaithfully—or not at all—in the STR data. The correct inference is a probability distribution that quantifies this genotype uncertainty, independently of what we believe we “know” should be there. Contextual bias can only diminish forensic objectivity 38.
Empirical testing is the basis of scientific 39 and legal 40 reliability. Validation studies can test laboratory‐generated data (as was done here), or casework field data. Both are needed, since methods that excel in the laboratory may fail in the field. For transparency and respect for Sixth Amendment rights, defendants should have an opportunity to test the forensic casework methods and data used against them.
Previous validation studies demonstrated TrueAllele reliability on DNA mixtures containing up to five unknown contributors 29. Empirical testing has been conducted on both laboratory‐generated data 20, 25, 28, 29 and casework field data 9, 26, 27. Thirty additional unpublished studies, including internal laboratory validations, have been documented. This study extends that testing, establishing TrueAllele reliability on mixtures containing up to ten unknown contributors.
Acknowledgement
The authors would like to thank Cuyahoga County Medical Examiner and laboratory Executive Director Dr. Thomas Gilson, and CCRFSL Managing Laboratory Director and Laboratory Quality Manager Dr. Harmeet Kaur, for continued support throughout the study. Duquesne University Forensic Science and Law graduate Erin Monko helped collate the data. Cybergenetics Matthew Legler provided artistic and technical support. Comments from two anonymous reviewers improved the manuscript. Cybergenetics TrueAllele® technology is protected by patents US 6,807,490; US 8,898,021; US 9,708,642; and EPO 1,229,135.
Conflict of Interest
Cybergenetics makes and sells the TrueAllele® computer system. Both Cybergenetics and the Cuyahoga Laboratory use the system in forensic casework. Dr. Mark Perlin is an owner and officer of Cybergenetics.
Supporting information
Table S1 . Sensitivity and reproducibility.
Table S2 . Specificity.
Table S3 . DNA amount specificity.
Table S4 . Contributors sensitivity.
Table S5 . Contributors specificity.
Table S6 . Peeling specificity.
Table S7 . Sampling sensitivity.
Table S8 . Sampling specificity.
Presented at the 70th Annual Scientific Meeting American Academy of Forensic Sciences, February 19‐24, 2018, in Seattle, WA.
References
- 1. Butler JM. Forensic DNA typing: biology, technology, and genetics of STR markers, 2nd edn New York, NY: Academic Press, 2005. [Google Scholar]
- 2. Mullis KB, Faloona FA, Scharf SJ, Saiki RK, Horn GT, Erlich HA. Specific enzymatic amplification of DNA in vitro: the polymerase chain reaction. Cold Spring Harbor Symp Quant Biol 1986;51(Pt 1):263–73. [DOI] [PubMed] [Google Scholar]
- 3. Weber J, May P. Abundant class of human DNA polymorphisms which can be typed using the polymerase chain reaction. Am J Hum Genet 1989;44(3):388–96. [PMC free article] [PubMed] [Google Scholar]
- 4. Perlin MW. Hidden DNA evidence: exonerating the innocent. Forensic Mag 2018;15(1):10–2. [Google Scholar]
- 5. Scientific Working Group on DNA Analysis Methods (SWGDAM) . Short tandem repeat (STR) interpretation guidelines. Forensic Sci Commun 2000. [Google Scholar]
- 6. Perlin MW. When DNA is not a gold standard: failing to interpret mixture evidence. The Champion 2018;42:50–6. [Google Scholar]
- 7. Perlin MW, Szabady B. Linear mixture analysis: a mathematical approach to resolving mixed DNA samples. J Forensic Sci 2001;46(6):1372–7. [PubMed] [Google Scholar]
- 8. Gelman A, Carlin JB, Stern HS, Rubin D. Bayesian data analysis. Boca Raton, FL: Chapman & Hall/CRC, 1995. [Google Scholar]
- 9. Perlin MW, Legler MM, Spencer CE, Smith JL, Allan WP, Belrose JL, et al. Validating TrueAllele® DNA mixture interpretation. J Forensic Sci 2011;56(6):1430–47. [DOI] [PubMed] [Google Scholar]
- 10. Perlin MW. Identifying human remains using TrueAllele® technology In: Okoye MI, Wecht CH, editors. Forensic investigation and management of mass disasters. Tucson, AZ: Lawyers & Judges Publishing Co, 2007;31–8. [Google Scholar]
- 11. Perlin MW. The Blairsville slaying and the dawn of DNA computing In: Niapas A, editor. Death needs answers: the cold‐blooded murder of Dr John Yelenic. New Kensington, PA: Grelin Press, 2013. [Google Scholar]
- 12. Tvedebrink T, Eriksen PS, Mogensen HS, Morling N. Identifying contributors of DNA mixtures by means of quantitative information of STR typing. J Comput Biol 2012;19(7):887–902. [DOI] [PubMed] [Google Scholar]
- 13. Puch‐Solis R, Rodgers L, Mazumder A, Pope S, Evett I, Curran J, et al. Evaluating forensic DNA profiles using peak heights, allowing for multiple donors, allelic dropout and stutters. Forensic Sci Int Genet 2013;7(5):555–63. [DOI] [PubMed] [Google Scholar]
- 14. Taylor D, Bright J‐A, Buckleton J. The interpretation of single source and mixed DNA profiles. Forensic Sci Int Genet 2013;7(5):516–28. [DOI] [PubMed] [Google Scholar]
- 15. Cowell RG, Graversen T, Lauritzen SL, Mortera J. Analysis of DNA mixtures with artefacts. J R Stat Soc Ser C Appl Stat 2015;64(Pt 1):1–48. [Google Scholar]
- 16. Manabe S, Morimoto C, Hamano Y, Fujimoto S, Tamaki K. Development and validation of open‐source software for DNA mixture interpretation based on a quantitative continuous model. PLoS ONE 2017;12(11):e0188183. [DOI] [PMC free article] [PubMed] [Google Scholar]
- 17. You Y, Balding D. A comparison of software for the evaluation of complex DNA profiles. Forensic Sci Int Genet 2019;40:114–9. [DOI] [PubMed] [Google Scholar]
- 18. Perlin MW. Scientific validation of mixture interpretation methods . Proceedings of Promega's Seventeenth International Symposium on Human Identification; 2006 Oct 10‐12. Nashville, TN. Madison, WI: Promega, 2006. [Google Scholar]
- 19. Good IJ. Probability and the weighing of evidence. London, U.K.: Griffin, 1950. [Google Scholar]
- 20. Perlin MW, Sinelnikov A. An information gap in DNA evidence interpretation. PLoS ONE 2009;4(12):e8327. [DOI] [PMC free article] [PubMed] [Google Scholar]
- 21. Mitchell AA, Tamariz J, O'Connell K, Ducasse N, Budimlija Z, Prinz M, et al. Validation of a DNA mixture statistics tool incorporating allelic drop‐out and drop‐in. Forensic Sci Int Genet 2012;6(6):749–61. [DOI] [PubMed] [Google Scholar]
- 22. Scientific Working Group on DNA Analysis Methods (SWGDAM) . Guidelines for the validation of probabilistic genotyping systems. FBI Laboratory, 2015. https://www.swgdam.org/publications (accessed September 10, 2019).
- 23. Bright JA, Taylor D, McGovern C, Cooper S, Russell L, Abarno D, et al. Developmental validation of STRmix, expert software for the interpretation of forensic DNA profiles. Forensic Sci Int Genet 2016;23:226–39. [DOI] [PubMed] [Google Scholar]
- 24. Kadash K, Kozlowski BE, Biega LA, Duceman BW. Validation study of the TrueAllele® automated data review system. J Forensic Sci 2004;49(4):660–7. [PubMed] [Google Scholar]
- 25. Ballantyne J, Hanson EK, Perlin MW. DNA mixture genotyping by probabilistic computer interpretation of binomially‐sampled laser captured cell populations: combining quantitative data for greater identification information. Sci Justice 2013;53(2):103–14. [DOI] [PubMed] [Google Scholar]
- 26. Perlin MW, Belrose JL, Duceman BW. New York State TrueAllele® casework validation study. J Forensic Sci 2013;58(6):1458–66. [DOI] [PMC free article] [PubMed] [Google Scholar]
- 27. Perlin MW, Dormer K, Hornyak J, Schiermeier‐Wood L, Greenspoon S. TrueAllele® casework on Virginia DNA mixture evidence: computer and manual interpretation in 72 reported criminal cases. PLoS ONE 2014;9(3):e92837. [DOI] [PMC free article] [PubMed] [Google Scholar]
- 28. Greenspoon SA, Schiermeier‐Wood L, Jenkins BA. Establishing the limits of TrueAllele® casework: a validation study. J Forensic Sci 2015;60(5):1263–76. [DOI] [PubMed] [Google Scholar]
- 29. Perlin MW, Hornyak J, Sugimoto G, Miller K. TrueAllele® genotype identification on DNA mixtures containing up to five unknown contributors. J Forensic Sci 2015;60(4):857–68. [DOI] [PubMed] [Google Scholar]
- 30. Metropolis N, Rosenbluth AW, Rosenbluth MN, Teller AH, Teller E. Equation of state calculations by fast computing machines. J Chem Phys 1953;21(6):1087–92. [Google Scholar]
- 31. Good IJ. Studies in the history of probability and statistics. XXXVII. A.M. Turing’s statistical work in World War II. Biometrika 1979;66(2):393–6. [Google Scholar]
- 32. Stolovitzky G, Cecchi G. Efficiency of DNA replication in the polymerase chain reaction. Proc Natl Acad Sci USA 1996;93(23):12947–52. [DOI] [PMC free article] [PubMed] [Google Scholar]
- 33. Hill CR, Duewer DL, Kline MC, Coble MD, Butler JM. US population data for 29 autosomal STR loci. Forensic Sci Int Genet 2013;7(3):e82–3. [DOI] [PubMed] [Google Scholar]
- 34. Saunokonoko M. DNA tests changing criminal trials. The Saturday Paper, 2017. https://www.thesaturdaypaper.com.au/news/law-crime/2017/06/17/dna-tests-changing-criminal-trials/14976216004797 (accessed September 10, 2019).
- 35. Royall R. On the probability of observing misleading evidence. J Am Stat Assoc 2000;95(451):760–8. [Google Scholar]
- 36. Perlin MW. Efficient construction of match strength distributions for uncertain multi‐locus genotypes. Heliyon 2018;4(10):e00824. [DOI] [PMC free article] [PubMed] [Google Scholar]
- 37. President's Council of Advisors on Science and Technology (PCAST) . Forensic science in criminal courts: ensuring scientific validity of feature‐comparison methods. Washington, DC: Executive Office of the President, 2016. [Google Scholar]
- 38. Dror IE, Hampikian G. Subjectivity and bias in forensic DNA mixture interpretation. Sci Justice 2011;51(4):204–8. [DOI] [PubMed] [Google Scholar]
- 39. Bacon F. Novum organum scientiarum. London, U.K.: John Bill, 1620. [Google Scholar]
- 40. Daubert v. Merrill Dow Pharmaceuticals, Inc., 509 U.S. 579 (1993).
Associated Data
This section collects any data citations, data availability statements, or supplementary materials included in this article.
Supplementary Materials
Table S1 . Sensitivity and reproducibility.
Table S2 . Specificity.
Table S3 . DNA amount specificity.
Table S4 . Contributors sensitivity.
Table S5 . Contributors specificity.
Table S6 . Peeling specificity.
Table S7 . Sampling sensitivity.
Table S8 . Sampling specificity.


