Abstract
Purpose
To explore the feasibility of performing rapid prenatal diagnoses of FSHD1 using a combination of Bianano optical mapping and linkage‐based karyomapping.
Methods
DNA specimens from a family that had been previously diagnosed with FSHD1 using Southern Blot analysis were used for this study. Genetic diagnosis of the proband, fetus chorionic amniotic fluid, and aborted fetal tissue was performed using Bianano optical mapping (BOM) together with linkage‐based karyomapping.
Results
BOM analysis showed that the proband's 4q35.2 region contained four D4Z4 repeats and the 4qA permissible allele, consistent with the previous FSHD1 diagnosis obtained by Southern Blotting. BOM analysis of the fetus' 4q35.2 region was consistent with that of the proband. Karyomap analysis revealed that the fetus inherited the affected chromosome segment from the proband. After genetic counseling, the couple choose termination of pregnancy, and we performed gene diagnosis of the abortus tissue by BOM.
Conclusions
Bianano optical mapping can determine the number of D4Z4 repeats and exclude interference of the 10q26.3 homologous region, and in combination with karyomapping, can be used for rapid and accurate prenatal diagnosis of FSHD1.
What's already known about this topic?
FSHD is inherited as an autosomal dominant disease. And the causative genetic defect in FSHD is the loss of transcriptional repression of the Double Homeobox Protein 4 (DUX4) gene present in each repeat of the macrosatellite array (D4Z4) at chromosome 4q35. FSHD is not fatal disease, but there is no effective treatment. The traditional genetic method of FSHD diagnosis is by pulse field gel electrophoresis and Southern Blot which is a lengthy procedure.
What does this study add?
In this study, we explored the approach of combining Bionano optical mapping with Karyomapping as new strategy for prenatal diagnosis for rapid and accurate prenatal diagnosis of family FSHD1.
1. INTRODUCTION
Facioscapulohumeral Muscular Dystrophy (FSHD; MIM 158900; MIM 158901) is a common form of inherited human myopathy, with an estimated prevalence of 1:20,0001, presenting typically before age 20, with progressive weakness of the muscles of the face, shoulders and upper arms 2. FSHD is inherited as an autosomal dominant disease, due to a genetic deletion in chromosomal region 4q35. It can be divided into two types: FSHD1 and FSHD2 according to the underlying genetics. The current consensus is that the causative genetic defect in FSHD is the loss of transcriptional repression of the Double Homeobox Protein 4 (DUX4) gene present in each repeat of the macrosatellite array (D4Z4) at chromosome 4q35 3.
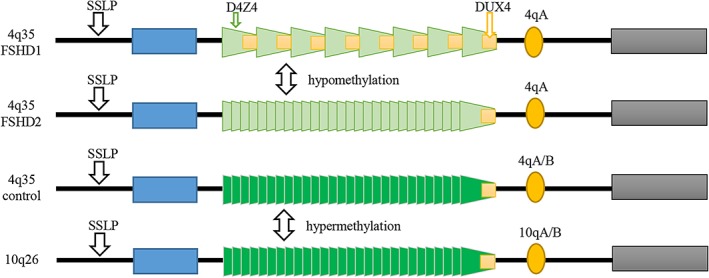
FSHD1 is more frequent (~ 95% of cases). The majority of FSHD1 patients (70‐90%) inherit the deletion from one parent (50% risk of inheriting), a significant number (10‐30%) of cases are due to de novo mutations. FSHD1 is characterized by: 1) variable length deletions of 3.3 Kb (D4Z4) repeated elements at chromosomal region 4q35. Normally people have 11‐100 repeats; but most FSHD patients have 1‐10 repeats; 2) disease‐linked 4qA allele in 4q35 subtelomere; 3) hypomethylation of D4Z4 repeats. FSHD2 (about 5% of cases) is usually caused by mutations at the SMCHD1 (Structural Maintenance of Chromosomes Hinge Domain 1 gene, on chromosome 18p11.32) or DNMT3B gene which also leads to the hypomethylation of D4Z4 repeats 4. Both of FSHD1 and FSHD2 cause misexpression of the double homeobox 4 (DUX4) and subsequently the toxic protein (Figure 1).
Figure 1.

Schematic representation of the pathogenesis in FSHD. The normal allele normally has 11‐100 repeats of D4Z4 (represented by trapezoids) which is contracted to less than 10 units in FSHD1. There is no evidence of pathological change of D4Z4 repeats but there is hypomethylation of chromosome 4 in FSHD2
FSHD is not fatal disease, but there is no effective treatment. And it presents with clinical heterogeneity and continual aggravation, so that patients and their families bear a huge psychological burden. Most families wish to perform prenatal diagnosis. The traditional genetic method of FSHD diagnosis is by pulse field gel electrophoresis (PFGE) and Southern Blot which 5, 6 is process‐complicated, labor‐ and time‐intensive, needs a large quantity of high quality DNA, and can't ccurately recognize critical length 6, 7. These deficiencies are tolerable in gene diagnosis but intolerable in prenatal diagnosis, so a simpler and more accurate method would be advantageous. In a recent approach shown by Dai Y et al 8, the commercial Bionano Saphyr single DNA molecule optical mapping system is well suited for the rapid diagnosis of FSHD1. This method produces ordered genome‐wide restriction maps by optical inspection and sizing of restriction fragments from single linearized DNA molecules 9.
In this study, we explored the new method of Bionano optical mapping combined with Karyomapping as new strategy for prenatal diagnosis.
2. MATERIALS AND METHODS
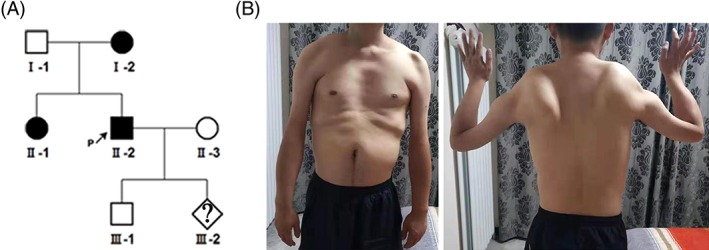
The affected family (Figure 2 A) consisted of the proband, a 28 years old male with typical clinical symptoms including: typical facial weakness, scapular winging and proximal weakness (Figure 2 B). He sleeps with eyes slightly open, and could not puff out his cheeks or whistle. His mother and sister all had similar muscle symptoms. All had obtained previous genetic diagnoses of FSHD1 by Southern Blot, which identified a 21 kb 4qA‐type EcoRI fragment on chromosome 4 as being pathogenic. We obtained samples for prenatal diagnosis from this family: blood samples from the proband, his wife and his mother, fetal amniotic fluid at 17 weeks of pregnancy, amniotic fluid cells after culture and abortus tissue after the abortion. Informed consent was obtained from all family members. This study was approved by the Ethics Committee for Medical Research of the First Affiliated Hospital of Zhengzhou University.
Figure 2.

Pedigree of the family. (A) The genealogic tree in family. The black shapes are the family members known to be affected by clinical phenotype and previously have diagnosed with FSDH1 by Southern Blot. The white shapes are the family members that are not affected (no clinical symptoms and/or negative by Southern Blot. (B) II‐2 showed proximal atrophy and an abnormal shoulder configuration with atrophy
2.1. Bionano Optical Mapping
2.1.1. Sample DNA preparation
Peripheral blood and culture cells DNA were isolated and extracted according to the Bionano Prep Blood DNA Isolation Protocol (Bionano Genomics #30033). Clinical centrifugation for 3 min at 2000 g was used to separate the white blood cells (WBC) from 3 ml of fresh blood, and these were then resuspended in Cell Suspension Buffer (CSB). High molecular weight DNA of aborted fetal tissue was extracted using the Bionano Prep Animal Tissue DNA Isolation Fibrous Tissue Protocol, (Bionano Genomics #30071). 50 mg tissue was ground up with liquid nitrogen in 2.5 ml of Animal Tissue Homogenize Buffer (HB) and 2.5 ml of anhydrous ethanol (Bionano Genomics). The mixture was left on ice for 1 h, centrifuged, and resuspended in 2 mL HB. The suspension was embedded using a 2% CHEF Genomic DNA Plug Kit (Bio‐Rad) to avoid fracture of DNA molecules. The DNA plugs were incubated in 2.5 ml Lysis Buffer (Bionano Genomics, USA) containing 167 μl of proteinase K (Qiagen) at 50oC overnight, then washed with wash buffer and TE buffer (Bionano Genomics, USA). 2 μl of 0.5 U/μl Agarase (Thermo Fisher) enzyme was added to the plugs into a 1.5 ml microcentrifuge tube and the samples left to stand for 45 min at 43oC. The DNA mixture was dropped into the center of 0.1 μm Dialysis Membrane (EMD Millipore, USA) for 45 min to dry at room temperature.
2.1.2. Bionano optical mapping detection
DNA was quantified using a Qubit 3.0 Fluorometer (Thermo Fisher Scientific, USA). The integrity of high‐molecular weight DNA was determined by pulse‐field gel electrophoresis (Pippin Pulse, Sage Science). Samples with > 150kb molecular weight at the concentration of 45‐200 ng/μl were used for labeling experiments. DNA labeling was carried out according to Bionano PrepTM Labeling ‐ NLRS Protocol (Bionano Genomics #U30024), and consisted of four consecutive steps (Nick, Label, Repair and Stain). First, 300 ng of high molecular weight DNA was nicked using endonuclease Nb.BssSI in 10×Buffer 3.1 (Bionano Genomics, USA) for 2 h at 37oC. Second, 1.5 μl of 10×Labeling Mix (Bionano Genomics) and 1.0 μl Taq DNA Polymerase (Bionano Genomics) was added and the sample left to stand for 1 h at 72oC. Third, labeled DNA was repaired using 5 μl Repair Master Mix for 30 min at 37oC. Forth, DNA was stained overnight using 41.8 μl of Staining Master Mix (Bionano Genomics, USA). The stained DNA was quantified as above. DNA was used at 3‐10 ng/μl, loaded into a Saphyr chip (Bionano Genomics, USA), and the fluorescent DNA molecules were imaged using the Saphyr instrument (Bionano Genomics, USA).
2.1.3. The pretreatment and comparison of data
Data from the Bionano Saphyr bioinformatics mapping platform was used to exclude molecules with length < 150 kb or of low quality. We performed in silico digestion of the human reference genome (GRCh38) to generate the Nb.BssSIenzyme (CACGAG) reference map (CMAP file). Then the sample data and reference CMAP file were compared using Bionano Solve 3.2.1 software. A custom script was built by Liu Q et al. to extract and align the required D4Z4 target regions from whole‐genome maps, to speed up subsequent data analysis and visualization.
2.1.4. Determining the number of D4Z4 repeats, 4qA/4qB haplotype and 4q/10q chromosome
We extracted data from the D4Z4 target region from the whole genome maps of family FSHD1 members. There is only one Nb.BssSIrestriction enzyme site in each D4Z4 repeat, and the distance between each restriction site is about 3.3kb, thus the number of D4Z4 repeats can be simply determined by calculating the number of restriction sites in the target region. The FSHD1 pathogenic haplotype 4qA has an additional Nb.BssSI site, 1.7kb further into the region distal to the last D4Z4 repeat unit, while the non‐pathogenic 4qB haplotype does not. Therefore, we can also the determine the 4qA/4qB haplotype of the sample DNA by identifying and counting this extra site. And the identification of 10qA/B is same as 4qA/B. The average length of DNA reads is about 150kb, which can be well covered all D4Z4 repeats in FSHD1. So it's easy to recognize 4q35 and 10q26 homologous sequences through the analysis of fluorescence spectra of upstream and downstream near D4Z4 repeats.
2.2. Karyomapping
2.2.1. DNA sample preparation
Genomic DNA was extracted from the peripheral blood samples and fetal chorionic amniotic fluid samples using a DNA extraction kit (Omega blood/tissue DNA kit, Georgia, United States) according to the manufacturer's instructions.
2.2.2. Karyomapping and haplotype analysis
The target region haplotypes identified using the Humankaryomap‐12v1.0 BeadChip array (Illumina, San Diego, USA) for whole‐genome SNP detection, and iScan for SNP scanning. BlueFuse Multi 4.4 (Illumina, San Diego, USA) was used for karyomap analysis. The DUX4 gene is located in the region 4q35.2. The start and stop area (191005267‐191007077) of this gene in analysis is selected for parameter setting, and the analysis area is about 1.7 Kb. The upper and lower 2 Mb regions were taken as the auxiliary analysis areas. A total of 138 SNP sites were identified in this region. All of them were located at the 5' end of the D4Z4 repeats10.
3. RESULTS
3.1. Bionano optical mapping
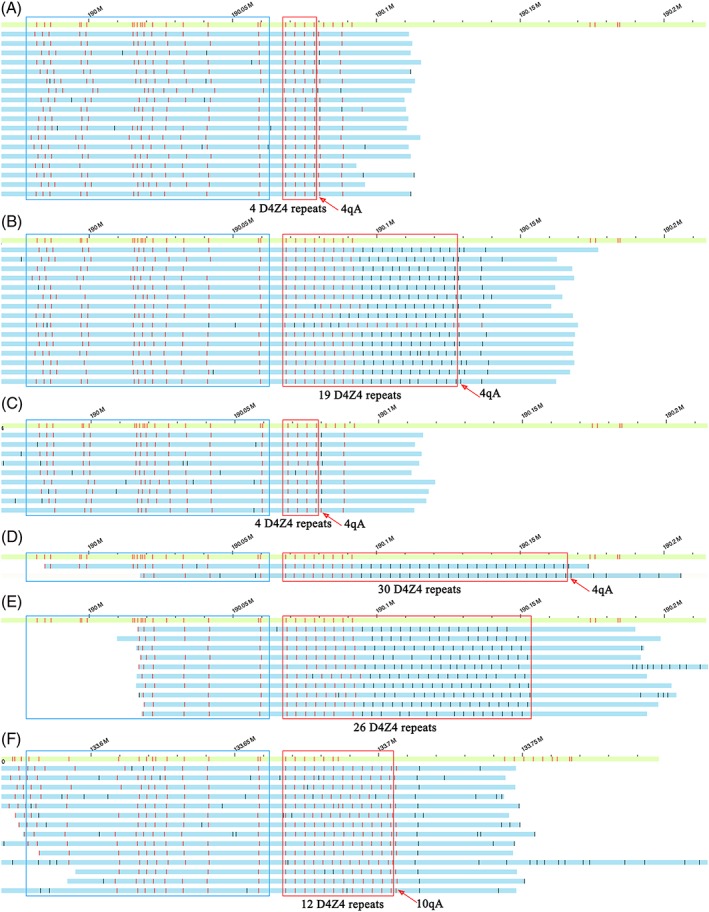
was used to perform genetic diagnose of the affected proband of family FSHD1. The sequencing depth of the target area was 45×. The results were visualized using Bionano Solve (version 3.2.1) software (Figure 3). The analysis revealed that proband had pathogenic sequences in the target chromosome 4 region (see Figure 3 A): only 4 D4Z4 repeats, and also the pathogenic 4qA allele. The proband's normal chromosome 4 is shown in Figure 3 B, and had 19 D4Z4 repeats, and the 4qA allele. Compared with the results of the proband's Southern Blot, the Bionano test more accurately identified: 1) the number of D4Z4 repeats; 2) the chromosomal alocation of the D4Z4 repeats; 3) the 4qA/B alleles; and, 4) the 4q35.2 and l0q26.3 regions, by their upstream and downstream sequences.
Figure 3.

Bionano optical maps and genetic diagnosis of the proband and fatus of family FSDH1. The green bar shows the reference normal human DNA in the target chromosome 4, region 4q35, while the blue bars each show one optical map reading in the target region. Each red vertical line in the red boxes indicates schematically the presence of a D4Z4 repeat (3.3kb). The vertical line immediately to the right of the red box indicates the presence of the pathogenic 4qA allele, while its absence indicates the non‐pathogenic 4qB allele. The blue box shows the different region between 4q35.2 and 10q26.3. (A) the proband's pathogenic chromosome 4, showing that it has only 4 D4Z4 repeats, and the 4qA allele; (B) the proband's normal chromosome 4, showing 19 D4Z4 repeats, and the 4qA allele; (C) the fetal pathogenic chromosome, showing 4 D4Z4 repeats and the 4qA allele. (D) the fetal normal chromosome showing 30 D4Z4 repeats and the 4qA allele. (E) our normal chromosome 4 control showing 26 D4Z4 repeats, and the 4qB allele; (F) our normal chromosome 10 control showing 12 D4Z4 repeats, and the 10qA allele
3.2. karyomap analysis
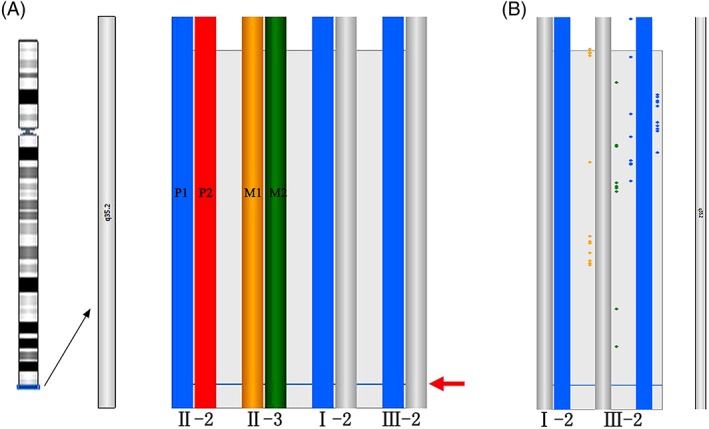
The FSHD1 family haplotypes were constructed using the Karyomap SNP‐array method. The results of this analysis are shown in Figure 4. The haplotype of the DUX4 allele of the affected proband (the fetus' father) was named P1 and P2, while the haplotype of the fetus' unaffected mother was named Ml and M2. FSHDI is an autosomal dominant genetic disease and the family members that inherited the FSHD1pathogenic sequences in the chromosome 4q35.2 region are shown as blue bars. The results indicated that there is no recombinationin 4q35.2 region. The fetus clearly inherited the pathogenic chromosome fragment P1 and thus would most likely be affected by FSHD1 disease.
Figure 4.

The result of the karyomap analysis. (A) The haplotype of target 4q35.2 region, from left to right, the ideogram of 4q35.2 region, the paternal chromosomes (blue and red); the maternal chromosomes (yellow and green); haplotype of grandmother (blue and grey) and fetal samples compared to the parents and affected grandmother. The arrow indicates the lacation of the DUX4 gene. (B) More detailed view of the fetus above compared to the affected grandmother. Individual informative SNPs are plotted in the detailed haploblock chart and colored according to the phase (P1, P2, M1, M2) that the SNP supports. Key SNPs, which are strong evidence, are plotted right the haploblock bar. Non‐key SNPs, which are weaker evidence, are plotted left the haploblock bar
3.3. Bionano optical mapping of fetal amniotic fluid cells
The results are shown in Figure 3 C and 3 D, and indicated that the fetus had one pathogenic chromosome 4 with 4 D4Z4 repeats and the 4qA allele, while its normal chromosome contained 30 D4Z4 repeats, and also the 4qA allele. The fetus' pathogenic sequences were similar to those of its affected father (the proband), indicating that the fetus would likely be positive for FSHD1 disease. The results of Bionano optical mapping using fetal amniotic fluid cells were consistent with the results obtained by Karyomapping linkage‐analysis using fetal amniotic fluid cells.
4. DISCUSSION
The genetic diagnosis of FSHD1 is very difficult, because of the special DNA structural features involved in the genetics of this disease: (1) Multiple (11‐100) small (3.3 KB) D4Z4 repeated elements in chromosome region 4q35.2 are present on the normal chromosome, while pathogenic deletions associated with FSHD1 result in many fewer D4Z4 repeats (1‐10) 11; (2) the downstream pathogenic 4qA allele must be distinguished from the non‐pathogenic 4qB allele; (3) The D4Z4 repeats are highly homologous and difficult to distinguish from 10q26.3 region 12, 13. There are two methods of FSHD1 genetic diagnosis currently in use: Southern Blot and molecular combing14. Recently, the Bionano optical mapping technique has been used for FSHD1 gene diagnosis 8, 13. In the present study, we utilized Bionano optical mapping for prenatal diagnosis in a FSHD1 familiy with positive history. We used white blood cells from the proband (the father), proband's mother and fetal amniotic fluid cells. The pathogenic 4q35 region of the 3 family members (fetus, father, grandmother) all had only 4 D4Z4 repeats and the 4qA allele, and the D4Z4 repeats were clearly distinguished from the 10q26 repeats. Southern Blot is still the “gold standard” 6, but it is not so accurate because it detects the length of all D4Z4 repeats, and not their exact number. Research by Yi et al [8] and Qian et al [13] showed that Bionano optical mapping provided an accurate molecular diagnosis of FSHD, deriving haplotypes consistent with gold standard Southern blotting.
Karyomapping is mostly used in pre‐implantation genetic diagnosis (PGD) 15. However, in the present study, we employed this technique for prenatal diagnosis along with Bionano optical mapping. Karyomapping can be used to perform linkage analysis for prenatal diagnosis of FSHD1 as an indirect diagnosis, through the detection of SNP loci, to construct family members' haplotypes, and to determining whether a fetus has inherited the family's pathogenic chromosome10. These haplotypes provide information on the entire 4q35 region, including the pathogenic D4Z4 and flanking 4qA regions. This information may exclude the interference of the 10q26 homology region, and also detect the presence of recombination in these or other distal regions of chromosome 4. Although the Karyomap technique requires two patients in the family, the amount of DNA required is small and can be tested directly using amniotic fluid or villus DNA to make the test results quick and responsive to the original sample.
In this study, the DNA samples used for Bionano detection were from culture cells. The main problem in amniotic fluid cell culture is cell chimeric or cultural artifact16. But we used the Karyomap chip to detect the DNA of the original fetal amniotic fluid sample, eliminating the possibility of fetal chromosome mosaic, and Bionano optical mapping was able to detect the microchimerism problem caused by the cell culture. The two results can be mutually confirmed, excluding the error caused by cell culture, reflecting the original situation of the fetus.
In summary, we utilized the approach of combining Bionano optical mapping with Karyomapping for rapid and accurate prenatal diagnosis in a FSHD1 family with positive history in this study. Bionano optical mapping was used for prenatal diagnosis of FSHD1, and effectively exclude interference by the homologous 10q26 repeat elements. The absence of Southern Blot analysis of fetal tissue is a limitation of the current study but some samples have demonstrated the application of Bionano optical mapping in the FSHD1 gene diagnosis. Besides, Bioano optical mapping can detect chromosome deletion, repeat, inversion 17, 18. Qian Zhang et al 13 used this method to detect a repetition of a 4q35 region successfully. Although the price of Bionano optical mapping is a little higher now, with the commercial development and promotion of Bionano, the price will gradually decrease. Bionano optical mapping and karyomapping are performed respectively for detection of fetal amniotic fluid and culture cells samples, improving the accuracy and confidence of the prenatal diagnosis of FSHD1. We present that Bionano optical mapping combined karyomapping may provide a new approach of rapid and accurate prenatal diagnosis for FSHD1 families with positive history.
CONFLICT OF INTEREST STATEMENT
The authors declare no competing interests.
ACKNOWLEDGMENTS
We thank the patients with FSHD1 who participated in this study.
Zheng Y, Kong L, Xu H, et al. Rapid prenatal diagnosis of Facioscapulohumeral Muscular Dystrophy 1 by combined Bionano optical mapping and karyomapping. Prenatal Diagnosis. 2020;40:317–323. 10.1002/pd.5607
DATA AVAILABILITY STATEMENT
The data that support the findings of this study are available on request from the corresponding author. The data are not publicly available due to privacy or ethical restrictions.
REFERENCES
- 1. He JJ, Lin XD, Lin F, et al. Clinical and genetic features of patients with facial‐sparing facioscapulohumeral muscular dystrophy. European journal of neurology. 2018. Feb;25(2):356–364. [DOI] [PubMed] [Google Scholar]
- 2. Tawil R. Facioscapulohumeral muscular dystrophy. Handbook of clinical neurology. 2018;148:541–548. [DOI] [PubMed] [Google Scholar]
- 3. Rickard AM, Petek LM, Miller DG. Endogenous DUX4 expression in FSHD myotubes is sufficient to cause cell death and disrupts RNA splicing and cell migration pathways. Human molecular genetics. 2015. Oct 15;24(20):5901–5914. [DOI] [PMC free article] [PubMed] [Google Scholar]
- 4. Gatica LV, Rosa AL. A complex interplay of genetic and epigenetic events leads to abnormal expression of the DUX4 gene in facioscapulohumeral muscular dystrophy. Neuromuscular disorders: NMD. 2016. Dec;26(12):844–852. [DOI] [PubMed] [Google Scholar]
- 5. Deidda G, Cacurri S, Piazzo N, et al. Direct detection of 4q35 rearrangements implicated in facioscapulohumeral muscular dystrophy (FSHD). J Med Genet. 1996. May;33(5):361–365. [DOI] [PMC free article] [PubMed] [Google Scholar]
- 6. Ehrlich M, Jackson K, Tsumagari K, et al. Hybridization analysis of D4Z4 repeat arrays linked to FSHD. Chromosoma. 2007. Apr;116(2):107–116. [DOI] [PMC free article] [PubMed] [Google Scholar]
- 7. Deidda G, Cacurri S Fau‐Piazzo N, Piazzo N, Fau‐Felicetti L . Direct detection of 4q35 rearrangements implicated in facioscapulohumeral muscular dystrophy (FSHD). J Med Genet 1996. May;33(5):361–365. [DOI] [PMC free article] [PubMed] [Google Scholar]
- 8. Dai Y, Li P, Wang Z, et al. Single‐molecule optical mapping enables quantitative measurement of D4Z4 repeats in facioscapulohumeral muscular dystrophy (FSHD) [published online ahead of print, 2019 Sep 10]. J Med Genet. 2019;jmedgenet‐2019‐106078. [DOI] [PMC free article] [PubMed] [Google Scholar]
- 9. Chan EKF, Cameron DL, Petersen DC, et al. Optical mapping reveals a higher level of genomic architecture of chained fusions in cancer. Genome research. 2018. Apr 4;28:726–738. [DOI] [PMC free article] [PubMed] [Google Scholar]
- 10. Natesan SA, Bladon AJ, Coskun S, et al. Genome‐wide karyomapping accurately identifies the inheritance of single‐gene defects in human preimplantation embryos in vitro. Genetics in medicine: official journal of the American College of Medical Genetics. 2014. Nov;16(11):838–845. [DOI] [PMC free article] [PubMed] [Google Scholar]
- 11. de Greef JC, Lemmers RJ, van Engelen BG, et al. Common epigenetic changes of D4Z4 in contraction‐dependent and contraction‐independent FSHD. Human mutation. 2009. Oct;30(10):1449–1459. [DOI] [PubMed] [Google Scholar]
- 12. Zeng W, Chen YY, Newkirk DA, et al. Genetic and epigenetic characteristics of FSHD‐associated 4q and 10q D4Z4 that are distinct from non‐4q/10q D4Z4 homologs. Hum Mutat. 2014. Aug;35(8):998–1010. [DOI] [PMC free article] [PubMed] [Google Scholar]
- 13. Zhang Q, Xu X, Ding L, et al. Clinical application of single‐molecule optical mapping to a multigeneration FSHD1 pedigree. Molecular genetics & genomic medicine. 2019. Mar;7(3):e565. [DOI] [PMC free article] [PubMed] [Google Scholar]
- 14. Vasale J, Boyar F, Jocson M, et al. Molecular combing compared to Southern blot for measuring D4Z4 contractions in FSHD. Neuromuscular disorders: NMD. 2015. Dec;25(12):945–951. [DOI] [PubMed] [Google Scholar]
- 15. Handyside AH, Harton GL, Mariani B, et al. Karyomapping: a universal method for genome wide analysis of genetic disease based on mapping crossovers between parental haplotypes. J Med Genet. 2010. Oct;47(10):651–658. [DOI] [PubMed] [Google Scholar]
- 16. Peakman DC, Moreton MF, Corn BJ, et al. Chromosomal mosaicism in amniotic fluid cell cultures. American journal of human genetics. 1979. Mar;31(2):149–155. [PMC free article] [PubMed] [Google Scholar]
- 17. Cao H, Hastie AR, Cao D, et al. Rapid detection of structural variation in a human genome using nanochannel‐based genome mapping technology. GigaScience. 2014;3(1):34. [DOI] [PMC free article] [PubMed] [Google Scholar]
- 18. Barseghyan H, Tang W, Wang RT, et al. Next‐generation mapping: a novel approach for detection of pathogenic structural variants with a potential utility in clinical diagnosis. Genome medicine. 2017. Oct 25;9(1):90. [DOI] [PMC free article] [PubMed] [Google Scholar]
Associated Data
This section collects any data citations, data availability statements, or supplementary materials included in this article.
Data Availability Statement
The data that support the findings of this study are available on request from the corresponding author. The data are not publicly available due to privacy or ethical restrictions.


