

Abstract
Aims
To investigate the mechanism of action of 55P0251, a novel multiflorine‐derived substituted quinazolidine that augments insulin release and lowers blood glucose in rodents, but does not act via mechanisms addressed by any antidiabetic agent in clinical use.
Materials and Methods
Using male mice, we determined the effects of 55P0251 on glucose tolerance, insulin secretion from isolated islets and blood oxygen saturation, including head‐to‐head comparison of 55P0251 to its inverted enantiomer 55P0250, as well as to other anti‐hyperglycaemic multiflorine derivatives discovered in our programme.
Results
55P0251 was clearly superior to its inverted enantiomer in the glucose tolerance test (area under the curve: 11.3 mg/kg 55P0251, 1.19 ± 0.04 min*mol/L vs 55P0250, 1.80 ± 0.04 min*mol/L; P < .0001). For insulin release in vitro, this superiority became visible only under concomitant adrenergic background stimulation (glucose‐stimulated insulin release, fmol*islet−1*30 min−1: without α2‐adrenoceptor agonist: 500 μmol/L 55P0251, 390 ± 34, vs 55P0250, 459 ± 40, nonsignificant; with α2‐adrenoceptor agonist: 250 μmol/L 55P0251, 138 ± 9, vs 55P0250, 21 ± 6; P < .0001). Since receptor binding assays suggested antagonism at α2A‐adrenoceptors as a potential mechanism of action, we measured oxygen saturation in capillary blood from the tail as a surrogate of vasoconstriction, which supported α2‐antagonistic action in vivo (90 mg/kg 55P0251, 83 ± 3%, vs 55P0250, 57 ± 3%; P < .0001). Lack of association between glucose‐lowering activities and α2A‐adrenoceptor binding affinity arising from comparison of multiflorine derivatives was attributed to differences in their pharmacokinetic properties.
Conclusions
Our findings suggest that 55P0251 and related multiflorine derivatives are to be categorized as α2‐adrenoceptor antagonists with potential to lower blood glucose by blocking α2A‐adrenoceptors on pancreatic β cells.
Keywords: animal pharmacology, antidiabetic drug, drug development, drug mechanism, insulin secretion
1. INTRODUCTION
The majority of novel drugs reaching the market are still directly or indirectly derived from natural products.1, 2 Although discovery strategies based on a predefined molecular target and/or mechanism of action are currently more popular, the search for novel structures in natural remedies, which are traditionally used and carry disease‐relevant activity, remains a rational approach. In the Mediterranean area, lupins have traditionally been used for the treatment of diabetes mellitus.3 They are rich in quinolizidine alkaloids, such as lupanines, sparteine and multiflorine, which among other actions have been associated with insulinotropic effects on isolated pancreatic islets as well as with lowering of blood glucose.4, 5, 6, 7, 8, 9, 10
Based on work from Kubo et al,9, 10 who described multiflorine derivatives with antidiabetic properties in mice, we used a molecular scaffold derived from (−)‐multiflorine as the starting point for an extensive derivatization programme. In line with the idea of building on bioactivity in vivo, we used glucose tolerance tests in orally dosed mice for structural optimization and discovered a novel class of fully synthetic substituted quinazolidines with distinct anti‐hyperglycaemic activity.11, 12 Structural development based on oral administration and a disease‐relevant endpoint allows selection for distinctive acute side effects, solubility, formulation properties and bioavailability at the earliest possible stage. This approach requires parallel efforts for tracking down the initially unknown molecular and biochemical mechanism(s) at work.
Our prototype compound 55P0110 exhibited a promising pharmacological profile, with the acute effects of a single dose outmatching most established oral antidiabetic drugs in the mouse glucose tolerance test.11 Encouraged by this outcome, we continued our efforts, resulting in the development of numerous active derivatives, from which 55P0251 was selected for detailed examination. 55P0251 is a further‐refined structure, which carries superior efficacy in comparison to 55P0110 accompanied by attractive pharmacokinetic attributes.12 In rodents, 55P0251 exhibited attractive anti‐hyperglycaemic, but not hypoglycaemic action, which could be attributed to augmentation of glucose‐stimulated insulin secretion via a molecular mechanism that differed from those addressed by drugs currently in use for the treatment of diabetes mellitus. No evidence was found for an extrapancreatic mechanism contributing to the lowering of blood glucose.12 Based on several experimental approaches, including comparison to promising candidates that were discovered later than 55P0251, we here report further efforts to pin down the molecular target and the mechanisms responsible for blood glucose‐lowering.
2. MATERIALS AND METHODS
2.1. Animals
Male C57BL/6J mice and db/db mice were purchased from Charles River Laboratories (Sulzfeld, Germany) and male Sprague–Dawley rats were from the Core Unit for Biomedical Research, Division for Laboratory Animal Science and Genetics, Medical University of Vienna (Himberg, Austria). All animals were housed under an artificial 12‐hour dark/12‐hour light cycle at room temperature and, where not stated otherwise, had free access to tap water and a conventional carbohydrate‐rich chow diet (sniff R/M‐H; sniff Spezialdiäten GmbH, Soest, Germany). All procedures and experiments were approved by the Austrian Federal Ministry of Science and Research (approvals # BMWF‐66.009/0317‐II/3b/2008, ‐/0074‐II/10b/2008, ‐/0100‐II/3b/2011, and ‐/0178‐II/3b/2012).
2.2. Test compounds
Substituted quinazolidines from our derivatization programme were synthesized at 55pharmaʼs chemistry laboratories (Tulln, Austria). The compounds were formulated as the free base or as salts. Since an influence of the employed formulation on anti‐hyperglycaemic activity has never been noted (documented for 55P0251 by Stadlbauer et al12), we always refer to the parent compound throughout the present report. Accordingly, all indicated doses and concentrations refer to the free base.
2.3. Glucose tolerance tests in mice
Oral glucose tolerance tests (OGTTs) were performed in mice fasted for ~10 hours and were performed according to a standard protocol described previously.11, 12 In short, the tip of the tail was pricked and basal blood glucose was measured in duplicate with a portable glucose meter (OneTouch; LifeScan, Milpitas, California). Immediately thereafter, mice were fed by gavage the vehicle alone (0.5% sodium carboxymethylcellulose; 5 mL/kg body weight) or the indicated dose of the respective compound. Forty‐five minutes after this first gavage, glycaemia was again measured and the OGTT was started by gavage feeding of aqueous glucose solution (3 g/kg in 6 mL/kg body weight). The time interval of 45 minutes between compound administration and starting the OGTT appeared appropriate for compounds with clinically useful pharmacokinetics, for example, sufficiently fast absorption and no first pass effect. Duplicate measurements of blood glucose were made 30, 60, 90, 120 and 150 minutes after glucose feeding. Where stated, time intervals of >45 minutes were used between the administration of drug/vehicle and glucose feeding.
2.4. Perifusion of mouse pancreatic islets
As described before,13, 14 mice in the fed state were deeply anaesthetized with sevoflurane and killed by cervical dislocation. The common bile duct was clamped at the papilla Vateri and 3 mL collagenase solution was injected via the bile duct, which caused distension of the pancreatic tissue (1 g/L Collagenase NB; Serva, Heidelberg, Germany; dissolved in ice‐cold Krebs–Ringer buffer, supplemented with 0.2% bovine serum albumin and 5 mmol/L HEPES; pH adjusted with NaOH to 7.35; this solution is referred to hereafter as KRB). The distended pancreas was digested for 13 minutes at 37°C and then further disrupted by vigorous hand shaking. Digestion was stopped by two cycles of centrifugation and resuspension in ice‐cold KRB containing the same glucose concentration as provided during the initial equilibration period of the subsequent perifusion experiment. From the pancreatic digest, 50 intact islets were collected under the microscope, transferred to a custom‐made perifusion chamber, and perifused for equilibration with KRB containing 0.1% DMSO (60 minutes; 37°C; 1 mL/min). The perifusion medium for equilibration contained 5 mmol/L glucose or, alternatively, 7 mmol/L glucose plus 1 μmol/L of the α2‐adrenoceptor agonist UK14,304 (brimonidine). Effluent for the duplicate measurement of insulin (Sensitive Rat Insulin RIA Kit; Millipore, Billerica, Massachusetts) was collected at −20 minutes, −10 minutes and immediately before the equilibration period ended and the subsequent test period started. During the test period, a test compound was added to the medium at the indicated concentration (only the vehicle added in control experiments). Thirty minutes later, the islets were stimulated with high glucose for the remaining 30 minutes of the perifusion (10 mmol glucose in experiments without, and 20 mmol/L glucose in experiments with UK14,304). During the total 60 minutes of the test period, effluent was collected after 2.5, 5, 7.5, 10, 15, 20, 30, 32.5, 35, 37.5, 40, 45, 50 and 60 minutes.
2.5. Pharmacokinetics
Mice were fasted for ~10 hours and received, by gavage, the indicated dose of compound 55P0399 (in 0.5% sodium carboxymethylcellulose, 5 mL/kg body weight). After a predefined time period, each mouse was deeply anaesthetized with sevoflurane and killed by bleeding via heart puncture. Blood was collected into chilled tubes containing EDTA and the plasma fraction was stored at −80°C for the later measurement of the concentration of 55P0399 and its metabolite 55P0297 by high‐performance liquid chromatography at 55pharmaʼs chemistry laboratories.
2.6. Oxygen saturation in capillary blood of the tail
Mice or rats were fasted for ~10 hours, before they received, by gavage, a single oral dose of the indicated compound or the corresponding vehicle. Seventy‐five mintues later, capillary blood was sampled from the tip of the tail and the percentage of oxyhaemoglobin was determined with an OSM3 hemoximeter (Radiometer, Copenhagen, Denmark). In some experiments, where stated, glucose solution was fed by gavage 45 minutes after administration of the test compound/vehicle (as in the OGTT: 3 g/kg in 6 mL/kg body weight). Both oxygen saturation and blood glucose were determined in capillary blood from the tail 30 minutes thereafter.
2.7. Pharmacologically induced hyperglycaemia
To study the interaction of compound 55P0251 with pharmacological inhibitors of insulin secretion, we exploited a protocol successfully applied before.13, 14 Endogenous hyperglycaemia was induced by the administration of a single dose of the KATP channel opener diazoxide (250 mg/kg) or the α2‐adrenoceptor agonist UK14,304 (100 μg/kg). Whereas diazoxide was admixed to the respective gavage solution containing vehicle or 55P0251, UK14,304 or its vehicle (saline containing 7% DMSO; 5 mL/kg) was injected intraperitoneally immediately after the gavage. Blood glucose was measured immediately before the administration of the respective compounds (0 minutes), as well as 30, 60, 90, 120, 150 and 180 minutes later.
2.8. Direct interaction with adrenoceptors in vitro
Screening assays for the analysis of direct interaction of the test compounds with adrenoceptors in vitro were performed by a commercial provider, MDS Pharma Services (King of Prussia, Pennsylvania; later acquired by Ricerca). Assays with insect Sf9 cells expressing the human α2A‐adrenoceptor employed 1 nmol/L [3H]MK‐912 as the radioligand and 10 μmol/L WB‐4101 to define specific binding. Inhibition of binding (%) was first examined at a concentration of 10 μmol/L of the test compounds. Based on five serial dilutions of the test compound, IC50 values were determined by non‐linear least squares regression analysis. Yohimbine was used as a positive control, and binding affinity constants (Ki) were calculated using the equation presented by Cheng and Prusoff.15
Subsequent assays, performed at the Institute of Biomedicine, University of Turku (Finland), employed cell membranes prepared from Chinese hamster ovary (CHO) cells expressing the human α2A‐, α2B‐ and α2C‐adrenoceptor subtypes, or the mouse α2A‐subtype. The competition binding reactions were performed as described16 with the radioligand [3H]RS79948‐197 (0.3 nmol/L) and eight serial dilutions of each test compound. Rauwolscine served as a positive control, and phentolamine (100 μM) was employed to determine specific binding. Ki was determined by non‐linear regression analysis. A procedure for the determination of agonist‐induced stimulation of [35S]GTPγS binding mediated by the human α2‐adrenoceptor subtypes was used as previously described; blocking effects of established α2‐antagonists have been confirmed in this setting.17, 18 Eight serial dilutions of the natural agonist (−)‐noradrenaline (0.0001, 0.001, 0.01, 0.1, 1, 10, 100, and 300 μmol/L), 1 μmol/L of the respective test compound, and approximately 0.1 nmol/L [35S]GTPγS were incubated with 5 μg of CHO membrane protein. From this, functional antagonism was calculated, that is, the extent to which the concentration–response curve of the agonist (−)‐noradrenaline was shifted to the right by the respective antagonist. In addition, possible agonist activity of the test compounds at each α2‐adrenoceptor subtype was determined in the [35S]GTPγS‐binding assay using serial concentrations of the test compounds (0.1, 0.3, 1, 3 and 10 μmol/L) in the absence of an agonist. Results were compared with those obtained with the full agonist (−)‐noradrenaline.
2.9. Statistical procedures
Results are given as means ± SEM. P values were calculated in the context of an exploratory data analysis using two‐tailed unpaired t‐tests, with P values <.05 taken to indicate statistical significance.
3. RESULTS AND DISCUSSION
3.1. Compounds
The present paper depicts results from compounds 55P0251, 55P0275, 55P0297 and 55P0399, which in the course of our derivatization programme were selected for deeper examination. Their structures and dose‐dependent effects in the standard OGTT are shown in Figure 1.
Figure 1.

Structures, elemental formulas and molecular weights of substituted quinazolidines used in this study. Dose‐dependent effects on areas under the glucose curves (AUC) are shown as obtained in oral glucose tolerance tests (OGTTs) performed in mice 45 minutes after a single oral dose of the respective compound. Means ± SEM; *P < .01; †P < .0001 versus control
3.2. The effect of 55P0251 on insulin release depends on adrenergic background stimulation
Preceding efforts to track down the mechanism(s), which underlie the improvement of glucose tolerance induced by compounds from our derivatization programme, provided evidence for amplification of the glucose‐induced rise in plasma insulin.11, 12 Glucose‐stimulated insulin release was also enhanced in isolated mouse pancreatic islets exposed to 55P0251 in vitro, suggesting direct effects on islets.12 Consistent with these previous results, a detailed examination of dose dependence in isolated islets confirmed that 55P0251 failed to affect insulin release as long as the glucose concentration remained basal (5 mmol/L), but boosted insulin release when stimulated with 10 mmol/L glucose (Figure 2A). However, the concentration of 55P0251 required for such amplification of insulin release in vitro (>150 μmol/L) ranged far above the plasma levels associated with glucose‐lowering activity in vivo (<1 μmol/L).12 Furthermore, comparison of 55P0251 to its inverted enantiomer 55P0250 revealed no difference between their actions in vitro (Figure 2B), which distinctly contrasted with marked superiority of 55P0251 (as well as of the racemate, 55P0135) with regard to improvement of glucose tolerance in vivo (Figure 2C). Such divergent patterns of action raised the question of whether the enantiomer‐independent effect on isolated islets could be driven by an unspecific or even toxic mechanism that differs from the cause of glucose lowering in vivo.
Figure 2.
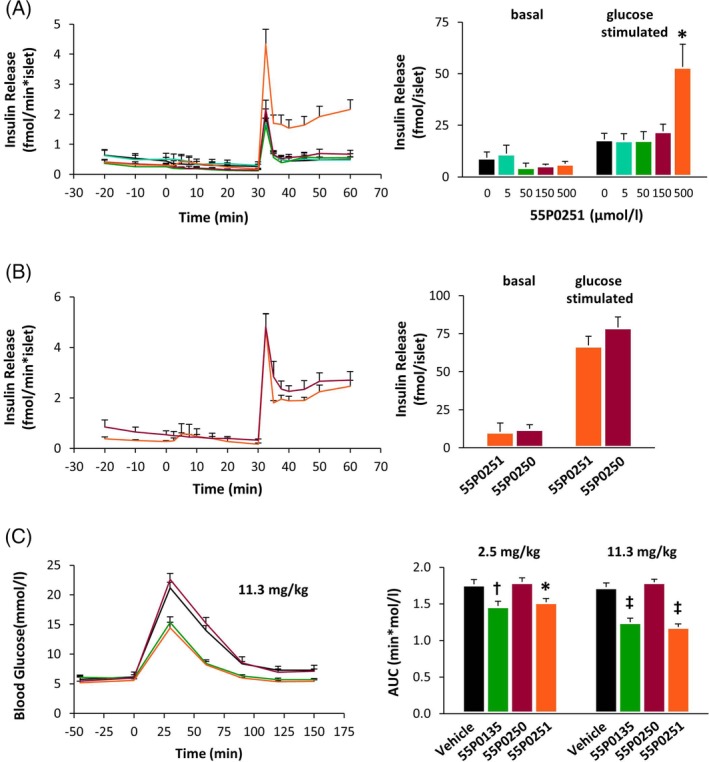
A, Isolated mouse islets were perifused for equilibration with medium containing 5 mmol/L glucose for 1 hour, before being exposed to different concentrations of 55P0251 from 0 minutes onwards. Thirty minutes later, islets were stimulated with 10 mmol/L glucose. Bar graphs show the cumulative amounts of insulin released under basal (0‐30 minutes) and glucose‐stimulated (30‐60 minutes) conditions (n = 5‐8 each). B, Using the same protocol as in (A), mouse islets were exposed to 500 μmol/L of 55P0251 or its inverted enantiomer 55P0250 (n = 4 each). C, Mice received a single oral dose of 2.5 mg/kg or 11.3 mg/kg 55P0135 (racemate), 55P250 or 55P0251 (pure enantiomers) 45 minutes before an oral glucose tolerance test (OGTT) (3 g/kg) was performed. Bar graphs show areas under the glucose curves (AUC; n = 8‐9 each; full curves depicted for 11.3 mg/kg only). Means ± SEM; colour codes for line graphs are indicated by corresponding bar colours; bar graphs: *P < .05; †P < .01; ‡P < .0001 vs control
Among the blood glucose‐lowering mechanisms that are not exploited in the clinic, but are experimentally established, is antagonism of adrenergic inhibition of insulin secretion. Since this effect becomes apparent under adrenergic background stimulation only,13, 19, 20 we examined the effects of 55P0251 and 55P0250 on isolated islets in the presence of the adrenergic α2‐agonist UK14,304, which is known to inhibit insulin release via α2A‐adrenoceptors located on β cells.21, 22 Under such conditions, superiority of 55P0251 over 55P0250, as observed in vivo (Figure 2C), was unmasked also in vitro, suggesting an enantiomer‐specific potential to significantly counteract adrenergic inhibition of insulin release (Figures 3A,B). The concentration of 55P0251 required for this response in vitro (25 μmol/L) was still higher than effective plasma levels, which could relate to different binding affinities and concentrations of the α2‐adrenoceptor agonist(s) present in vitro versus in vivo (UK14,304 versus adrenaline and noradrenaline). As shown in Table 1, 55P0251 was a potent competitor for ligand binding at α2A‐adrenoceptors, the adrenoceptor subtype mediating inhibitory effects on pancreatic β cells,22, 23, 24 with 80% inhibition of binding at 10 μmol/L 55P0251 compared to no inhibition by 10 μmol/L 55P0250. Notably, both agonist dependence and enantiomer specificity in vitro and in vivo were highly reminiscent of what we have previously found for the established α2A‐adrenoceptor antagonist efaroxan.13
Figure 3.

Isolated mouse islets were perifused for equilibration with medium containing 7 mmol/L glucose and 1 μmol/L of the α2‐adrenoceptor agonist UK14,304 for 1 hour, before being exposed to A, 25 μmol/L or B, 250 μmol/L of 55P0251 or its inverted enantiomer 55P0250 from 0 minutes onwards. Thirty minutes later, islets were stimulated with 20 mmol/L glucose. C, Isolated mouse islets were perifused for equilibration with medium containing 5 mmol/L glucose for 1 hour, before being exposed to 500 μmol/L of 55P0251 or 55P0297 from 0 minutes onwards. Thirty minutes later, islets were stimulated with 10 mmol/L glucose. D, Isolated mouse islets were perifused under conditions as in (A) and (B), except that they were exposed to 250 μmol/L of 55P0251, 55P0297 or 55P0399 from 0 minutes onwards. Bar graphs show the total amounts of insulin released under basal (0‐30 minutes) and glucose‐stimulated (30‐60 minutes) conditions; colour codes for lines are indicated by corresponding bar colours; means ± SEM; n = 3‐6 each; bar graphs: *P < .05; †P < .01; ‡P < .001 vs 55P0251 (A and B), or vs vehicle (C and D)
Table 1.
Binding characteristics and functional antagonism of 55P0251, 55P0297 and 55P0399 at α2‐adrenoceptors
| Adrenoceptor subtype | |||||||
|---|---|---|---|---|---|---|---|
| Inhibition of bindinga, % | 55P0251 | 55P0297 | 55P0399 | 55P0250 | (+)‐Efaroxan | Reserpine | |
| Human α2A | 80 | 97 | 38 | 1 | 97 | 14 | |
| Kib, nmol/L | 55P0251 | 55P0297 | 55P0399 | Rauwolscine | |||
| Human α2A | 615 | 21 | 5677 | 0.43 | |||
| Mouse α2A | 886 | 18 | 10 430 | 8.2 | |||
| Human α2B | 71 | 2.6 | 742 | 0.96 | |||
| Human α2C | 402 | 14 | 3841 | 0.21 | |||
| Functional antagonismb , c, μmol/L | 55P0251 | 55P0297 | 55P0399 | ||||
| Human α2A | 3.1 | 69 | 1.6 | ||||
| Human α 2B | 16 | 382 | 3.8 | ||||
| Human α2C | 11 | 131 | 2.2 |
Abbreviation: Ki, affinity constant.
Tested at MDS Pharma Services, King of Prussia, PA, USA.
Tested at Institute of Biomedicine, University of Turku, Finland.
The functional antagonism gives an indication of the extent to which the concentration–response curve of the agonist (−)‐noradrenaline is shifted to the right by 1 μmol/L of each test compound. These values are not true estimates of antagonist potency, since only one concentration of each test compound was examined. Tabular results from two independent runs are shown in Table S2B.
3.3. Insulin release in vitro matches α2A‐antagonistic activities of the individual derivatives
After evidence was obtained against the possibility that 55P0251 acts by modulating cAMP in islet cells (Table S1), we sought further evidence for or against α2A‐adrenoceptor antagonism as the cause of anti‐hyperglycaemic action exerted by our novel structures. To this end, we compared the glucose‐lowering activity of 55P0251 with that of other derivatives that had emerged from our derivatization programme. 55P0297 and 55P0399 exhibited similar minimal effective doses in the standard OGTT (Figure 1), but binding and functional antagonism assays with recombinant α2‐adrenoceptors in vitro showed that 55P0297 was clearly superior, whereas 55P0399 was clearly inferior to 55P0251 (Table 1). This hierarchy matched the effects of the individual compounds on insulin release from isolated islets (Figures 3C,D). Since no evidence was found of agonist activity of the test compounds at α2‐adrenoceptors (Table S2A), the results suggest that the direct actions on insulin release in vitro are at least mainly attributable to antagonism of α2‐adrenoceptors, with α2A being the subtype located on pancreatic β cells and known to mediate regulation of insulin release.22, 23, 24
3.4. Pharmacokinetics account for divergent activities in vivo versus in vitro
To obtain more precise information about relative potencies of the individual structures in the OGTT, direct head‐to‐head comparison within the same experimental run was performed in mice carefully matched for age and weight. While dose dependencies for 55P0297 and 55P0399 were very similar, 55P0251 was superior in the low dose range (Figure 4A). With regard to the hierarchy of individual compounds, direct effects on insulin release hence resembled α2A‐adrenoceptor binding, but deviated from anti‐hyperglycaemic action. The presumptive explanation for such differences in vitro versus in vivo finally arose from examination of pharmacokinetics: whereas 55P0297 and 55P0399 were completely stable in solution for at least 1 day in the vial, roughly 10% of circulating 55P0399 was rapidly converted to 55P0297 after oral administration (Figure 4B). Despite the discrepant potencies of 55P0399 and 55P0297 as stimulators of insulin release in vitro as well as in the tests for binding and antagonism at α2A‐adrenoceptors (Table 1; Figure 3D), similar glucose‐lowering activities in vivo (Figure 4A) thus seem to result from immediate interconversion, leading to a rapid equilibrium of plasma concentrations after oral administration. The information from a screening investigation of interactions of 55P0251, 55P0297 and 55P0399 with a broad panel of potential binding targets was compatible with this interpretation (Table S3).
Figure 4.
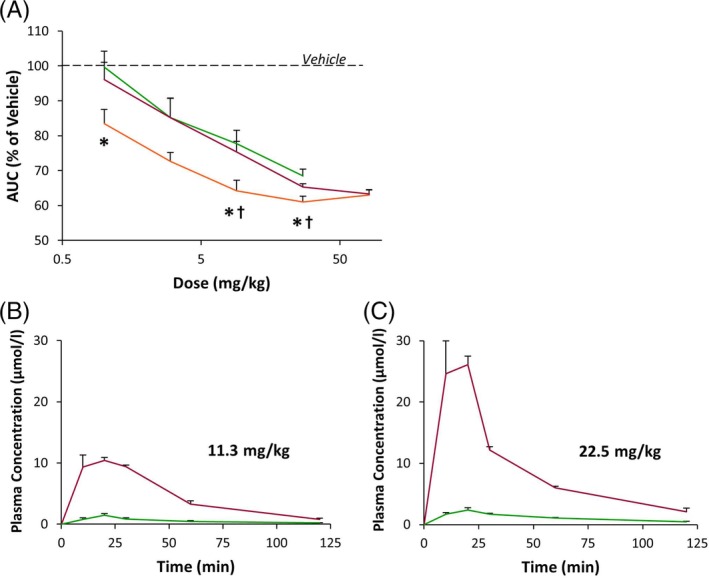
A, Dose‐dependent effects of 55P0251 (orange), 55P0297 (green) and 55P0399 (red) on areas under the glucose curves (AUCs) from oral glucose tolerance tests (OGTTs) performed in mice 45 minutes after a single oral dose of the respective compound. Data given in % of the mean value obtained in vehicle‐treated control mice. Means ± SEM; n = 8‐9 each; *P < .05 vs 55P0297; †P < .05 vs 55P0399. B, Plasma concentrations in mice of 55P0297 (green) and 55P0399 (red) after an oral dose of 11.3 mg/kg (left graph) or 22.5 mg/kg 55P0399 (right graph). Means ± SEM; n = 3 each
Since comparison of the effects of 55P0297 and 55P0399 in vivo may therefore not be helpful, we selected another comparator, 55P0275 (Figure 1). 55P0275 and 55P0399 resembled 55P0251 in that their inverted enantiomers were largely inactive (Figure 5A; Figure 2C). Head‐to‐head comparison of AUC values from the standard OGTT revealed anti‐hyperglycaemic effects of 55P0275, which in the low dose range were similar to those of 55P0399, but fell back somewhat versus those of 55P0251 (Figure 5B). At variance with this, 55P0275 was inferior to 55P0297 and superior to 55P0251 with respect to binding properties at the α2A‐adrenoceptor (Table 2). Juxtaposition of the individual structures therefore again revealed different hierarchies with regard to α2A‐adrenoceptor antagonism in vitro versus glucose‐lowering activity in vivo.
Figure 5.

A, Mice received a single oral dose of 2.5, 11.3 or 45 mg/kg of racemates (55P0242; 55P0203; green) or their pure enantiomers (55P0274/55P0275; 55P0296/55P0297; red/orange) 45 minutes before an oral glucose tolerance test (OGTT) (3 g/kg) was performed. Bar graphs show areas under the glucose curves (AUCs). Means ± SEM; n = 8‐9 each; colour codes for lines indicated by bar colours; bar graphs: *P < .05; †P < .01; ‡P < .0001 vs vehicle; full curves depicted for 11.3 mg/kg only. B, Dose‐dependent effects of 55P0251 (orange), 55P0297 (red) and 55P0275 (green) on AUCs from OGTTs performed in mice 45 minutes after a single oral dose of the respective compound. Data given in % of mean of vehicle‐treated mice. Means ± SEM; n = 7‐9 each; *P < .05 vs 55P0297; †P < .05 vs 55P0275. C, Mice received a single oral dose of 5 mg/kg of 55P0251 (orange), 55P0297 (red), or 55P0275 (green) 45 minutes before an OGTT (3 g/kg) was performed. Means ± SEM; n = 8‐9 each; *P < .001, †P < .001 for 55P0251 vs each other group. D, Effects of a single oral dose of 55P0251 (orange), 55P0297 (red) and 55P0275 (green) administered 45, 210, 330 or 450 minutes before an OGTT in mice. AUC, area under the glucose curve; data given in % of mean of vehicle‐treated mice; means ± SEM; n = 7‐9 each; *P < .001, †P < .0001 vs 55P0251
Table 2.
Displacement binding characteristics of 55P0251 (examined at 0.01, 0.1, 1 and 10 μmol/L), 55P0297 (examined at 0.3, 3, 30, 300 and 3000 nmol/L), 55P0275 (examined at 0.03, 0.1, 0.3, 1, and 3 μmol/L), yohimbine (examined at 0.3, 3, 30, 300 and 3000 nmol/L) and (+)‐efaroxan (examined at 1, 3, 10, 30 and 100 nmol/L) at the human α2A‐adrenoceptor
| 55P0251 | 55P0297 | 55P0275 | (+)‐Efaroxana | Yohimbine | ||
|---|---|---|---|---|---|---|
| Ki, nmol/L | Human α2A | 1780 | 20 | 68 | 3.72 | 3.10 |
| IC50, nmol/L | Human α2A | 4750 | 54 | 183 | 9.91 | 8.40 |
Note: Tests were performed by MDS Pharma Services, King of Prussia, PA, USA.
Abbreviations: IC50, half maximal inhibitory concentration; Ki, affinity constant.
Data on (+)‐efaroxan from Lehner et al13 are included here for direct comparison.
Closer inspection of the OGTT curves revealed that 55P0251 was particularly more effective than its counterparts in the later course of the test (exemplified for the 5 mg/kg dose in Figure 5C). Aiming to pinpoint potential differences in time dependence, OGTTs were started at different time intervals after drug dosing. In this series of experiments, head‐to‐head comparison of the three compounds confirmed a higher durability of the effect of 55P0251 (Figure 5D), which fitted with evidence for a longer half‐life of 55P0251 than 55P0297 (Figure 4B versus12).
In summary, the experiments based on compound comparison thus revealed dissociation of antagonistic properties at the α2A‐adrenoceptor in vitro from glucose‐lowering activities in vivo. However, these seeming discrepancies could be plausibly explained by pharmacokinetic attributes. Hence, all results were ultimately compatible with the hypothesized role of α2A‐adrenoceptor antagonism in the actions of our novel compounds on insulin release and blood glucose.
3.5. Evidence for effective α2‐adrenoceptor antagonism in vivo
While pharmacokinetics helped resolve several unclear matters, all the above evidence for α2A‐antagonism builds on in vitro experiments, including receptor binding and activation properties as well as insulin release from isolated islets. Hence, we sought evidence for α2‐adrenoceptor antagonism in vivo. During the OGTTs, we noted that the anti‐hyperglycaemic effects of our structures were accompanied by a brighter red colour of the capillary tail blood from our mice. This observation was confirmed by measurements of blood oxygen saturation, which was indeed dose‐dependently increased 75 minutes after administration of 55P0251 in the tail blood of lean mice, lean rats and genetically obese db/db mice. The inverted enantiomer 55P0250 lacked comparable effects not only on blood glucose and receptor binding, but also on oxygen saturation (Figure 6A). The α2‐adrenoceptor, including its α2A‐subtype, is known to be involved in thermoregulation by stimulating vasoconstriction in thermoregulatory tissues like human skin and, as relevant here, rodent tail.25, 26, 27, 28 Although a contribution of effects mediated via α1‐adrenoceptors cannot be excluded, increased oxygen saturation observed in tail blood from 55P0251‐treated mice could reflect vasodilation due to α2‐adrenoceptor antagonism in vivo. Using agents that act as vasodilators via other molecular targets (carvedilol, molsidomine), we confirmed that increased oxygen saturation in tail blood is a typical attribute of vasodilation in our experimental setup (Figure 6B). We further demonstrated that such a response is triggered by established α2‐adrenoceptor antagonists (yohimbine, racemic efaroxan), but not by (−)‐efaroxan, which lacks the α2A‐antagonistic potential of the (+)‐enantiomer (Figure 6C).13 This adds to the noteworthy parallels between 55P0251 and efaroxan mentioned above. Finally, we excluded the possibility that the increase in oxygen saturation occurred secondary to insulin secretion and/or glucose lowering rather than as a direct result of adrenoceptor antagonism. To this end, we used established antidiabetic drugs that increase insulin secretion (gliclazide, exenatide, repaglinide). Although the administered doses caused similar amelioration of hyperglycaemia 30 minutes after glucose feeding, glucose lowering was accompanied by a rise in oxygen saturation of tail blood only in response to 55P0251 (Figure 6D). These findings provide additional evidence that 55P0251 antagonizes α2‐adrenoceptors not only in vitro, but also in vivo under the conditions prevailing during our OGTTs in live mice.
Figure 6.

Oxygen saturation in capillary blood from the tip of the tail 75 minutes after receiving an oral drug dose A, in lean mice, obese db/db mice and lean rats treated with 55P0251 or its inverted enantiomer 55P0250; B, in lean mice treated with the established vasodilators carvedilol and molsidomine; C, in lean mice treated with the established antagonists of the α2A‐adrenoceptor yohimbine and efaroxan, or with the purified enantiomers of efaroxan. D, Oxygen saturation in capillary blood from the tip of the tail in lean mice 75 minutes after receiving an oral dose of 55P0251 or of the insulin secretion stimulators gliclazide, exenatide and repaglinide, as followed by glucose feeding (3 g/kg) 45 minutes after drug administration (exenatide injected subcutaneously). Means ± SEM; *P < .05; †P < .01; ‡P < .001; ¶P < .0001 vs vehicle
3.6. Similarities and differences versus established α2A‐adrenoceptor antagonists
Comparison of the different derivatives showed somewhat more marked effects of 55P0399 and 55P0275 than 55P0251 on oxygen saturation (Figure 7A), which matches their superior α2A‐adrenoceptor binding properties (Tables 1 and 2) but differs from their relative efficacies in the OGTT (Figures 4A and 5B). This divergence could derive from pharmacokinetics. In addition, many α2A‐adrenoceptor antagonists are known to modulate insulin release not only via adrenoceptors, but also via one (or even more) non‐adrenergic mechanism(s). While non‐adrenergic action(s) obviously include direct interaction with KATP channels on β cells,29, 30, 31, 32 the potency of a given α2A‐adrenoceptor antagonist as KATP channel blocker is not necessarily proportional to its potency at the adrenoceptor, which presumably contributes to variability among the pharmacological profiles of individual compounds.13, 14
Figure 7.
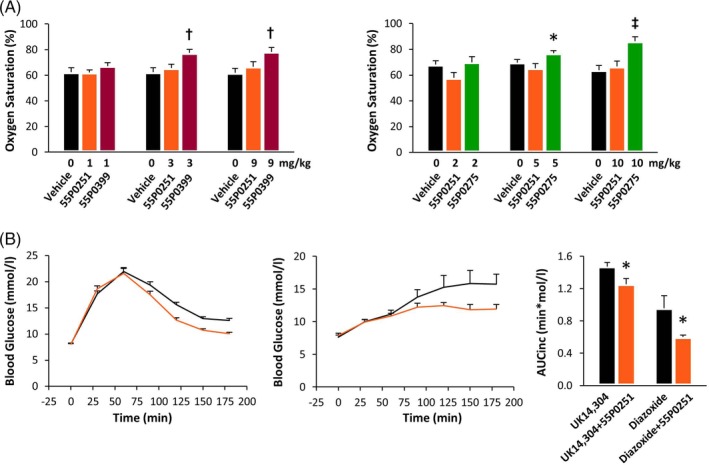
A, Oxygen saturation in capillary blood from the tip of the tail in lean mice 75 minutes after receiving an oral dose of 1 mg/kg 55P0251 (orange), 55P0399 (red) or 55P0275 (green). Means ± SEM; n = 7‐15 each; *P < .05, †P < .01, ‡P < .001 vs vehicle. B, Effect of an oral dose of 55P0251 (1 mg/kg; orange) on hyperglycaemia as induced by intraperitoneal injection of the α2‐adrenoceptor agonist UK14,304 (100 μg/kg) or by an oral dose of the KATP opener diazoxide (250 mg/kg). All drugs were administered at 0 minutes; bar graphs depict the corresponding incremental areas under the glucose curves (AUCinc); means ± SEM; n = 8‐24 each; *P < .05 vs without 55P0251
With regard to our novel structures, an adrenoceptor‐independent mechanism could explain enantiomer‐independent stimulation of insulin release in the absence of α2‐adrenoceptor agonists from isolated islets, as we observed it at high concentrations of 55P0251 and 55P0250 (Figure 2B). We then exploited a previously applied protocol for the dissection of contributions of adrenoceptor versus KATP channel‐mediated effects on blood glucose in vivo.13, 14 In this setting, a low dose of 1 mg/kg 55P0251 potently counteracted hyperglycaemia induced by an α2‐adrenoceptor agonist as well as hyperglycaemia induced by a KATP channel‐opener, suggesting that 55P0251, like other α2A‐adrenoceptor antagonists, addresses both mechanisms (Figure 7B). It is notable, however, that 55P0251 was relatively potent in counteracting hyperglycaemia caused by KATP channel‐opening (reduction of incremental AUC diazoxide, −37.4 ± 2.7%, vs induced by UK14,304, −14.8 ± 4.7%; P = .012), which distinguished 55P0251 from other α2A‐adrenoceptor antagonists and extended previous observations of relevant variation in the molecular pharmacology of individual α2A‐adrenoceptor antagonists (Figure S1).13, 14
In conclusion, without any postulation of a molecular mechanism at work we have discovered and developed a novel class of fully synthetic substituted quinazolidines, which shows distinct anti‐hyperglycaemic activity in mice. Focusing on compound 55P0251, we made efforts to track down the glucose‐lowering mechanism of action and, as previously reported, found that 55P0251 augments insulin secretion via a mechanism presently not exploited in the clinical treatment of type 2 diabetes.12 Here, we provide evidence that 55P0251 is to be categorized as an α2‐adrenoceptor antagonist acting on insulin secretion via blocking α2A‐adrenoceptors located on pancreatic β cells. While further studies, for example in α2A‐adrenoceptor knockout mice, are required to test the hypothesis, this conclusion is backed by extensive and striking parallels with previously described effects of structurally different compounds, which augment insulin release via antagonism at α2A‐adrenoceptors on pancreatic islets (e.g., efaroxan13). These parallels include evidence for the additional involvement of a non‐adrenergic mechanism, presumably via blockade of the KATP channel.29, 30, 31, 32 Although extensive efforts to develop α2‐adrenoceptor antagonists for clinical use in the treatment of type 2 diabetes have so far not been successful, this option gained new interest when a prevalent single nucleotide polymorphism causing overexpression of the α2A‐adrenoceptor was found to be associated with an elevated risk of type 2 diabetes.33, 34, 35, 36
The results reported in the present study constitute a major step towards understanding the molecular mechanism(s) accounting for the anti‐hyperglycaemic activity of 55P0251 and presumably of multiflorine derivatives in general. In addition, our work exemplifies a drug discovery strategy, where the identification and development of highly effective structures is based on disease‐relevant activity in vivo and precedes the search for molecular mechanism(s).
Supporting information
Figure S1. XXX
Table S1. Effect of 55P0251 on cAMP release from RINm5F cells in vitro: The experiment was performed by a commercial provider (Pharmacelsus, Saarbrücken, Germany). In short, RINm5F cells (a rat insulinoma cell line) were exposed to the indicated concentrations of 55P0251, exendin‐4, or GLP‐1 (the latter two serving as positive controls). After exposure, released cAMP was determined in the cell lysates (Cyclic AMP Direct ELISA Kit, Assay Designs, Ann Arbour, MA, USA). The data were normalized to basal cAMP release of untreated control cells. Experiments were performed in triplicate; *P < .05 by one sample t test.
Table S2. A, Agonist activity at the human the α2‐adrenoceptor subtypes as indicated by comparison of serial concentrations of 55P0251, 55P0297, and 55P0399 (0.1, 0.3, 1, 3, and 10 μmoL/L) to the full agonist (−)‐noradrenaline (0.0001, 0.001, 0.01, 0.1, 1, 10, 100, and 300 μmoL/L). Determined by stimulation of [35S]GTPγS binding; results from two independent runs. The results provide no evidence for agonist activity by 55P0251, 55P0297, or 55P0399. B, Two independent experimental runs of the [35S]GTPγS binding assay protocol, from which functional antagonism (as given in Table 1) was calculated. In the presence of 1 μmol/L of 55P0251, 55P0297, and 55P0399, different concentrations of the agonist (‐)‐noradrenaline were added (0.0001, 0.001, 0.01, 0.1, 1, 10, 100, and 300 μmol/L). The results provide evidence for antagonist activity by 55P0297 > 55P0251 > 55P0399.
Table S3. Preliminary assessment of displacement binding at various structures of 55P0251, 55P0297 and 55P0399 (used at 10 μmoL/L) as reported by a commercial provider (MDS Pharma Services, King of Prussia, PA, USA; later acquired by Ricerca). Results were obtained with radioligand binding assays, except for CYPs, where enzyme assays with spectrofluorimetric quantitation of 3‐cyano‐7‐hydroxycoumarin or 7‐fydroxy‐4‐(trifluoromethyl)‐coumarin (for CYP450, 3A4) were used. nd, not determined
ACKNOWLEDGMENTS
We thank the team of the Core Unit for Biomedical Research, Medical University of Vienna, for providing access to their research facilities and for taking care of the mice. This work was supported by the Austrian Research Promotion Agency (FFG; Grants No. BRIDGE 812095‐SCK/SAI and 820121‐SCK/KUG).
Lehner Z, Stadlbauer K, Brunmair B, et al. Evidence that the multiflorine‐derived substituted quinazolidine 55P0251 augments insulin secretion and lowers blood glucose via antagonism at α2‐adrenoceptors in mice. Diabetes Obes Metab. 2020;22:290–302. 10.1111/dom.13895
Peer Review The peer review history for this article is available at https://publons.com/publon/10.1111/dom.13895.
Funding information The Austrian Research Promotion Agency (FFG), Grant/Award Numbers: BRIDGE 812095‐SCK/SAI, and 820121‐SCK/KUG
REFERENCES
- 1. Newman DJ. Natural products as leads to potential drugs: an old process or the new hope for drug discovery? J Med Chem. 2008;51:2589‐2599. [DOI] [PubMed] [Google Scholar]
- 2. Newman DJ, Cragg GM. Natural products as sources of new drugs over the 30 years from 1981 to 2010. J Nat Prod. 2012;75:311‐335. [DOI] [PMC free article] [PubMed] [Google Scholar]
- 3. Khalil SH, Zaki A, Ibrahim AM, et al. Pattern of use of complementary and alternative medicine among type 2 diabetes mellitus patients in Alexandria, Egypt. J Egypt Public Health Assoc. 2013;88:137‐142. [DOI] [PubMed] [Google Scholar]
- 4. Gurrola‐Díaz CM, Borelli MI, Przybyl AK, Garcia‐Lopez JS, Garzon DL, García‐López PM. Insulin secretion effect of 2,17‐dioxosparteine, 17‐thionosparteine, multiflorine and 17‐hydroxy‐lupanine on rat Langerhanʼs islets. In: Lupins for Health and Wealth. Proceedings of the 12th International Lupin Conference, Fremantle, Western Australia, 14‐18 September 2008. International Lupin Association; 2008: 484‐487.
- 5. Ahmed RT, Esmaiel EE. Influence of dietary lupin seed mixed diet on serum cholesterol level in normal and diabetic rabbits. Egypt J Pharm Sci. 1993;34:565‐576. [Google Scholar]
- 6. Mehranjani MS, Shariatzadeh MA, Desfulian AR, Noori M, Abnosi MH, Moghadam ZH. Effects of Medicago sativa on nephropathy in diabetic rats. Indian J Pharm Sci. 2007;69:768‐772. [Google Scholar]
- 7. Bobkiewicz‐Kozlowska T, Dworacka M, Kuczynski S, et al. Hypoglycaemic effect of quinolizidine alkaloids–lupanine and 2‐thionosparteine on non‐diabetic and streptozotocin‐induced diabetic rats. Eur J Pharmacol. 2007;565:240‐244. [DOI] [PubMed] [Google Scholar]
- 8. Wiedemann M, Gurrola‐Diaz CM, Vargas‐Guerrero B, Wink M, Garcia‐Lopez PM, Dufer M. Lupanine improves glucose homeostasis by influencing KATP channels and insulin gene expression. Molecules. 2015;20:19085‐19100. [DOI] [PMC free article] [PubMed] [Google Scholar]
- 9. Kubo H, Inoue M, Kamei J, Higashiyama K. Hypoglycemic effects of multiflorine derivatives in normal mice. Biol Pharm Bull. 2006;29:2046‐2050. [DOI] [PubMed] [Google Scholar]
- 10. Kubo H, Kobayashi J, Higashiyama K, Kamei J, Fujii Y, Ohmiya S. The hypoglycemic effect of (7R*,9aS*)‐7‐phenyl‐octahydroquinolizin‐2‐one in mice. Biol Pharm Bull. 2000;23:1114‐1117. [DOI] [PubMed] [Google Scholar]
- 11. Brunmair B, Lehner Z, Stadlbauer K, et al. 55P0110, a novel synthetic compound developed from a plant derived backbone structure, shows promising anti‐hyperglycaemic activity in mice. PLoS One. 2015;10:e0126847. [DOI] [PMC free article] [PubMed] [Google Scholar]
- 12. Stadlbauer K, Brunmair B, Lehner Z, et al. Preclinical characterization of 55P0251, a novel compound that amplifies glucose‐stimulated insulin secretion and counteracts hyperglycaemia in rodents. Diabetes Obes Metab. 2017;19:1088‐1096. [DOI] [PubMed] [Google Scholar]
- 13. Lehner Z, Stadlbauer K, Adorjan I, et al. Mechanisms of antihyperglycaemic action of efaroxan in mice: time for reappraisal of alpha2A‐adrenergic antagonism in the treatment of type 2 diabetes? Diabetologia. 2012;55:3071‐3082. [DOI] [PubMed] [Google Scholar]
- 14. Stadlbauer K, Lehner Z, Stamenkovic N, et al. Dissection of mechanisms that account for imidazoline‐induced lowering of blood glucose in mice. Eur J Pharmacol. 2014;741:178‐185. [DOI] [PubMed] [Google Scholar]
- 15. Cheng Y, Prusoff WH. Relationship between the inhibition constant (K1) and the concentration of inhibitor which causes 50 per cent inhibition (I50) of an enzymatic reaction. Biochem Pharmacol. 1973;22:3099‐3108. [DOI] [PubMed] [Google Scholar]
- 16. Laurila JM, Xhaard H, Ruuskanen JO, et al. The second extracellular loop of alpha2A‐adrenoceptors contributes to the binding of yohimbine analogues. Br J Pharmacol. 2007;151:1293‐1304. [DOI] [PMC free article] [PubMed] [Google Scholar]
- 17. Peltonen JM, Pihlavisto M, Scheinin M. Subtype‐specific stimulation of [35S]GTPgammaS binding by recombinant alpha2‐adrenoceptors. Eur J Pharmacol. 1998;355:275‐279. [DOI] [PubMed] [Google Scholar]
- 18. Virolainen S, Jansson CC, Scheinin M. Assessment of alpha2‐adrenoceptor antagonist potency with GTPase assay. Eur J Pharmacol. 1997;338:293‐296. [DOI] [PubMed] [Google Scholar]
- 19. Berridge TL, Doxey JC, Roach AG, Smith CF. Selectivity profile of the alpha 2‐adrenoceptor antagonist efaroxan in relation to plasma glucose and insulin levels in the rat. Eur J Pharmacol. 1992;213:205‐212. [DOI] [PubMed] [Google Scholar]
- 20. Velliquette RA, Ernsberger P. The role of I(1)‐imidazoline and alpha(2)‐adrenergic receptors in the modulation of glucose metabolism in the spontaneously hypertensive obese rat model of metabolic syndrome X. J Pharmacol Exp Ther. 2003;306:646‐657. [DOI] [PubMed] [Google Scholar]
- 21. Niddam R, Angel I, Bidet S, Langer SZ. Pharmacological characterization of alpha‐2 adrenergic receptor subtype involved in the release of insulin from isolated rat pancreatic islets. J Pharmacol Exp Ther. 1990;254:883‐887. [PubMed] [Google Scholar]
- 22. Devedjian JC, Pujol A, Cayla C, et al. Transgenic mice overexpressing alpha2A‐adrenoceptors in pancreatic beta‐cells show altered regulation of glucose homeostasis. Diabetologia. 2000;43:899‐906. [DOI] [PubMed] [Google Scholar]
- 23. Savontaus E, Fagerholm V, Rahkonen O, Scheinin M. Reduced blood glucose levels, increased insulin levels and improved glucose tolerance in alpha2A‐adrenoceptor knockout mice. Eur J Pharmacol. 2008;578:359‐364. [DOI] [PubMed] [Google Scholar]
- 24. Fagerholm V, Gronroos T, Marjamaki P, Viljanen T, Scheinin M, Haaparanta M. Altered glucose homeostasis in alpha2A‐adrenoceptor knockout mice. Eur J Pharmacol. 2004;505:243‐252. [DOI] [PubMed] [Google Scholar]
- 25. Chotani MA, Flavahan S, Mitra S, Daunt D, Flavahan NA. Silent alpha(2C)‐adrenergic receptors enable cold‐induced vasoconstriction in cutaneous arteries. Am J Physiol Heart Circ Physiol. 2000;278:H1075‐H1083. [DOI] [PubMed] [Google Scholar]
- 26. Crassous PA, Flavahan S, Flavahan NA. Acute dilation to alpha(2)‐adrenoceptor antagonists uncovers dual constriction and dilation mediated by arterial alpha(2)‐adrenoceptors. Br J Pharmacol. 2009;158:1344‐1355. [DOI] [PMC free article] [PubMed] [Google Scholar]
- 27. Flavahan NA. Phenylpropanolamine constricts mouse and human blood vessels by preferentially activating alpha2‐adrenoceptors. J Pharmacol Exp Ther. 2005;313:432‐439. [DOI] [PubMed] [Google Scholar]
- 28. Hocker J, Gruenewald M, Meybohm P, et al. Nefopam but not physostigmine affects the thermoregulatory response in mice via alpha(2)‐adrenoceptors. Neuropharmacology. 2010;58:495‐500. [DOI] [PubMed] [Google Scholar]
- 29. Rustenbeck I, Kopp M, Ratzka P, Leupolt L, Hasselblatt A. Imidazolines and the pancreatic B‐cell. Actions and binding sites. Ann N Y Acad Sci. 1999;881:229‐240. [DOI] [PubMed] [Google Scholar]
- 30. Hatlapatka K, Wienbergen A, Kuhne C, Jorns A, Willenborg M, Rustenbeck I. Selective enhancement of nutrient‐induced insulin secretion by ATP‐sensitive K+ channel‐blocking imidazolines. J Pharmacol Exp Ther. 2009;331:1033‐1041. [DOI] [PubMed] [Google Scholar]
- 31. Proks P, Ashcroft FM. Phentolamine block of KATP channels is mediated by Kir6.2. Proc Natl Acad Sci U S A. 1997;94:11716‐11720. [DOI] [PMC free article] [PubMed] [Google Scholar]
- 32. Szollosi A, Nenquin M, Henquin JC. Pharmacological stimulation and inhibition of insulin secretion in mouse islets lacking ATP‐sensitive K+ channels. Br J Pharmacol. 2010;159:669‐677. [DOI] [PMC free article] [PubMed] [Google Scholar]
- 33. Rosengren AH, Jokubka R, Tojjar D, et al. Overexpression of alpha2A‐adrenergic receptors contributes to type 2 diabetes. Science. 2010;327:217‐220. [DOI] [PubMed] [Google Scholar]
- 34. Gribble FM. Alpha2A‐adrenergic receptors and type 2 diabetes. N Engl J Med. 2010;362:361‐362. [DOI] [PubMed] [Google Scholar]
- 35. Liggett SB. Alpha2A‐adrenergic receptors in the genetics, pathogenesis, and treatment of type 2 diabetes. Sci Transl Med. 2009;1:12ps15. [DOI] [PubMed] [Google Scholar]
- 36. Wess J. More is not always better: alpha2A‐adrenoceptor expression in type 2 diabetes. Cell Metab. 2010;11:3‐5. [DOI] [PubMed] [Google Scholar]
Associated Data
This section collects any data citations, data availability statements, or supplementary materials included in this article.
Supplementary Materials
Figure S1. XXX
Table S1. Effect of 55P0251 on cAMP release from RINm5F cells in vitro: The experiment was performed by a commercial provider (Pharmacelsus, Saarbrücken, Germany). In short, RINm5F cells (a rat insulinoma cell line) were exposed to the indicated concentrations of 55P0251, exendin‐4, or GLP‐1 (the latter two serving as positive controls). After exposure, released cAMP was determined in the cell lysates (Cyclic AMP Direct ELISA Kit, Assay Designs, Ann Arbour, MA, USA). The data were normalized to basal cAMP release of untreated control cells. Experiments were performed in triplicate; *P < .05 by one sample t test.
Table S2. A, Agonist activity at the human the α2‐adrenoceptor subtypes as indicated by comparison of serial concentrations of 55P0251, 55P0297, and 55P0399 (0.1, 0.3, 1, 3, and 10 μmoL/L) to the full agonist (−)‐noradrenaline (0.0001, 0.001, 0.01, 0.1, 1, 10, 100, and 300 μmoL/L). Determined by stimulation of [35S]GTPγS binding; results from two independent runs. The results provide no evidence for agonist activity by 55P0251, 55P0297, or 55P0399. B, Two independent experimental runs of the [35S]GTPγS binding assay protocol, from which functional antagonism (as given in Table 1) was calculated. In the presence of 1 μmol/L of 55P0251, 55P0297, and 55P0399, different concentrations of the agonist (‐)‐noradrenaline were added (0.0001, 0.001, 0.01, 0.1, 1, 10, 100, and 300 μmol/L). The results provide evidence for antagonist activity by 55P0297 > 55P0251 > 55P0399.
Table S3. Preliminary assessment of displacement binding at various structures of 55P0251, 55P0297 and 55P0399 (used at 10 μmoL/L) as reported by a commercial provider (MDS Pharma Services, King of Prussia, PA, USA; later acquired by Ricerca). Results were obtained with radioligand binding assays, except for CYPs, where enzyme assays with spectrofluorimetric quantitation of 3‐cyano‐7‐hydroxycoumarin or 7‐fydroxy‐4‐(trifluoromethyl)‐coumarin (for CYP450, 3A4) were used. nd, not determined