

Abstract
Background
Sodium deficiency in patients with an ileostomy is associated with chronic dehydration and may be difficult to detect. We aimed to investigate if the sodium concentration in a single spot urine sample may be used as a proxy for 24‐hour urine sodium excretion.
Methods
In a prospective observational study with 8 patients with an ileostomy and 8 volunteers with intact intestines, we investigated the correlations and agreements between spot urine sodium concentrations and 24‐hour urine sodium excretions. Spot urine samples were drawn from every micturition during 24 hours, and relevant blood samples were drawn. All participants documented their food and fluid intakes.
Results
There was a high and statistically significant correlation between 24‐hour natriuresis and urine sodium concentrations in both morning spot samples (n = 8, Spearman's rho [ρ] = 0.78, P = 0.03) and midday spot samples (n = 8, ρ = 0.82, P = 0.02) in the patients with an ileostomy. The agreement between methods was fair (bias = −1.5, limits of agreement = −32.3 to 29.4). There were no statistically significant associations for evening samples or for samples from volunteers with intact intestines independently of time of day.
Conclusion
A single spot urine sodium sample obtained in the morning or midday may estimate 24‐hour urine sodium excretion in patients with an ileostomy and thus help to identify sodium depletion.
Keywords: dehydration, ileostomy, natriuresis, short bowel syndrome, water‐electrolyte balance
Clinical Relevancy Statement
Sodium depletion is a frequent problem for patients with an ileostomy, even in healthy and well‐adapted patients without small bowel resections. Early detection and treatment may potentially improve the patients’ well‐being and renal function. Our data suggest that a single urine sample may support clinical indications of sodium depletion, potentially making the procedure of 24‐hour urine sampling dispensable. This is relevant for doctors, nurses, and clinical dietitians who take care of ileostomates and may be helpful during clinical assessment for risk of sodium depletion.
Introduction
Sodium and fluid depletion is common among patients with an ileostomy and occur secondary to increased gastrointestinal losses.1, 2, 3, 4 The patients frequently have a high ileostomy output and may require transient or continuous treatment.5 There may be substantial variations in needs of energy, fluids, and electrolytes following intestinal resections, and balances can be difficult to manage.6 Sodium depletion may occur despite repetitive administrations of intravenous fluids. Sodium deficiency and chronic dehydration are associated with decreased nutrition and bone status3 and can cause renal damage.7, 8 In infants, sodium depletion may cause metabolic acidosis and impaired growth.9 In healthy volunteers, experimentally induced sodium depletion was followed by a decreased ability to taste, anorexia, nausea, cramps, exhaustion, and impaired mental functions, as well as weight loss and a negative nitrogen balance.10 Although patients with an ileostomy may appear healthy and have normal plasma sodium values,1, 3, 11, 12 careful interviewing may reveal such symptoms, and symptoms resolve following sodium repletion.13
Sodium and fluid balances are mainly regulated renally through neurohumoral and pressure‐mediated mechanisms as a response to the total body sodium and the effective extracellular volume. Renal sodium and fluid excretion normally reflects dietary intake.14, 15 A decrease in sodium intake increases renin synthesis, which initiates the renin‐angiotensin‐aldosterone system.16 Aldosterone increases the number of active epithelial sodium channels in the distal nephron and collecting tubules and thereby participates in sodium balance regulation by increasing the renal sodium reabsorption.17, 18 Following a colectomy, a low urine sodium excretion may be an early predictor of sodium depletion,19, 20 and an inverse correlation between stomal sodium loss and renal sodium excretion has been identified.21 In persons with intact intestines, urine sodium excretion normally ranges from 114 to 210 mmol/d.22 Normally, a 24‐hour urine collection is needed to assess the sodium balance. This method is time‐consuming, inconvenient to the patient, and prone to an incomplete collection of all micturitions. Instead, analysis of the correlation with spot urine values has been proposed.3 In this study, we aimed to investigate if a single spot urine sample may be used as a proxy for 24‐hour natriuresis in patients with an ileostomy.
Methods
Study Design and Participants
In this prospective, observational study, we included 16 adult individuals: 8 stable patients with an ileostomy and 8 healthy volunteers with intact intestines. The ileostomates were recruited consecutively by asking patients in contact with the outpatient clinic at Aarhus University Hospital, Denmark, and members at the Colostomy Patient Association (COPA). Ileostomates were enrolled if they were weight stable and did not receive supplementary parenteral nutrition or fluid. The healthy volunteers with intact intestines were recruited from the hospital staff. Exclusion criteria were diabetes mellitus, chronic kidney disease, and pregnancy.
Blood Samples
Venous blood samples were drawn in the morning, following >3 hours of fasting. Plasma aldosterone levels were measured in seated positions, without standardizing mobility degree or dietary intake.
Collection of Urine
Ileostomates and volunteers with intact intestines collected 24‐hour urine in 3000‐mL polyethylene urine containers (Sarstedt, Nümbrecht, Germany). They were instructed to dismiss the first urine portion and include the last exactly 24 hours after the first micturition. For every urine portion within the 24 hours, each participant urinated in 500 mL plastic cups, drew a 10 mL spot urine sample with a syringe (Monovette Sarstedt, Nümbrecht, Germany), and poured the remaining urine into the 3000‐mL container. The urine was kept at room temperature for maximum 48 hours or cooled to 5 °C, prior to analyses. Urine volume (mL) was determined by the same investigator each time, using an integrated scale on the container, and adding the volume from the spot samples. Likewise, the amount of sodium in each sample was added to the 24‐hour natriuresis. A 10‐mL sample was drawn from the container after the content had been mixed, and all samples were analyzed for sodium content with a Cobas 6000 (Roche Diagnostics, Hoffmann‐La Roche, Basel, Switzerland). This device could not accurately measure very low concentrations, and sodium values reported as 20 mmol/L may have been lower.
Ileostomy Output
The ileostomates weighed their stomal output on a kitchen scale (2 kg/1 g, Funktion, Viborg, Denmark) during the 24 hours.
Sodium and Fluid Intake
All participants registered their food and fluid intake in estimated or weighed food records during the same 24 hours as they collected urine. Dietary intake was analyzed with the software VITAKOST 2018 (Canova ApS, Kolding, Denmark) by a registered dietitian.
Ethical Approval
This study was approved by the Central Denmark Regional Committee on Health Research Ethics (j.no. 1‐10‐223 72‐12‐17 for ileostomates, and j.no. 1‐10‐72‐290‐16 for healthy volunteers with intact intestines), and the Danish Data Protection Agency (j.no. 1‐16‐02‐627‐16). Informed consent was obtained following written and oral information about the study. The investigation was in accordance with the principles of the Helsinki Declaration (ClinicalTrials.gov identifier: NCT03348709).
Statistical Analysis
As a clinically minimal relevant difference between natriuresis in persons with intact intestines and patients with an ileostomy, we chose to use 2 standard deviations (2 × 25 mmol/d) of mean natriuresis (159 mmol/d) found in the literature.22 We used 0.05 for type I error and 0.20 for type II error (80% power), and the sample size calculation23 indicated that 6 participants were needed in each group. We prepared for a possible dropout rate of 25% and included 8 participants in each group. To investigate possible differences between the 2 groups, we used 2‐tailed Mann‐Whitney U tests. Median (range) was reported for descriptive analyses. Correlation analyses were tested by the Spearman rank correlation coefficient and reported with Spearman's rho (ρ). We stratified the spot urine samples according to time of day of the micturition and conducted the analyses with sodium concentration (mmol/L) in the spot samples against the 24‐hour natriuresis (mmol/d). To ensure that each participant contributed equally to the analyses, we included 1 spot sample per participant in each of the analyses. Initially, we selected 3 samples from each participant: a morning, midday, and evening sample. The morning sample was from the first micturition between 5 and 9 AM, and the midday sample was from the micturition closest to 12 PM, whereas the evening sample was from the micturition closest to 8 PM. These analyses were cross‐checked with randomly selected spot urine samples (the one closest to 8 AM, 2 PM, and 6 PM, and the last sample before midnight). Bland‐Altman analyses were performed to assess agreement of methods. Statistical analyses were conducted with GraphPad Prism 7.0 (GraphPad Software, San Diego, CA, USA).
Results
Participant Characterization
The 8 patients with an ileostomy resembled typical healthy and stable ileostomates who did not receive home parenteral nutrition or fluid support. Regular medication use comprised loperamide (n = 3), proton pump inhibitors (n = 4), and adalimumab (n = 1). Two patients consumed oral rehydration solutions during the investigation (number 4: 600 mL/d, and number 6: 400 mL/d). No patients used sodium supplements. The ileostomates were older (median 64 [range 25–76] years) than the volunteers with intact intestines (median 42 [24–65] years) (P = 0.03). The groups had comparable distributions of sex, age, height, weight, and body mass index (Table 1). All patients had normal plasma sodium (median 141 [137–143] mmol/L, reference range: 137–145 mmol/L). Plasma magnesium levels were low (median 0.77 [0.72–0.91] mmol/L) but within reference range (0.70–1.10 mmol/L). Creatinine clearance was normal for all participants except for 2 ileostomates (number 7: 56 mL/min, and number 8: 53 mL/min, reference range 70–150 mL/min). There were no statistically significant differences in fluid intake (Figure 1A) or sodium intake (Figure 1B). The ileostomates had a statistically significantly lower 24‐hour urine volume (median 1065 [580–1680] mL/d) than volunteers with intact intestines (median 2610 [1580–4710] mL/d) (P = 0.0003) (Figure 1C). Natriuresis was statistically significantly lower among ileostomates (median 53 [20–99] mmol/d) than in healthy volunteers with intact intestines (median 175 [76–264] mmol/d, P = 0.0006) (Figure 1D).
Table 1.
Participant Characteristics
| Group | No. | Age, years | Sex | Weight, kg | Height, cm | BMI, kg/m2 | Fluid Intake, mL/d | Urine, mL/d | Sodium Intake, mmol/d | Natriuresis, mmol/L | Natriuresis, mmol/d | Estimated Bowel Length, cm | Stomal Output, g/d | Years With Stoma | Primary Disease |
|---|---|---|---|---|---|---|---|---|---|---|---|---|---|---|---|
| Ileostomates | 1 | 66 | M | 85 | 180 | 26 | 2500 | 1000 | 176 | <20 | <20 | 350 | 1058 | 44 | UC |
| 2 | 52 | F | 98 | 175 | 32 | 2300 | 1280 | 104 | <20 | <26 | 350 | 1234 | 13 | UC | |
| 3 | 71 | F | 67 | 157 | 27 | 1250 | 720 | 107 | 92 | 70 | 350 | 439 | 37 | UC | |
| 4 | 62 | F | 97 | 160 | 38 | 1820 | 1130 | 175 | 82 | 99 | 150 | 1205 | 10 | CD | |
| 5 | 25 | M | 87 | 172 | 29 | 3150 | 1680 | 180 | <20 | <35 | 320 | 967 | 6 | CD | |
| 6 | 47 | M | 74 | 172 | 25 | 2450 | 580 | 247 | 116 | 71 | 230 | 2007 | 6 | UC | |
| 7 | 73 | F | 69 | 176 | 22 | 1750 | 950 | 143 | 37 | 37 | 340 | 736 | 9 | Cancer | |
| 8 | 76 | F | 50 | 153 | 21 | 1445 | 1530 | 85 | 50 | 86 | 200 | 1108 | 49 | UC | |
| Median (range) | 64 (25–76) | 80 (50–98) | 172 (153–180) | 27 (21–38) | 1960 (1250–3150) | 1065 (580–1680) | 159 (85–247) | 44 (20–116) | 53 (20–99) | 1083 (439–2007) | 12 (6–49) | ||||
| Healthy volunteers with intact intestines | 1 | 25 | M | 77 | 181 | 24 | 3130 | 3040 | 297 | 84 | 264 | ||||
| 2 | 48 | M | 82 | 186 | 24 | 1550 | 1790 | 167 | 106 | 199 | |||||
| 3 | 48 | F | 60 | 173 | 20 | 1950 | 1580 | 109 | 71 | 116 | |||||
| 4 | 65 | M | 88 | 176 | 28 | 2217 | 2300 | 202 | 77 | 187 | |||||
| 5 | 25 | F | 58 | 165 | 22 | 3410 | 2920 | 100 | 39 | 118 | |||||
| 6 | 49 | F | 55 | 163 | 21 | 2631 | 2070 | 91 | 34 | 72 | |||||
| 7 | 36 | F | 62 | 162 | 24 | 5800 | 4710 | 124 | 44 | 214 | |||||
| 8 | 24 | F | 54 | 160 | 21 | 4400 | 4310 | 184 | 37 | 164 | |||||
| Median (range) | 42 (24–65) | 61 (54–88 | 169 (160–186) | 23 (20–28) | 2881 (1550–5800) | 2610 (1580–4710) | 146 (91–297) | 58 (34–106) | 176 (72–264) |
BMI, body mass index; CD, Crohn's disease; F, female; M, male; UC, ulcerative colitis.
Descriptive data of the patients with an ileostomy and the healthy volunteers with intact intestines are presented with median (range) below variables for each group. Total small bowel length was estimated to be 350 cm, if no postresection measurements were noted, and 3 patients had a colectomy performed without ileal resections.
Figure 1.
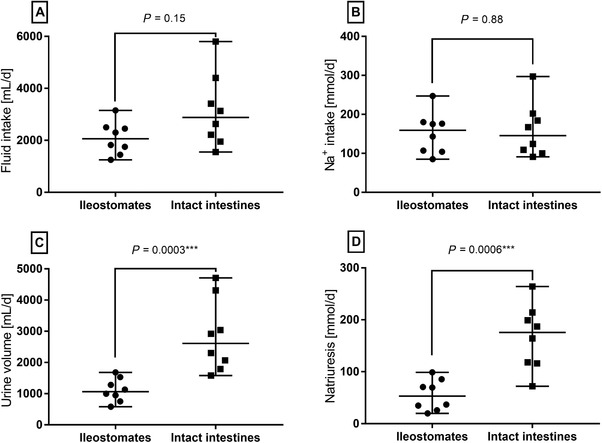
Intake of fluid (A) and sodium (B) were similar between groups, but patients with an ileostomy had statistically significantly lower urine volume (C) and natriuresis (D) than healthy volunteers with intact intestines (Mann‐Whitney tests, n = 8 in each group).
Correlation Between Spot Urine Sodium Concentration and 24‐hour Natriuresis
We observed a strong and statistically significant correlation between the ileostomates’ 24‐hour natriuresis and their morning spot urine samples (ρ = 0.78, P = 0.03) as well as their midday sample (ρ = 0.82, P = 0.02). Analysis of the evening spot urine samples indicated an association, but it was not statistically significant (ρ = 0.68, P = 0.07) (Figure 2A). The correlations were equally strong and statistically significant if other urine spot samples from ileostomates were chosen from morning, midday, or afternoon micturitions, whereas there was no association between the last sample before midnight and 24‐hour natriuresis (data not shown). We found no association between 24‐hour natriuresis and any of the spot urine samples in the healthy volunteers with intact intestines (Figure 2B). Bland‐Altman analyses of ileostomates’ morning spot samples plotted against 24‐hour natriuresis indicated good agreement between the 2 methods (Figure 2C). We observed the same trend for Bland‐Altman analyses as for the correlation analyses, as bias and limits of agreement were fair during the day, and in the evening the discrepancies were larger (data not shown). In healthy volunteers with intact intestines, the Bland‐Altman plot revealed a tendency for spot samples to underestimate 24‐hour natriuresis and a large discrepancy between methods (Figure 2D). All ileostomates (n = 8) had a natriuresis below normal (114–220 mmol/d), and half (n = 4) had values below the minimum reference range (50 mmol/d) (Figure 2E). In volunteers with intact intestines, the renal sodium excretion was above the minimum range for all (n = 8) and above normal for 1 (Figure 2F).
Figure 2.
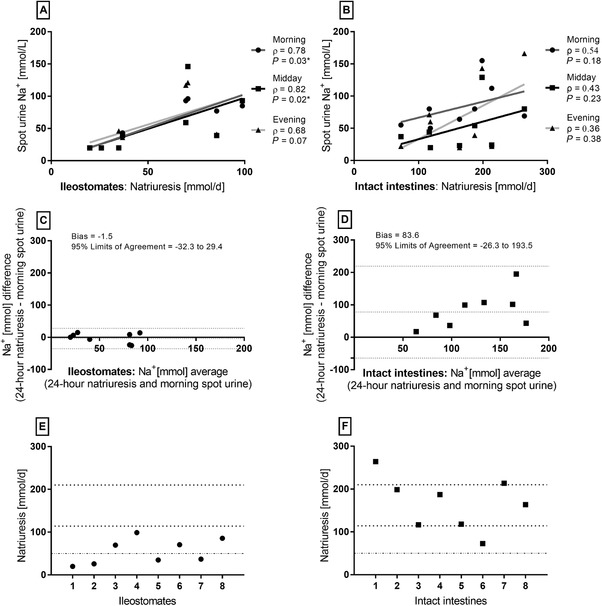
Morning and midday spot urine samples were highly correlated with 24‐hour natriuresis for patients with an ileostomy (A), whereas no associations were observed for the healthy volunteers with intact intestines (B) (Spearman's rho [ρ], n = 8). Bland‐Altman plots of 24‐hour natriuresis and morning spot samples showed good agreement between methods for ileostomates (B) but not for healthy volunteers (C). Each participants’ 24‐hour natriuresis is presented (E and F) with indications of normal range (114–210 mmol/d) and minimum reference range (50 mmol/d).
In ileostomy patients, 41% (21 of 51) of the spot samples had sodium levels ≤20 mmol/L, whereas this figure was 4% (3 of 72) in the samples from the healthy volunteers. The ileostomates had less variation in sodium concentrations in their spot urine samples and a lower total count of micturitions than healthy volunteers. The pooled sodium concentrations were median 29 (20–146) mmol/L (Figure 3A) in ileostomates and median 58 (20–185) mmol/L in volunteers with intact intestines (Figure 3B). When comparing the sodium in spot urine samples between groups, the values were statistically significantly lower in patients with an ileostomy (P = 0.0003) (Figure 3).
Figure 3.
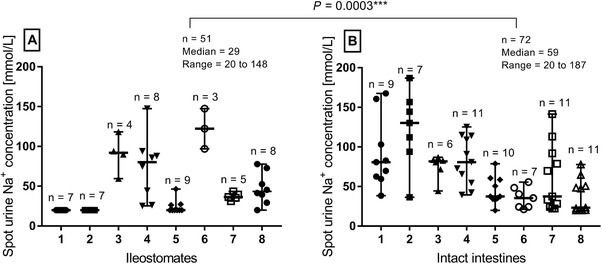
The individual variation of sodium concentration in spot urine samples was lower in patients with an ileostomy (A) than in healthy volunteers with intact intestines (B) (Mann‐Whitney test). Spot samples were collected from every micturition during 24 hours for each participant, and 41% of the samples were ≤20 mmol/L among ileostomates, whereas 4% of the samples from healthy volunteers were ≤20 mmol/L.
Aldosterone Levels, Osmolality, and Sodium Administration
In ileostomates, we observed a statistically significant strong inverse correlation between plasma aldosterone levels and 24‐hour natriuresis (ρ = −0.86, P = 0.024, n = 7). Two patients with an ileostomy had abnormally high aldosterone levels (number 1: 3171 pmol/L, and number 5: 2551 pmol/L, non‐resting reference range: 102–1197 pmol/L). These 2 patients had a high intake (>1000 mL) of hypo‐osmolar beverages and a low intake (<500 mL) of iso‐osmolar beverages. The lowest aldosterone levels were found in the only 4 ileostomates who had a low intake (<1000 mL) of hypo‐osmolar fluids (number 3: 628 pmol/L, number 4: 453 pmol/L, number 6: 228 pmol/L, and number 8: 335 pmol/L). No correlation between sodium intake and plasma aldosterone was identified (ρ = 0.11, P = 0.84, n = 7).
There was no statistically significant difference in urine osmolality in morning spot samples, although it was slightly higher in ileostomates (median 758 [413–1156] mOsm/kg) than in volunteers with intact intestines (median 626 [445–1019] mOsm/kg) (P = 0.13).
We observed no association between oral sodium intake and 24‐hour natriuresis for the ileostomates (Figure 4A), whereas the correlation was strong and statistically significant in healthy volunteers with intact intestines (Figure 4B).
Figure 4.
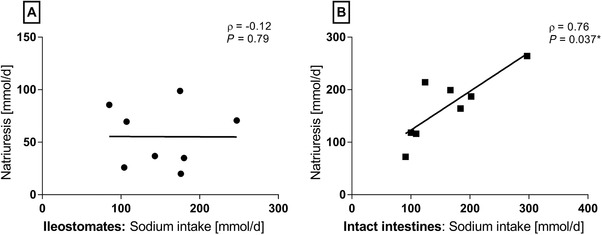
No association between sodium intake and natriuresis for patients with an ileostomy (n = 8) were identified (A), whereas this correlation was strong for the healthy volunteers with intact intestines (B) (Spearman's rho [ρ], n = 8).
When stratifying fluid intake according to osmolality, there was a strong and statistically significant inverse correlation between intake of hypo‐osmolar fluids (water, coffee, and tea) and natriuresis in ileostomates (Figure 5A). There was a tendency to a positive correlation between intake of iso‐osmolar fluids (oral rehydration solutions and milk) and natriuresis (Figure 5B). Most of the ileostomates (n = 5) had an intake of hyperosmolar fluids (soft drinks, fruit juices, lemonade, and sugar‐sweetened milk‐based drinks) below 200 mL/d, which was not associated with natriuresis (ρ = 0.22, P = 0.617).
Figure 5.
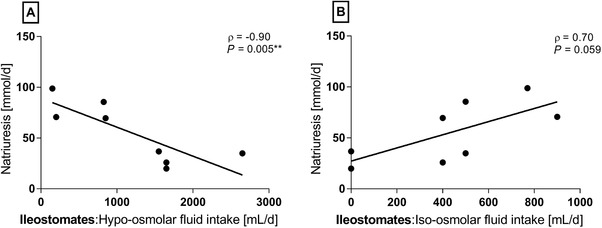
For patients with an ileostomy, there was a strong and statistically significant inverse correlation between intake of hypo‐osmolar fluids and natriuresis and a tendency to a positive association between intake of iso‐osmolar fluids (Spearman's rho [ρ], n = 8).
We found no associations between sodium intake and ileostomy output (ρ = 0.17, P = 0.70) or between ileostomy output and urine volume (ρ = 0.02, P = 0.98).
Discussion
In the present study, we demonstrate that a single spot urine sodium sample may validly estimate 24‐hour natriuresis in patients with an ileostomy if the sample is collected during the daytime. In persons with intact intestines, spot urine samples are not useful as an indication for 24‐hour natriuresis because of large variations in their spot samples and a direct influence from oral sodium intake.
The use of a single spot urine sample to identify sodium depletion, normally indicated by levels below 20 mmol/L, in patients with an ileostomy is often recommended without references.19, 20, 21, 24 This method has been practiced for decades in some specialized centers. Our data confirm this clinical experience, but the small sample size calls for a confirmatory study. Our findings further suggest that time of day influences the association between spot samples and analysis from 24‐hour urine collection. This is in accordance with other studies and is explained by the circadian rhythms of natriuresis.25 Several studies investigated the use of spot urine samples in humans with intact intestines, usually to assess population sodium intake, and they conclude that it is a useful method if corrected with different equations.26, 27, 28 However, methods and results are inconsistent,29, 30 and Rhee et al state that a single spot sample is insufficient to assess 24‐hour natriuresis.31 Our findings are consistent with the discrepancy regarding volunteers with intact intestines, but the agreement of methods is considerably stronger in ileostomates. A low spot sodium concentration predominantly represents a low 24‐hour natriuresis in ileostomates, whereas healthy persons with intact intestines may have low spot sodium concentrations and a high 24‐hour natriuresis.
Morning or midday spot samples can help identify sodium depletion in patients with an ileostomy, and the spot samples may be useful for treatment evaluation as well. If sodium depletion is identified, it may be treated with parenteral fluid support or with dietetic advices such as restriction of hypo‐osmolar and hyperosmolar beverages, increased intake of oral rehydration solutions, and sodium loading. Natriuresis has been shown to increase, whereas aldosterone levels decrease, when administering 1000 mL/d of a glucose/electrolyte solution32 or 250 mmol sodium/d.33
In the present study, plasma aldosterone was inversely related to 24‐hour natriuresis, and 2 ileostomates had abnormally high plasma aldosterone levels, indicating secondary hyperaldosteronism. A low sodium intake induces an antinatriuretic response by activation of the renin‐angiotensin‐aldosterone system.34 Aldosterone is the primary hormonal factor in short‐term sodium regulation and is responsible for regulation of sodium reabsorption in the distal nephron. The hormone increases epithelial exchange of sodium and potassium, thereby increasing renal sodium conservation as well as fluid reabsorption. In this manner, nearly all sodium that reaches the distal nephron may be reabsorbed in extreme conditions in order to maintain sodium balance.35 Because a negative sodium balance inhibits renal sodium excretion through the effects of aldosterone, very low urine sodium values can be either an early warning sign or an indication of severe chronic sodium depletion. Measurements of aldosterone are recommended to assess sodium depletion severity in patients with an ileostomy.19 Beside measuring urine sodium and aldosterone levels, it is recommended to measure plasma magnesium levels.36 Aldosterone is presumed to increase renal magnesium excretion,37 and although magnesium status is not precisely estimated through plasma magnesium values,38 low plasma values may indicate severe magnesium depletion. The ileostomates included in this study presented normal plasma magnesium levels, albeit the levels were low within the reference range. Normalizing the sodium balance could potentially normalize aldosterone levels and thereby reduce potential magnesium loss, although a sufficient intake should be considered as well.
In healthy volunteers with intact intestines, the correlation between sodium intake and renal excretion was strong, but this was not the case for the ileostomates. Some of our analyses were inconclusive, but they indicate that the osmolality of a beverage may have a greater impact on ileostomates’ sodium balance than their total sodium intake. This should be investigated in future studies, as well as the effects of oral sodium administration in different doses. Further investigations may also evaluate whether 20 mmol sodium/L is too conservative a limit for indication of treatment. Ng et al has demonstrated that patients with an ileostomy who had a natriuresis below 100 mmol/d present lower urine volume, urinary calcium and magnesium levels, body mass index, lean body mass, and bone status than ileostomates with a higher natriuresis.3
Assessment of sodium balance presupposes normal kidney function, and we found creatinine clearance to be normal in all but 2 participants. These 2 patients were the oldest participants in this study and did not have the lowest levels of natriuresis. We have no reason to suspect that a decreased renal function is responsible for a low natriuresis in the ileostomy patients, and we expect that it is solely explained by a negative sodium balance.
Sodium depletion and dehydration should be monitored and treated to prevent both life‐threatening states, such as kidney failure, as well as fatigue and other symptoms that may negatively impact the patients’ general well‐being. Dependency on home parenteral nutrition or fluid may decrease quality of life,39 and we anticipate that the patients would rather modify their oral fluid intake than be admitted regularly to receive parenteral fluid support. Some studies recommend ileostomates to aim for a dietary sodium intake of 250 mmol/d,13, 19 corresponding to 14.6 g table salt/d. A recent cross‐sectional study assessed sodium intake in 40 ileostomates to be 76 (±58) mmol sodium/d,40 which seems low in comparison. It may be problematic if ileostomates comply to the general health recommendations to decrease sodium intake, particularly if they mainly ingest hypo‐osmolar fluids. Although our results regarding total sodium intake were inconclusive, it is clinically important if the fluid intake rather than the diet‐related sodium intake drives sodium absorption in patients with an ileostomy. A range of parameters, including habitual diet intake, may have affected the ileostomates’ postresection adaptation,41 which in combination with beverage osmolality could potentially explain why different patients have various reactions to sodium intake.
Our study has important limitations. Food records and the related dietary calculations may introduce both systematic and random errors. Underreporting dietary intake is a common issue,42 and discretionary sodium intake is particularly difficult to estimate accurately. There are reasonably no differences between the ileostomates and the healthy volunteers in this regard. Routine laboratory equipment could not detect urine sodium levels below 20 mmol/L, and the patients’ renal sodium excretion may have been considerably lower. The identical values assigned to concentrations ≤20 mmol/L may have made the correlation analyses appear stronger than they would have been with the exact values; however, a discrepancy of 20 mmol would still result in an acceptable agreement of methods and does not change the conclusion. The small sample size rendered some correlation analyses statistically insignificant, yet 8 participants were sufficient to demonstrate statistical significance in all main correlations. Because the small sample size would tend to bias our results toward the null hypothesis, that is, no difference, we believe that this limitation strengthens our results.
In conclusion, we found that a single spot urine sodium sample during the daytime was correlated with 24‐hour natriuresis in a small sample of patients with an ileostomy. Our data suggest that spot urine samples may help to identify sodium depletion in patients with an ileostomy and could prove helpful in addition to clinical indices. Because blood samples are insufficient to determine sodium balance, it may be recommendable to evaluate both clinical and laboratory data, including urine sampling, when assessing their sodium balance.
Statement of Authorship
C. Rud, A. K. N. Pedersen, T. L. Wilkens, M. Borre, and C. L. Hvas contributed to conception and design of the research; C. Rud contributed to acquisition of the data; A. K. N. Pedersen, C. Rud, J. R. Andersen, J. F. Dahlerup, and C. L. Hvas contributed to the analysis and interpretation of the data; and C. Rud and A. K. N. Pedersen drafted the manuscript. All authors critically revised the manuscript and agree to be fully accountable for ensuring the integrity and accuracy of the work. All authors read and approved the final manuscript.
Financial disclosure: This work was supported by the Colitis Crohn Foundation Denmark and the Aase and Ejnar Danielsen's Foundation.
Conflicts of interest: J.F. Dahlerup reports lecture fees unrelated to the present publication from Pharmacosmos, Takeda, and MSD. C.L. Hvas reports lecture fees unrelated to the present publication from Takeda, Arla Foods Ingredients, MSD, and Ferring. All other authors declare that they have no conflicts of interest.
References
- 1. Ladefoged K, Olgaard K. Sodium homeostasis after small‐bowel resection. Scand J Gastroenterol. 1985;20(3):361‐369. [DOI] [PubMed] [Google Scholar]
- 2. Gallagher N, Harrison D, Skyring A. Fluid and electrolyte disturbances in patients with long‐established ileostomies. Gut.1962;3(3):219‐223. [DOI] [PMC free article] [PubMed] [Google Scholar]
- 3. Ng DHL, Pither CAR, Wootton SA, Stroud MA. The “not so short‐bowel syndrome”: potential health problems in patients with an ileostomy. Color Dis. 2013;15(9):1154‐1161. [DOI] [PubMed] [Google Scholar]
- 4. Fish DR, Mancuso CA, Garcia‐Aguilar JE, et al. Readmission after ileostomy creation. Ann Surg. 2017;265(2):379‐387. [DOI] [PMC free article] [PubMed] [Google Scholar]
- 5. Baker ML, Williams RN, Nightingale JMD. Causes and management of a high‐output stoma. Color Dis. 2011;13(2):191‐197. [DOI] [PubMed] [Google Scholar]
- 6. Matarese LE, Jeppesen PB, O'Keefe SJD. Short bowel syndrome in adults. J Parenter Enter Nutr. 2014;38(1 Suppl):60S‐64S. [DOI] [PubMed] [Google Scholar]
- 7. Beck‐Kaltenbach N, Voigt K, Rumstadt B. Renal impairment caused by temporary loop ileostomy. Int J Colorectal Dis. 2011;26(5):623‐626. [DOI] [PubMed] [Google Scholar]
- 8. Roncal‐Jimenez C, Lanaspa MA, Jensen T, Sanchez‐Lozada LG, Johnson RJ. Mechanisms by which dehydration may lead to chronic kidney disease. Ann Nutr Metab. 2015;66(3):10‐13. [DOI] [PubMed] [Google Scholar]
- 9. Bower TR, Pringle KC, Soper RT. Sodium deficit causing decreased weight gain and metabolic acidosis in infants with ileostomy. J Pediatr Surg. 1988;23(6):567‐572. [DOI] [PubMed] [Google Scholar]
- 10. McCance RA. Medical problems in mineral metabolism. Lancet. 1936;227(5876):823‐830. [DOI] [PubMed] [Google Scholar]
- 11. Turnberg LA, Morris AI, Hawker C. Intracellular electrolyte depletion in patients with ileostomies. Gut. 1978;19(6):563‐568. [DOI] [PMC free article] [PubMed] [Google Scholar]
- 12. Kennedy HJ, Al‐Dujaili EA, Edwards CR, Truelove SC. Water and electrolyte balance in subjects with a permanent ileostomy. Gut. 1983;24(8):702‐705. [DOI] [PMC free article] [PubMed] [Google Scholar]
- 13. Haalboom JR, Poen H, Struyvenberg A, Akkermans LM, Endeman H, Roelofs JM. The effect of changes in dietary sodium content on complaints and clinical parameters of volume depletion in patients with a permanent ileostomy. Z Gastroenterol. 1987;25(3):168‐174. [PubMed] [Google Scholar]
- 14. Bie P, Wamberg S, Kjolby M. Volume natriuresis vs. pressure natriuresis. Acta Physiol Scand. 2004;181(4):495‐503. [DOI] [PubMed] [Google Scholar]
- 15. Fitzsimons JT. Angiotensin, thirst, and sodium appetite. Physiol Rev. 1998;78(3):583‐686. [DOI] [PubMed] [Google Scholar]
- 16. Schweda F. Salt feedback on the renin‐angiotensin‐aldosterone system. Pflügers Arch Eur J Physiol. 2015;467(3):565‐576. [DOI] [PubMed] [Google Scholar]
- 17. Toney GM, Vallon V, Stockand JD. Intrinsic control of sodium excretion in the distal nephron by inhibitory purinergic regulation of the epithelial Na(+) channel. Curr Opin Nephrol Hypertens. 2012;21(1):52‐60. [DOI] [PMC free article] [PubMed] [Google Scholar]
- 18. Schild L. The epithelial sodium channel and the control of sodium balance. Biochim Biophys Acta Mol Basis Dis. 2010;1802(12):1159‐1165. [DOI] [PubMed] [Google Scholar]
- 19. Delin K, Fasth S, Andersson H, Aurell M, Hultén L, Jagenburg R. Factors regulating sodium balance in proctocolectomized patients with various ileal resections. Scand J Gastroenterol. 1984;19(2):145‐149. [PubMed] [Google Scholar]
- 20. Nightingale J, Woodward JM. Guidelines for management of patients with a short bowel. Gut. 2006;55(Suppl. 4):iv1‐iv12. [DOI] [PMC free article] [PubMed] [Google Scholar]
- 21. Svaninger G, Nordgren S, Palselius IR, Fasth S, Hultén L. Sodium and potassium excretion in patients with ileostomies. Eur J Surg. 1991;157(10):601‐605. [PubMed] [Google Scholar]
- 22. McCarron DA, Kazaks AG, Geerling JC, Stern JS, Graudal NA. Normal range of human dietary sodium intake: a perspective based on 24‐hour urinary sodium excretion worldwide. Am J Hypertens. 2013;26(10):1218‐1223. [DOI] [PubMed] [Google Scholar]
- 23. Julious SA. Tutorial in biostatistics sample sizes for clinical trials with normal data. Stat Med Stat Med. 2004;23(12):1921‐1986. [DOI] [PubMed] [Google Scholar]
- 24. O'Neil M, Teitelbaum DH, Harris MB. Total body sodium depletion and poor weight gain in children and young adults with an ileostomy. Nutr Clin Pract. 2014;29(3):397‐401. [DOI] [PubMed] [Google Scholar]
- 25. Sachdeva A, Weder AB. Nocturnal sodium excretion, blood pressure dipping, and sodium sensitivity. Hypertension. 2006;48(4):527‐533. [DOI] [PubMed] [Google Scholar]
- 26. Mann SJ, Gerber LM. Estimation of 24‐hour sodium excretion from spot urine samples. J Clin Hypertens. 2010;12(3):174‐180. [DOI] [PMC free article] [PubMed] [Google Scholar]
- 27. Toft U, Cerqueira C, Andreasen AH, et al. Estimating salt intake in a Caucasian population: can spot urine substitute 24‐hour urine samples? Eur J Prev Cardiol. 2014;21(10):1300‐1307. [DOI] [PubMed] [Google Scholar]
- 28. Brown IJ, Dyer AR, Chan Q, et al. Estimating 24‐hour urinary sodium excretion from casual urinary sodium concentrations in Western populations. Am J Epidemiol. 2013;177(11):1180‐1192. [DOI] [PMC free article] [PubMed] [Google Scholar]
- 29. Ji C, Sykes L, Paul C, et al. Systematic review of studies comparing 24‐hour and spot urine collections for estimating population salt intake. Rev Panam Salud Publica. 2012;32(4):307‐15. [DOI] [PubMed] [Google Scholar]
- 30. McLean RM. Measuring population sodium intake: a review of methods. Nutrients. 2014;6(11):4651‐4662. [DOI] [PMC free article] [PubMed] [Google Scholar]
- 31. Rhee MY, Kim JH, Shin SJ, et al. Estimation of 24‐hour urinary sodium excretion using spot urine samples. Nutrients. 2014;6(6):2360‐2375. [DOI] [PMC free article] [PubMed] [Google Scholar]
- 32. Newton CR, Drury P, Gonvers JJ, McIntyre P, Preston DM, Lennard‐Jones JE. Incidence and treatment of sodium depletion in ileostomists. Scand J Gastroenterol Suppl. 1982;74:159‐160. [PubMed] [Google Scholar]
- 33. Delin K, Fasth S, Andersson H, Aurell M, Hultén L, Jagenburg R. Factors regulating sodium balance in proctocolectomized patients with various ileal resections. Scand J Gastroenterol. 1984;19(2):145‐149. [PubMed] [Google Scholar]
- 34. Antunes‐Rodrigues J, De Castro M, Elias LLK, Valenca MM, McCann SM. Neuroendocrine control of body fluid metabolism. Physiol Rev. 2004;84(1):169‐208. [DOI] [PubMed] [Google Scholar]
- 35. Rossier BC, Baker ME, Studer RA. Epithelial sodium transport and its control by aldosterone: the story of our internal environment revisited. Physiol Rev. 2015;95(1):297‐340. [DOI] [PubMed] [Google Scholar]
- 36. Oke SM, Nightingale JM, Gabe SM. Mistakes in short bowel and how to avoid them. UEG Educ. 2018:7‐11. [Google Scholar]
- 37. Horton R, Biglieri EG. Effect of aldosterone on the metabolism of magnesium. J Clin Endocrinol Metab. 1962;22(12):1187‐1192. [DOI] [PubMed] [Google Scholar]
- 38. Jahnen‐Dechent W, Ketteler M. Magnesium basics. Clin Kidney J. 2012;5(Suppl 1):i3‐14. [DOI] [PMC free article] [PubMed] [Google Scholar]
- 39. Ladefoged K. Quality of life in patients on permanent home parenteral nutrition. J Parenter Enter Nutr.1981;5(2):132‐137. [DOI] [PubMed] [Google Scholar]
- 40. de Olieira AL, Boroni Moreira AP, Pereira Netto M, Goncalves Leite IC. A cross‐sectional study of nutritional status, diet, and dietary restrictions among persons with an ileostomy or colostomy. Ostomy Wound Manag. 2018;64(5):18‐29. [PubMed] [Google Scholar]
- 41. Tappenden KA. Intestinal adaptation following resection. J Parenter Enter Nutr. 2014;38(1 Suppl):23S‐31S. [DOI] [PubMed] [Google Scholar]
- 42. Shim J‐S, Oh K, Kim HC. Dietary assessment methods in epidemiologic studies. Epidemiol Health. 2014;36:1‐8. [DOI] [PMC free article] [PubMed] [Google Scholar]