

Abstract
Aims:
Dynamic elasticity was previously identified in individuals with overactive bladder (OAB) using comparative-fill urodynamics (UD) and is a biomechanical mechanism for acutely regulating detrusor wall tension. On the basis of this data, a conceptual model of dynamic elasticity regulation mediated through a balance of passive mechanisms and active contractions was constructed. The present study tested this model by determining whether individuals with detrusor overactivity (DO) exhibit less dynamic elasticity than individuals without DO.
Methods:
Individuals with and without urgency based on International Consultation on Incontinence Questionnaire-OAB surveys were prospectively enrolled in a comparative-fill UD study. An initial fill defined the presence or absence of DO and determined cystometric capacity. Three additional fills were employed with either passive emptying via a catheter or active voiding. To identify dynamic elasticity, average filling pressures (Pves) were compared for fill 1 (before strain softening), fill 2 (after strain softening), and fill 3 (after active void). A dynamic elasticity index was defined.
Results:
From 28 participants, those without DO showed decreased Pves during filling after strain softening and restored Pves during filling following active voiding, revealing dynamic elasticity. Participants with DO did not show dynamic elasticity. A dynamic elasticity index less than 1.0 cmH2O/40% capacity was identified in 2 out of 13 participants without DO and 9 out of 15 with DO, revealing a significant association between DO and reduced/absent dynamic elasticity (P = .024).
Conclusions:
This study supports a conceptual model for dynamic elasticity, a mechanism to acutely regulate detrusor wall tension through a balance of competing active contractile and passive strain mechanisms. Improved understanding of this mechanistic model may help us to identify novel treatment strategies for OAB.
Keywords: bladder biomechanics, bladder compliance, cystometry, overactive bladder
1 |. INTRODUCTION
Urinary urgency, the key symptom of overactive bladder (OAB), may be associated with alterations in detrusor wall tension in some individuals because tension-sensitive afferent nerves are in-series with detrusor smooth muscle cells.1 Detrusor wall tension is a function of bladder volume, pressure, shape, and its material properties2 that cannot be directly measured using standard urodynamic techniques; rather, it can be roughly estimated by calculating bladder compliance, defined as the ratio of the change in volume to the change in pressure during a urodynamic (UD) fill.3 Previously, detrusor compliance was believed to be a static property that could only be altered through chronic, pathologic conditions, such as bladder outlet obstruction.4
However, a comparative-fill UDs protocol, in which multiple UD fill-void cycles were performed and compared in a single setting, was recently used to demonstrate that bladder compliance can be acutely regulated through a process known as dynamic elasticity.5 Dynamic elasticity is characterized by a reduction in vesical pressure (Pves) (loss of elasticity) during a bladder fill due to strain-induced stress softening (strain softening) caused by previous filling and passive emptying of the bladder through the UDs catheter, and a return of Pves (restoration of elasticity) during a fill caused by previous active voiding.5 A loss of elasticity associated with filling and passive emptying can also be seen by stretching a latex balloon before inflating it. This stretching breaks connections between latex polymers, resulting in a loss of wall tension during subsequent filling. However, unlike a latex balloon in which the loss of tension is irreversible, active voiding of the bladder re-establishes broken actin-myosin connections which lead to restored tension.6–9 Thus, dynamic elasticity represents a biomechanical mechanism to acutely regulate detrusor wall tension.
Dynamic elasticity is the clinical correlate of adjustable preload tension, which has been identified in preclinical studies using detrusor strips in rabbits6,7,9 and humans10 and isolated whole bladders from mice.8 Detrusor strips from animals11,12 and humans13,14 exhibit spontaneous rhythmic contractions that have been shown to regulate adjustable preload tension likely through active re-establishment of actin-myosin connections.6,7 Furthermore, spontaneous rhythmic contractions, also called micomotion15 or autonomous activity,12 are elevated in detrusor muscle from patients with detrusor overactivity (DO)14 and elevations in localized micromotions have been associated with urgency.16
Together, these studies suggest a mechanistic link between dynamic elasticity and DO. In this regard, a conceptual biomechanical model, similar to that proposed by van Duyl,17 was constructed (Figure 1A) in which bladder dynamic elasticity is regulated by a balance of mechanisms. In this model, dynamic elasticity is decreased by passive forces, such as stretch during filling, which breaks or cause the release of actin-myosin connections, and dynamic elasticity is increased by active contractions, which re-establish actin-myosin connections and that provide restored tension during subsequent filling. During normal filling, subclinical micromotions regulate tension to maintain optimal bladder biomechanics. However, in pathologic conditions, increased micromotions, manifesting as DO, may alter the balance and lead to increased wall tension. The aim of the present study was to test the hypothesis of this conceptual model by determining whether individuals with DO exhibit less dynamic elasticity than individuals without DO.
FIGURE 1.

A, Conceptual model of dynamic elasticity with competing mechanisms for regulating detrusor wall tension. Passive mechanisms (stretch due to filling or geometry changes) cause strain softening by breaking actin-myosin cross bridges leading to lower wall tension during the next fill. Active contractions (voiding or nonvoiding detrusor overactivity) reverse strain softening by re-establishing actin-myosin cross bridges leading to increase wall tension during subsequent filling. B, Comparative-fill urodynamics protocol. Following a setup fill and active void (solid arrow), fill 1 was to 40% capacity and emptied by syringe aspiration (dashed black arrow). Fill 2 was to ~100% capacity and followed by an active void. Fill 3 was to 40% capacity. Vesical pressures (Pves) were measured between 0% and 40% capacity for fill 1 (blue line—before strain softening—SS]), fill 2 (red line—after strain softening due to fill 1), and fill 3 (green line —after active void—AV])
2 |. MATERIALS AND METHODS
2.1 |. Participants
Adults over the age of 21 years with and without OAB were enrolled in this prospective comparative-fill UD study which was approved by the Institutional Review Board. Participants were categorized as having “high urgency” or “no urgency” based on question 5a (“Do you have to rush to the toilet to urinate?”) of the International Consultation on Incontinence Questionnaire-OAB.18 Participants scoring 3 (“most of the time”) or 4 (“always”) were categorized as having high urgency and participants scoring 0 (“never”) were categorized as no urgency. Participants completed a 3-day void diary before UD testing and relevant demographic data were collected. Participants were analyzed based on the presence or absence of DO based on UDs as this was a more objective criterion than patient-reported survey scores.
2.2 |. UDs testing and setup fill
A comparative-fill UD protocol (Figure 1B) was used to test for dynamic elasticity based on an initial pilot study.5 Multichannel pressure and flow data were acquired at 10 Hz using an Aquarius TT UD system (Laborie, Toronto, Canada). An initial “setup” UD fill-void cycle was performed to (a) determine maximum cystometric capacity, (b) identify any DO, and (c) confirm an active void and sufficient emptying (Figure 1B “setup”). The setup fill was at a rate of 10% of patient-reported maximum voided volume per minute based on the 3-day void diary. The filling was stopped when the patient reached the sensory threshold, defined by reaching 100% on a tablet-based sensation meter19 or when involuntary voiding occurred. Participants were then given permission to void, and any post-void residual (PVR), in this fill and all subsequent fills, was removed via syringe aspiration and confirmed using a three-dimensinal ultrasound (Voluson E8; GE Healthcare, Zipf, Austria). Cystometric capacity was defined as the sum of the voided volume and any PVR from the setup fill. Participants with a PVR greater than 20% of cystometric capacity for any active void in the protocol were excluded from the data analysis.
For the calculation of compliance, any fill with a decrease in pressure or change in pressure of less than 1 cmH2O was assigned a value of 1 cmH2O and was calculated as the ratio of the infused volume to the change in filling pressure in the setup fill. The presence or absence of DO was determined based on the review of the setup UD tracings by a blinded neurourologist/urodynamicist following International Continence Society standards as the presence of any “involuntary detrusor contractions during the filling phase.”3
2.2.1 |. Quantification of dynamic elasticity
To quantify dynamic elasticity, it is necessary to compare multiple fills because the effect of strain softening or its reversal in one fill can only be observed in a subsequent fill. In this way, each individual acts as their own control, limiting inherent physiologic variability between participants. Therefore, three comparative fills were completed at a rate of 10% cystometric capacity/min (Figure 1B) as follows.
Fill 1—before strain softening: Fill to 40% capacity (Figure 1B, blue line) and passively empty via syringe aspiration through the catheter. This provides baseline pressure from 0% to 40%. Pves1 was defined as averaged Pves from 0% to 40%.
Fill 2—after strain softening: Fill to 40% capacity (Figure 1B, red line) and then continue filling to 100% and permit active voiding. Pressures measured from 0% to 40% show the effect of strain softening induced by fill 1. Pves2 was defined as averaged Pves from 0% to 40%.
Fill 3—after active void: Fill back up to 40% capacity (Figure 1B, green line). Pressures measured from 0% to 40% show the effect of strain softening reversal induced by active voiding following fill 2. Pves3 was defined as averaged Pves from 0% to 40%.
Averaged Pves values from 0% to 40% capacity for fills 1 to 3 were compared to quantify dynamic elasticity as previously described5 and averaged data from abdominal pressure (Pabd) were calculated for comparison. Each participant’s Pves data was shifted by subtracting the overall minimum value from fills 1 to 3 from all data to minimize the effects of any high baseline. Dynamic elasticity loss, dynamic elasticity gain, and a dynamic elasticity index were calculated as the change in pressure over the change in volume
Dynamic elasticity gain was calculated similarly as
A dynamic elasticity index was defined as
Using this formula, a higher dynamic elasticity index would correspond to more dynamic elasticity, that is, a larger loss in elasticity due to strain softening and/or a larger restoration in elasticity due to strain softening reversal through active voiding. In contrast, a lower dynamic elasticity index would correspond to reduced or absent dynamic elasticity.
2.2.2 |. Statistical analyses
To determine the minimum number of participants needed for this study, a power analysis was performed based on the results of the previous pilot study.5 Linear interpolation of the normalized data for strain softening to 30% capacity and 60% capacity in the pilot study indicated an expected difference in means of 32% for strain softening to 40% capacity. The power analysis determined that a sample size of eight participants per group was needed to identify a statistical difference between groups with a power level of .8 and α = .05.
Continuous variables (Pves, Pabd, dynamic elasticity lost or restored, dynamic elasticity index, age, compliance, and bladder volumes) were compared using paired or unpaired Student t tests, as appropriate. In addition, compliance and dynamic elasticity index were checked for normality using the Shapiro-Wilk’s test, and a Pearson’s correlation coefficient was computed to assess the relationship between compliance and dynamic elasticity index in participants with and without DO. Categorical variables (dynamic elasticity index above or below a threshold value and the presence or absence of DO) were compared using a Fisher’s exact test. Significance was defined as P < .05, and all values were reported as mean ± standard error.
3 |. RESULTS
Forty-three consecutive participants completed the study protocol and 28 were included in the analysis. Fifteen were excluded because of high PVRs (including 7 out of 22 normal participants without urinary urgency). Participant characteristics are listed in Table 1. The average ages of the groups with and without DO were not different (Table 1; P = .73). Maximum voided volumes on 3-day void diaries were not different for the groups of participants with and without DO (Table 1; P = .76, one participant with DO did not complete a void diary); however, the average capacity for the UD setup fill was different for the groups with and without DO (Table 1; P = .03).
TABLE 1.
Participant characteristics
| DO+ | DO− | P value | |
|---|---|---|---|
| Participants | 15 | 13 | … |
| Female | 10 | 11 | … |
| Male | 5 | 2 | … |
| High urgency | 10 | 3 | … |
| No urgency | 5 | 10 | … |
| Age, y | 39 ± 5 | 36 ± 5 | .73 |
| 3-d Dairy max voided volume, mL | 554 ± 60 | 530 ± 35 | .76 |
| Cystometric capacity, mL | 443 ± 74 | 667 ± 61 | .03 |
Abbreviations: −, negative; +, positive; DO, detrusor overactivity.
3.1 |. Quantification of dynamic elasticity
Examples of Pves tracings for an individual with DO and an individual without DO are shown in Figure 2. In these examples, a loss of dynamic elasticity was observed in the participant without DO (Figure 2A, blue line to red line) but not in the individual with DO (Figure 2B, blue line to red line). Furthermore, a gain (restoration) of dynamic elasticity after active voiding was observed in the participant without DO (Figure 2A, red line to green line) but not in the participant with DO (Figure 2B, red line to green line). Similar findings were identified for averaged data from the “without DO” and “with DO” groups (Figure 3A). In addition, there was no change in Pabd for any of the fills regardless of the presence or absence of DO, indicating that the observation of dynamic elasticity loss and gain was not due to abdominal activity (Figure 3B).
FIGURE 2.
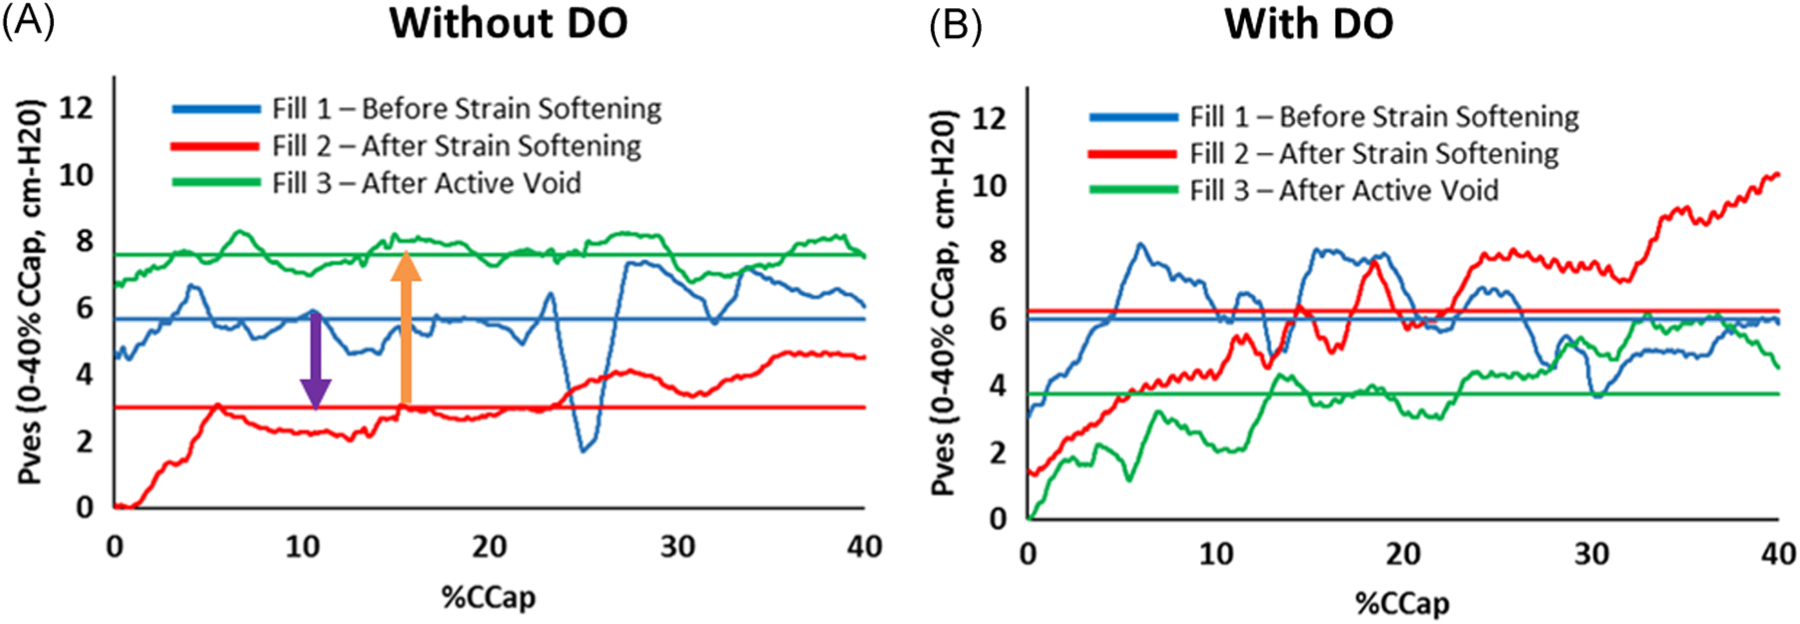
Pves examples for a participant without DO (A) and a participant with DO (B). Traces represent smoothed Pves data and straight lines represent averaged data from 0% to 40% capacity. In the example participant without DO, Pves values from 0% to 40% capacity decreased (A, purple arrow) from fill 1 (baseline, before strain softening—blue lines) to fill 2 (after strain softening—red lines) demonstrating a loss of dynamic elasticity, and Pves returned toward baseline (A, orange arrow, beyond baseline in this example) in fill 3 (after active voiding—green lines) demonstrating restored dynamic elasticity. Dynamic elasticity was not observed in the individual with DO (B, no decrease from blue to red lines and no increase from red to green lines). DO, detrusor overactivity
FIGURE 3.

A, Average Pves between 0% and 40% capacity for the participants with and without DO. Pves significantly decreased from baseline fill 1 before strain softening to fill 2 after strain softening in the participants without DO (green bars, n = 13 and *P = .004) but not in the participants with DO (yellow bars, n = 15 and P = .862). Average Pves in the participants without DO returned to baseline after active voiding in fill 3 (green bars, fill 3 not different from fill 1 and P = .172). B, Average Pabd between 0% and 40% capacity for the participants with and without DO. Fills 2 and 3 were not different from fill 1 (P > .25). A, B, Bars indicate standard errors and * indicates a value significantly different from fill 1. DO, detrusor overactivity
The group without DO demonstrated a significant loss of dynamic elasticity from fill 1 to fill 2 (Figure 4A, elasticity loss) and a statically significant gain of dynamic elasticity from fill 2 to fill 3 (Figure 4A, elasticity gain). Furthermore, the magnitude of the loss was not different from the magnitude of the gain (Figure 4A, without DO). The group with DO did not show a loss or gain of elasticity (Figure 4A, with DO). Furthermore, the dynamic elasticity index was significantly less for the group with DO (Figure 4B).
FIGURE 4.

A, Dynamic elasticity in participants with and without DO. In the participants without DO (green bars), there was a significant loss in elasticity after strain softening (elasticity loss, n = 13 and *P = .004) and a significant gain after active voiding (elasticity gain, *P = .045). In addition, there was no difference in the magnitude of the loss and gain (NS; P = .171) demonstrating the reversibility of dynamic elasticity in participants without DO. In the participants with DO (yellow bars), there was not a significant loss (n = 15 and P = .862) or gain in elasticity (P = .777). B, The average dynamic elasticity index was significantly less in participants with DO (yellow line) vs without DO (green line, Ω and P = .045). A threshold index of 0.025 cmH2O/%capacity (red line) was selected to differentiate between a group with greater dynamic elasticity and a group with reduced or absent dynamic elasticity. A total of 2 out of 13 participants without DO (green circles) and 9 out of 15 participants with DO (yellow squares) were below this threshold, indicating a significant association of DO with reduced or absent dynamic elasticity (P = .024). DO, detrusor overactivity; NS, not significant
Furthermore, a threshold value of 1.0 cmH2O over the 40% capacity range of strain softening in the present protocol was selected for dividing participants into a group with greater dynamic elasticity (index ≥ 0.025 cmH2O/%capacity) and a group with reduced or absent dynamic elasticity (index < 0.025 cmH2O/%capacity). A dynamic elasticity index of less than 0.025 cmH2O/%capacity was identified in 2 out of 13 (15%) participants without DO and 9 out of 15 (60%) participants with DO, and there was a significant association between DO and reduced/absent dynamic elasticity (P = .024).
Within-fill compliance values for participants with DO were less than participants without DO (268 ± 51 vs 486 ± 81 mL/cmH2O; P = .027); however, compliance values for participants with a dynamic elasticity index less than 0.025 cmH2O/%capacity was not different than for participants with an index greater than this threshold (320 ± 65 vs 400 ± 71 mL/cmH2O; P = .44; n = 11 and n = 17). Both compliance and the dynamic elasticity index were normally distributed, as assessed by the Shapiro-Wilk’s test (P > .05), and there were no outliers. There was no statistically significant correlation between compliance and dynamic elasticity index for all participants (r(26) = −.045, P = .819). In addition, compliance and the dynamic elasticity index correlation were examined using the Pearson correlation test independently on the groups with DO and without DO, and no statistically significant correlation was identified (r(13) = −.225, P = .420 and r(11) = −.293, P = .331, respectively). Together, these results indicate that standard compliance measurements from a single UD fill would not be sufficient to identify the presence or absence of dynamic elasticity.
4 |. DISCUSSION
This study demonstrated that dynamic elasticity identified during a comparative-fill UD protocol was mainly observed in individuals without DO. This finding supports the conceptual model in Figure 1A, in which detrusor wall tension, and therefore compliance, can be acutely and actively regulated. According to this model, passive mechanisms that stretch the bladder wall, such as bladder filling or bladder compression,20 break or release actin-myosin connections which reduce elasticity and result in reduced wall tension during subsequent filling. In contrast, active mechanisms, such as voiding contractions or DO, act to re-establish these actin-myosin connections and restore wall tension during subsequent filling.6,7 In this regard, the purpose of spontaneous rhythmic contractions that have been identified in both preclinical studies14 and in human UD,16 may be to regulate the balance between tone and accommodation in an environment where the bladder is continuously subjected to passive forces (filling, body movement, Valsalva, bowel activity, external compression, etc). However, an imbalance in passive forces and active contractions (ie when subclinical micromotions become clinically significant DO) could contribute to OAB. This hypothesis is supported by the results of the present study, which showed a significantly lower dynamic elasticity index in participants with DO.
Studies of detrusor wall tension have been limited by a lack of minimally invasive technologies to directly measure this biomechanical property. However, several investigators have made strides in the development of novel technologies to measure detrusor wall tension in a minimally invasive fashion. Fatemi et al21 developed a bladder vibrometry method in which ultrasonic shear waves were used to measure wall elasticity. Likewise, Sturm et al22 were able to achieve similar results using bladder elastography. In addition, Nagle et al23 have developed a method to calculate real-time detrusor wall tension during UD filling using ultrasound-derived metrics. However, none of these studies have compared detrusor wall tension to the presence or absence of DO to provide a potential mechanism to explain how acute regulation of detrusor wall tension might relate to clinical conditions such as OAB.
It is important to mention that the protocol in this study differs from our previous pilot investigation in which two separate fills with passive emptying (to 30% capacity and then to 60% capacity) were used to identify dynamic elasticity in individuals with OAB. In the current study, a single passive emptying fill to 40% capacity was employed for simplicity and because linear interpolation of the strain-softening data from 30% capacity and 60% capacity in the original pilot study indicated that filling to 40% capacity would be expected to produce statistically significant dynamic elasticity in the subjects from that study (P = .033 for interpolated data).5
On the basis of preclinical studies in detrusor strips showing that active contraction at short muscle lengths reverse strain softening,7 we expected that strain softening might not be reversed in participants that did not actively void to a sufficiently small volume. As a result, participants with a PVR greater than 20% of cystometric capacity for the active voids following the setup fill or fill 2 were excluded. A PVR of 20% of cystometric capacity is equivalent to half of the 40% capacity volume used to strain soften the bladder in fill 1. Thus, to be included in the study, the participant must have achieved an active voiding contraction that emptied the bladder to a volume that included at least half of the range of the strain softening.
A limitation of the current investigation was the lack of more objective metrics to identify and quantify DO. However, new techniques to objectively identify DO with automated fast Fourier transforms24 or wavelet analysis25 have recently been developed and could make the process far more objective for future investigations. Another limitation of the current study was the relatively large number of participants were excluded because of high PVRs. However, this finding is consistent with an earlier study that identified high PVRs in some healthy participants during UDS.26
5 |. CONCLUSION
This study presents a conceptual model for dynamic elasticity, a mechanism to acutely regulate detrusor wall tension through a balance of competing active contractile and passive strain mechanisms. Dynamic elasticity was found to be associated with participants without DO. The absence of dynamic elasticity in most participants with DO supports the model and suggests that DO may produce an imbalance in the regulation of detrusor wall tension. Improved understanding of this mechanistic model may help us to identify novel treatment strategies for OAB.
ACKNOWLEDGMENTS
The authors would like to thank Kimberly Bradley, Meagan Miller, and Sandy Smith for their contributions to this study. This study was supported by a grant from the National Institutes of Health (R01-DK101719).
Funding information
National Institute of Diabetes and Digestive and Kidney Diseases, Grant/Award Number: R01-DK101719
REFERENCES
- 1.Andersson KE. Detrusor myocyte activity and afferent signaling. Neurourol Urodyn. 2010;29(1):97–106. [DOI] [PubMed] [Google Scholar]
- 2.Habteyes FG, Komari SO, Nagle AS, et al. Modeling the influence of acute changes in bladder elasticity on pressure and wall tension during filling. J Mech Behav Biomed Mater. 2017;71:192–200. [DOI] [PMC free article] [PubMed] [Google Scholar]
- 3.Abrams P, Cardozo L, Fall M, et al. The standardisation of terminology of lower urinary tract function: report from the standardisation sub-committee of the International Continence Society. Neurourol Urodyn. 2002;21(2):167–178. [DOI] [PubMed] [Google Scholar]
- 4.Metcalfe PD, Wang J, Jiao H, et al. Bladder outlet obstruction: progression from inflammation to fibrosis. BJU Int. 2010; 106(11):1686–1694. [DOI] [PubMed] [Google Scholar]
- 5.Colhoun AF, Klausner AP, Nagle AS, et al. A pilot study to measure dynamic elasticity of the bladder during urodynamics. Neurourol Urodyn. 2017;36(4):1086–1090. [DOI] [PMC free article] [PubMed] [Google Scholar]
- 6.Ratz PH, Speich JE. Evidence that actomyosin cross bridges contribute to “passive” tension in detrusor smooth muscle. Am J Physiol Renal Physiol. 2010;298(6):F1424–F1435. [DOI] [PMC free article] [PubMed] [Google Scholar]
- 7.Speich JE, Borgsmiller L, Call C, Mohr R, Ratz PH. ROK-induced cross-link formation stiffens passive muscle: reversible strain-induced stress softening in rabbit detrusor. Am J Physiol Cell Physiol. 2005;289(1):C12–C21. [DOI] [PubMed] [Google Scholar]
- 8.Speich JE, Southern JB, Henderson S, Wilson CW, Klausner AP, Ratz PH. Adjustable passive stiffness in mouse bladder: regulated by Rho kinase and elevated following partial bladder outlet obstruction. Am J Physiol Renal Physiol. 2012;302(8):F967–F976. [DOI] [PMC free article] [PubMed] [Google Scholar]
- 9.Southern JB, Frazier JR, Miner AS, Speich JE, Klausner AP, Ratz PH. Elevated steady-state bladder preload activates myosin phosphorylation: detrusor smooth muscle is a preload tension sensor. Am J Physiol Renal Physiol. 2012;303(11):F1517–F1526. [DOI] [PubMed] [Google Scholar]
- 10.Colhoun AF, Speich JE, Dolat MT, et al. Acute length adaptation and adjustable preload in the human detrusor. Neurourol Urodyn. 2016;35(7):792–797. [DOI] [PubMed] [Google Scholar]
- 11.Byrne MD, Klausner AP, Speich JE, Southern JB, Habibi JR, Ratz PH. Fourier transform analysis of rabbit detrusor autonomous contractions reveals length dependent increases in tone and slow wave development at long lengths. J Urol. 2013;190(1):334–340. [DOI] [PubMed] [Google Scholar]
- 12.Drake MJ, Hedlund P, Harvey IJ, Pandita RK, Andersson KE, Gillespie JI. Partial outlet obstruction enhances modular autonomous activity in the isolated rat bladder. J Urol. 2003; 170(1):276–279. [DOI] [PubMed] [Google Scholar]
- 13.Colhoun AF, Speich JE, Cooley LF, et al. Low amplitude rhythmic contraction frequency in human detrusor strips correlates with phasic intravesical pressure waves. World J Urol. 2016;35:1255–1260. [DOI] [PMC free article] [PubMed] [Google Scholar]
- 14.Kinder RB, Mundy AR. Pathophysiology of idiopathic detrusor instability and detrusor hyper-reflexia. An in vitro study of human detrusor muscle. Br J Urol. 1987;60(6):509–515. [DOI] [PubMed] [Google Scholar]
- 15.Drake MJ, Kanai A, Bijos DA, et al. The potential role of unregulated autonomous bladder micromotions in urinary storage and voiding dysfunction; overactive bladder and detrusor underactivity. BJU Int. 2017;119(1):22–29. [DOI] [PMC free article] [PubMed] [Google Scholar]
- 16.Drake MJ, Harvey IJ, Gillespie JI, Van Duyl WA. Localized contractions in the normal human bladder and in urinary urgency. BJU Int. 2005;95(7):1002–1005. [DOI] [PubMed] [Google Scholar]
- 17.van Duyl WA. A model for both the passive and active properties of urinary bladder tissue related to bladder function. Neurourol Urodyn. 1985;4(4):275–283. [Google Scholar]
- 18.Abrams P, Avery K, Gardener N, Donovan J, Advisory Board ICIQ. The International Consultation on Incontinence Modular Questionnaire:www.iciq.net. J Urol. 2006;175(3 pt 1):1063–1066. [DOI] [PubMed] [Google Scholar]
- 19.Nagle AS, Speich JE, De Wachter SG, et al. Non-invasive characterization of real-time bladder sensation using accelerated hydration and a novel sensation meter: an initial experience. Neurourol Urodyn. 2017;36(5):1417–1426. [DOI] [PMC free article] [PubMed] [Google Scholar]
- 20.Balthazar A, Cullingsworth ZE, Nandanan N, et al. An external compress-release protocol induces dynamic elasticity in the porcine bladder: a novel technique for the treatment of overactive bladder? Neurourol Urodyn. 2019;38:1222–1228. [DOI] [PMC free article] [PubMed] [Google Scholar]
- 21.Bayat M, Kumar V, Denis M, et al. Correlation of ultrasound bladder vibrometry assessment of bladder compliance with urodynamic study results. PLoS One. 2017;12(6):e0179598. [DOI] [PMC free article] [PubMed] [Google Scholar]
- 22.Sturm RM, Yerkes EB, Nicholas JL, et al. Ultrasound shear wave elastography: a novel method to evaluate bladder pressure. J Urol. 2017;198(2):422–429. [DOI] [PubMed] [Google Scholar]
- 23.Nagle AS, Klausner AP, Varghese J, et al. Quantification of bladder wall biomechanics during urodynamics: a methodologic investigation using ultrasound. J Biomech. 2017;61: 232–241. [DOI] [PMC free article] [PubMed] [Google Scholar]
- 24.Cullingsworth ZE, Kelly BB, Deebel NA, et al. Automated quantification of low amplitude rhythmic contractions (LARC) during real-world urodynamics identifies a potential detrusor overactivity subgroup. PLoS One. 2018;13(8):e0201594. [DOI] [PMC free article] [PubMed] [Google Scholar]
- 25.Niederhauser T, Gafner ES, Cantieni T, et al. Detection and quantification of overactive bladder activity in patients: can we make it better and automatic? Neurourol Urodyn. 2018; 37(2):823–831. [DOI] [PubMed] [Google Scholar]
- 26.Leitner L, Walter M, Sammer U, Knupfer SC, Mehnert U, Kessler TM. Urodynamic investigation: a valid tool to define normal lower urinary tract function? PLoS One. 2016;11(10):e0163847. [DOI] [PMC free article] [PubMed] [Google Scholar]