Abstract
Purpose
Currently, radiologists use tumor-to-normal tissue contrast across multiphase computed tomography (MPCT) for lesion detection. Here, we developed a novel voxel-based enhancement pattern mapping (EPM) technique and investigated its ability to improve contrast-to-noise ratios (CNRs) in a phantom study and in patients with hepatobiliary cancers.
Methods
The EPM algorithm is based on the root mean square deviation between each voxel and a normal liver enhancement model using patient-specific (EPM-PA) or population data (EPM-PO). We created a phantom consisting of liver tissue and tumors with distinct enhancement signals under varying tumor sizes, motion, and noise. We also retrospectively evaluated 89 patients with hepatobiliary cancers who underwent active breath-hold MPCT between 2016 and 2017. MPCT phases were registered using a three-dimensional deformable image registration algorithm. For the patient study, CNRs of tumor to adjacent tissue across MPCT phases, EPM-PA and EPM-PO were measured and compared.
Results
EPM resulted in statistically significant CNR improvement (P < 0.05) for tumor sizes down to 3 mm, but the CNR improvement was significantly affected by tumor motion and image noise. Eighty-two of 89 hepatobiliary cases showed CNR improvement with EPM (PA or PO) over grayscale MPCT, by an average factor of 1.4, 1.6, and 1.5 for cholangiocarcinoma, hepatocellular carcinoma, and colorectal liver metastasis, respectively (P < 0.05 for all).
Conclusions
EPM increases CNR compared with grayscale MPCT for primary and secondary hepatobiliary cancers. This new visualization method derived from MPCT datasets may have applications for early cancer detection, radiomic characterization, tumor treatment response, and segmentation.
Implications for patient care
We developed a voxel-wise enhancement pattern mapping (EPM) technique to improve the contrast-to-noise ratio (CNR) of multiphase CT. The improvement in CNR was observed in datasets of patients with cholangiocarcinoma, hepatocellular carcinoma, and colorectal liver metastasis. EPM has the potential to be clinically useful for cancers with regard to early detection, radiomic characterization, response, and segmentation.
Keywords: abdomen/GI, bile ducts, computer applications-detection/diagnosis, CT, liver
1. INTRODUCTION
With the growing morbidity and mortality in the United States from primary liver tumors,1 and the ever present challenge of identifying metastatic disease to the liver as part of comprehensive staging,2 there is an ongoing need to improve the ability to detect both primary and secondary tumors within the liver. The ability to discriminate such lesions from background liver is primarily dependent on image contrast. In computed tomography (CT), image contrast is based on the difference in density between a given lesion and that of the background liver, as measured in Hounsfield units, and enhanced by the administration of iodine-based intravenous contrast combined with the appropriate timing of image acquisition.
The liver’s dual blood supply results in differential contrast intake and washout between normal liver (preferentially supplied by the portal venous inflow) and intrahepatic malignancies (typically drawing preferentially from hepatic arterial inflow). Since tumor vascular dynamics depends on the cancer type and a given patient’s unique physiologic characteristics, the optimal postcontrast acquisition time is not known beforehand. Therefore, multiphase CT (MPCT) has become the gold standard as it generates image sets in distinct phases, including precontrast, arterial (AR), portal venous (PV), and delayed.3 These phases permit evaluation of both hypervascular and hypovascular lesions.4
In MPCT, radiologists typically evaluate each set of images for a given phase of enhancement separately, relying on contrast between lesion and background as seen in each phase to detect and characterize suspected areas.5–7 However, large tumors tend to have variable vascular dynamics, and tumors with unclear boundaries can be challenging to identify based on characteristics derived from interpreting individual phases. Furthermore, some tumors can be challenging to detect regardless of the phase because they are relatively isodense to normal background tissue.
To improve the diagnostic performance of MPCT, researchers have previously proposed mapping the quantifiable features from the MPCT data itself.8–11 Kang et al used an arterial enhancement fraction (AEF) feature, calculated using the ratio of the HU absolute increment during the AR to the PV phase. They showed that use of AEF increased the sensitivity for HCC detection. Notably, the AEF approach did not use the overall enhancement curve characteristics, as it focused only on AR and PV phases. Moreover, AEF techniques may be susceptible to image misregistration.
In this paper, we propose and investigate a multiparametric enhancement pattern mapping (EPM) technique that compares each voxel of a CT scan to a generalized normal liver enhancement curve, providing visual output of the quantitative differences. This method uses the full enhancement characteristics from all phases of an MPCT dataset. We addressed the challenge of liver motion, which often results in image misregistration, by using an active breath-hold technique along with deformable image registration.12–15 This study aimed to asses EPM contrast-to-noise ratio (CNR) compared to that for conventional HU-based MPCT images to improve the visibility of liver lesions (both primary and metastatic).
2. MATERIALS AND METHODS
2.A. Enhancement pattern mapping (EPM) algorithm
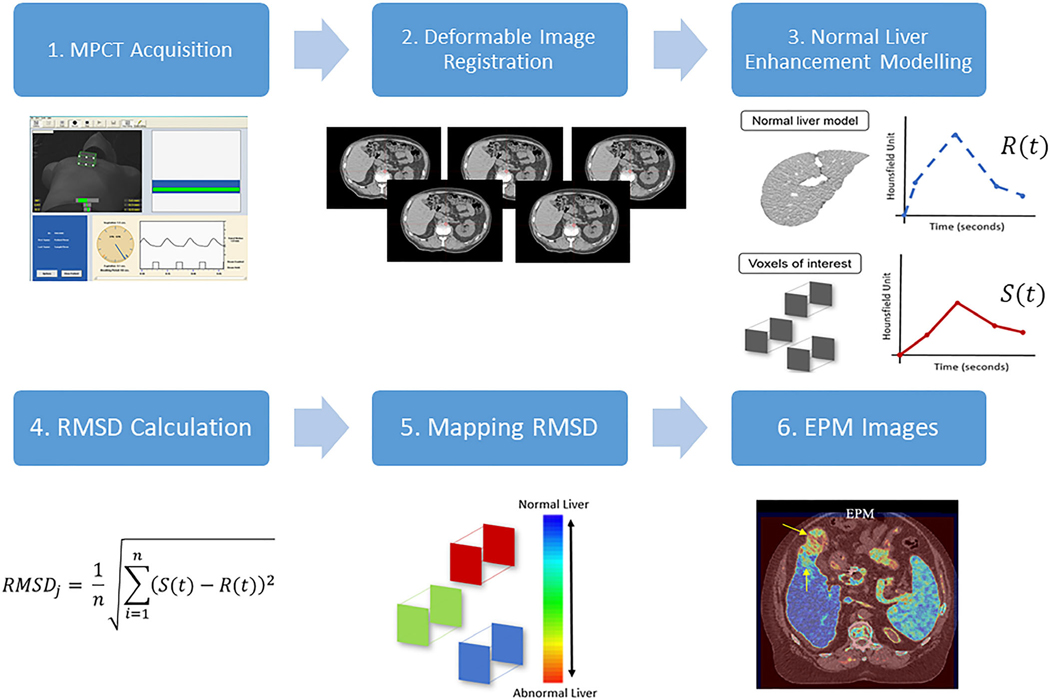
In this section, we give a detailed description of the proposed EPM method. The first step of EPM is to acquire the generalized enhancement pattern (change in HU over the period of MPCT due to uptake and washout of contrast materials) of the organ of interest (i.e., liver). This generalized or normal enhancement pattern of liver can then be compared against the enhancement pattern of individual voxels. The difference between the two patterns then indicates how different each voxel is to the generalized enhancement pattern of liver. The working hypothesis is that the voxels of tumor would have a sufficiently different enhancement pattern compared to the generalized enhancement pattern of liver such that the difference can be visualized to increase CNR. The overall step-by-step process of the EPM technique is depicted in Fig. 1.
FIG. 1.
Overall view of step-by-step enhancement pattern mapping method. 1. Multiphase computed tomography (MPCT) is acquired using actively gated breath-hold technique to minimize breathing motion of liver. The image shows a Varian RPM system for respiratory motion management and its visual feedback. 2. Deformable image registration is used to correct misregistration of liver between 4 and 6 multiphase CT image sets due to variability of breath-hold. 3. Normal liver enhancement pattern is acquired by fitting the change in HU numbers over time within the user-defined region of interests (ROIs) (EPM-PA method) or the precomputed population-based enhancement model (EPM-PO method). 4. For all voxels, the root mean square distance (RMSD) is computed by comparing the contrast enhancement of that voxel against the normal liver enhancement pattern found in step 3. 5. The computed RMSD values of all voxels are mapped back to the original CT coordinate to create EPM images shown in step 6.
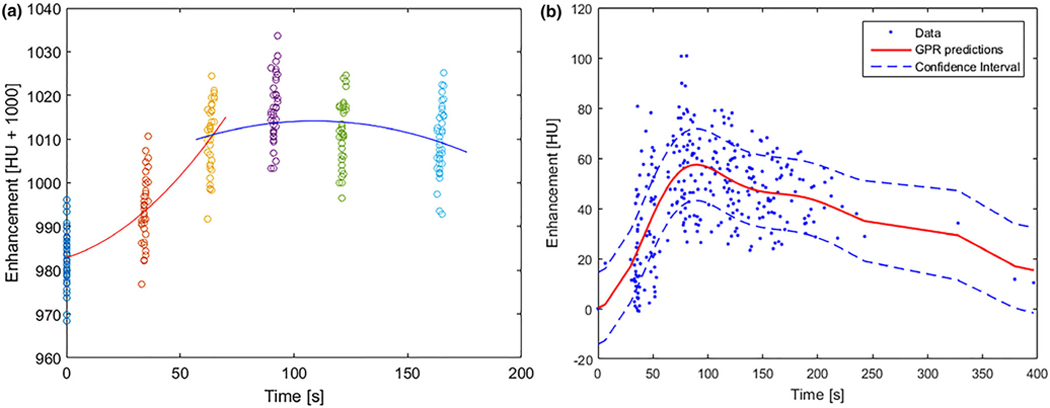
In order to generate the generalized enhancement pattern of liver, we took two different approaches: patient-specific model (EPM-PA) and population-based model (EPM-PO). For the EPM-PA model, 20 to 30 region of interests (ROIs) with a 5-mm radius were sampled uniformly across normal liver parenchyma from the given patient. Within those sampled ROIs, about 1600 to 2400 voxels were extracted and their enhancement profile (comprised of 4 to 6 HU numbers over the span of MPCT studies for each voxel) was extracted. These extracted enhancement profiles from all voxels were plotted and used to create the normal enhancement pattern of liver by fitting them to a piecewise polynomial function: the enhancement profiles of all sampled voxels were divided into two sections, and each section was fitted using second-degree polynomial functions. The end result of this process is one piecewise polynomial function that describes the enhancement of HU of liver over the period of MPCT acquisition time (120 to 180 s) after injection of contrast [Fig. 2(a)]. For the EPM-PO, a universal normal liver tissue enhancement was derived from 26 pancreatic cancer patients who had no known liver disease and who underwent MPCT examination under identical scanning protocols. We sampled 180 ROIs (about 14 400 voxels) from the assumed normal livers that were used to develop a Gaussian process regression model of normal liver parenchyma. The end result of this process is one piecewise polynomial function that is modeled based on the population of 26 patients [Fig. 2(b)].
FIG. 2.
(a) An example of modeling a patient-specific enhancement profile of normal liver: two piecewise second-order polynomial functions (orange and blue lines) are used to fit the sampled HU numbers at each phase (colored dots). (b) Population-based enhancement profile of normal liver generated using liver samples collected from multiphase computed tomography datasets of pancreatic cancer patients with no known liver disease: each dot represents sampled HU values from the population, and the dotted blue line represents the 90% interval of the red median curve.
The generalized enhancement pattern functions obtained this way for both EPM-PA and EPM-PO are denoted R(t). This function R then gives the expected HU value of the liver at a given time t. Similarly, for any given voxel, the observed enhancement pattern is denoted as S(t). In order to visualize the difference between R(t) and S(t), the difference between the two functions must be computed to a single value that can be used to map back to the CT spatial coordinate that originates from the location of the given voxel. The mapping feature was the root mean square deviation (RMSD) of each voxel enhancement compared to the generalized liver model. For any given voxel j, RMSD was computed as follows: , where (S(i)) and (R(i)) are the given voxel and normal liver enhancement value in HU at time i, respectively. The exact time values i are extracted from time after injection of contrast that was recorded from DICOM header files, while n equals the number of MPCT phases. The RMSD values were computed for all voxels and its values were mapped back to its originating spatial coordinate to finally produce EPM images.
We measured the EPM performance both in a phantom study and a patient study. The clinical performance of EPM was assessed using data acquired from patients with primary cholangiocarcinoma, primary hepatocellular carcinoma (HCC), or colorectal liver metastases. These patients were retrospectively identified under an Institutional Review Board approved protocol (PA14–0646) including a waiver of informed consent. All patients underwent a MPCT as part of a radiation treatment planning simulation between 2016 and 2017. The patients’ characteristics are shown in Table I. The performance parameter in both studies was CNR in EPM compared to the MPCT.
Table I.
Patient demographic and clinical characteristics, with disease stage.
| Demographic characteristics |
HCC (N = 34) |
Cholangiocarcinoma (N = 30) |
Colorectal cancer liver metastasis (N = 25) |
|---|---|---|---|
| Age, yr ± SD | 62 ± 11 | 61 ± 10 | 59 ± 11 |
| Sex | |||
| M | 30 | 16 | 19 |
| F | 4 | 14 | 6 |
| Stage | I = 3 | IA = 3 | IV = 25 |
| II = 6 | 1B = 2 | ||
| IIIA = 5 | II = 3 | ||
| IIIB = 13 | IIB = 8 | ||
| IVA = 3 | IIIA = 2 | ||
| IVB = 4 | IIIB = 2 | ||
| IV = 8 | |||
| IVB = 1 |
HCC, hepatocellular carcinoma.
2.B. Phantom study
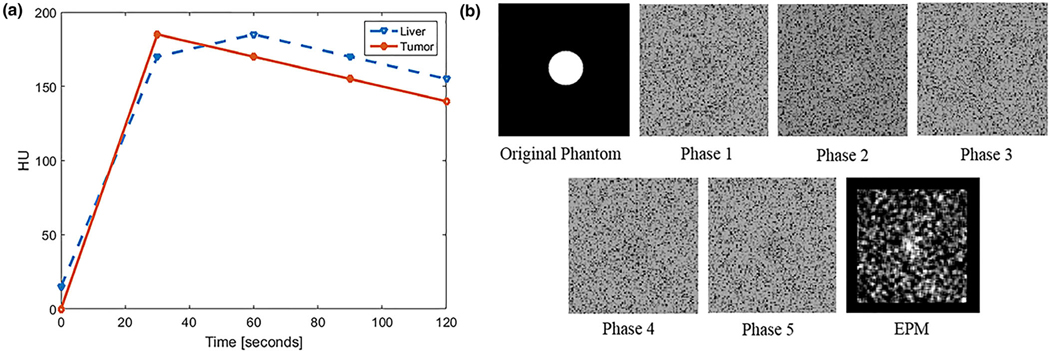
We created virtual MPCT image sets with a spherical tumor. The virtual dataset consisted of five phases, 30 s apart ranging from 0 to 120 s. Two distinct signals that mimicked characteristics of the tumor and normal liver were created (Fig. 3), aiming to simulate cases in which subtle differences in contrast uptake between the tumor and normal liver could be measured at any given phase (±15 HU). The HU values of the tumor were 0, 180, 170, 160, and 150. The HU values of the liver were 20, 170, 180, 170, and 160. The tumor enhancement curve was designed to show early arterial uptake (20–30 s) and washout after 45 s. In contrast, the normal liver enhancement curve was designed to show later maximum uptake (60 s) and slower washout.
FIG. 3.
(a) Proof of concept simulation of hypothetical enhancement curves of liver and tumor with similar signal amplitudes with subtle differences in enhancement pattern. (b) An example of simulated computed tomography (CT) images of tumor and normal liver tissue (background) at different phases and the resulting enhancement pattern mapping (EPM). In this case, the tumor is only slightly discernable at all phases because of the subtle differences in the enhancement curve, image noise, and motion. The resulting EPM image brings out the tumor contrast.
2.C. Simulation parameters
Simulated tumor size ranged from 2 to 30 mm. Gaussian white noise with a constant mean (i.e., equal to the HU value of the tumor) and variance of 0.001 to 0.04 was added to the original image. For motion, 0–5 mm of tumor motion was introduced between different phases. For each parameter, simulations were repeated 30 times. We measured the mean signal value within the tumor (μtumor) and the mean signal value (μliver) and standard deviation (σliver) of tissue adjacent to the tumor, computing the CNR for each simulation.
2.D. Feature extraction and mapping
The mapping feature was the root mean square deviation (RMSD) of each voxel enhancement compared to the normal liver model. Voxel RMSD was computed as follows: , where (Si) and (Ri) are the given voxel and normal liver enhancement, respectively. While n equals the number of MPCT phases (four to six). The computed RMSD values were mapped back to their original CT coordinates.
2.E. Patient study
2.E.1. MPCT acquisition
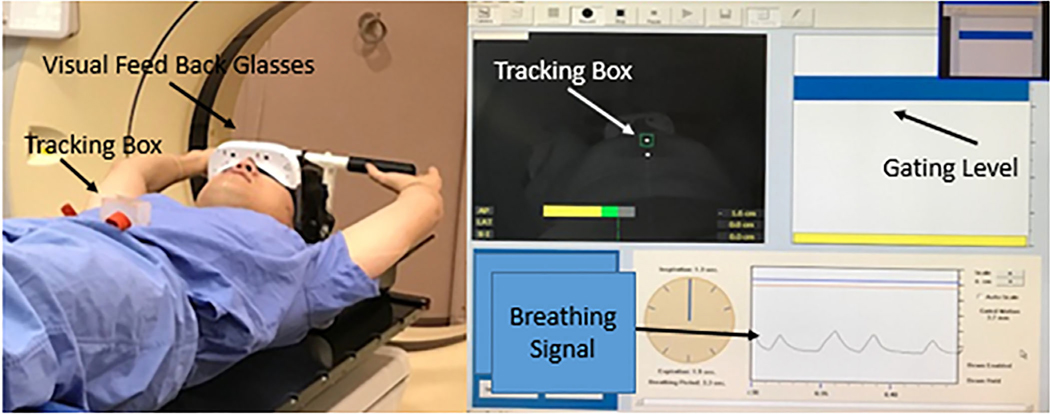
MPCT scans were performed using an active breath-hold technique (Fig. 4) utilizing a hardware-based motion tracking system. Once the required breath-hold level was achieved, a precontrast CT scan covering the entire liver area was acquired. About 150 ml of iodine-based contrast was injected at a rate of 5 ml/s for an injection duration of 30 s. The first phase scan began immediately after the conclusion of the injection of contrast, followed by subsequent phases roughly 30 s apart. Scan time typically ranged from 6 to 10 s. Details of the MPCT are shown in Table II.
FIG. 4.
Active motion tracking breath-hold computed tomography (CT) acquisition setup: a camera is attached to the CT couch, pointed at the tracking box on the patient’s abdomen. The patient wears goggles that display their breathing cycle with the targeted breath-hold level. The images are acquired when the patient is holding his breath at the gating level.
Table II.
MPCT acquisition.
| Characteristics | Parameter |
|---|---|
| Section collimation | 16 × 1.5 |
| Pitch | 0.936 |
| Rotation time | 0.44 |
| mAs/slice | 200 |
| kV | 120 |
| Contrast agent injection | 150 ml of iodine-based contrast material injected via power injector at the rate of 5 ml/s |
| MPCT breath-hold scan timing | First phase began 20–30 s after the start of injection; remaining phases were acquired at roughly 30-s intervals |
| Matrix | 512×512 |
| Slice thickness | 3 mm |
| FOV | 500 mm |
MPCT, multiphase computed tomography.
2.E.2. Image registration
In addition to the use of an active breath-hold technique, 3D-deformable image registration was also used in order to fine-tune the liver alignment across all phases. The in-house-developed 3D deformable image registration technique was based on “Demon” algorithms.12,13 All registered images were visually inspected by a board-certified medical physicist to ensure no discernable error in registration.
2.E.3. Software implementation
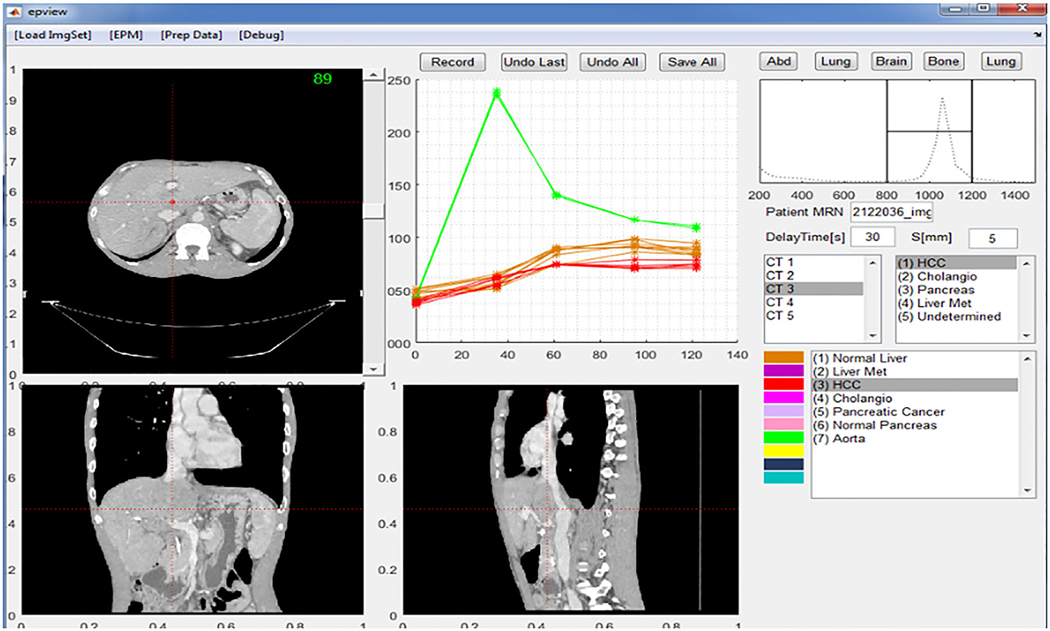
Graphical user interface software was developed using MATLAB (MathWorks, Inc.) with the ImageProcessing Toolbox. The software imports DICOM images, registers the MPCT sets, and builds a normal liver tissue model before EPM generation. This allows a visual quality check of registration and navigation across an individual ROI’s enhancement profile. Based on the sampled liver ROI, a patient-specific enhancement profile of the normal liver was created (Fig. 5).
FIG. 5.
Graphical user interface of the software used to extract the enhancement profile. The software implements the axial, coronal, and sagittal viewers. The user can navigate through the image space and observe and sample any given voxel or region of interest enhancement profile across all multiphase computed tomography image sets for later analysis.
2.E.4. Statistical methods
Student t test (JMP, SAS Institute) was used to compare the CNR of the EPM image with the grayscale image. A P < 0.05 was considered significant.
3. RESULTS
3.A. Proof of concept phantom study
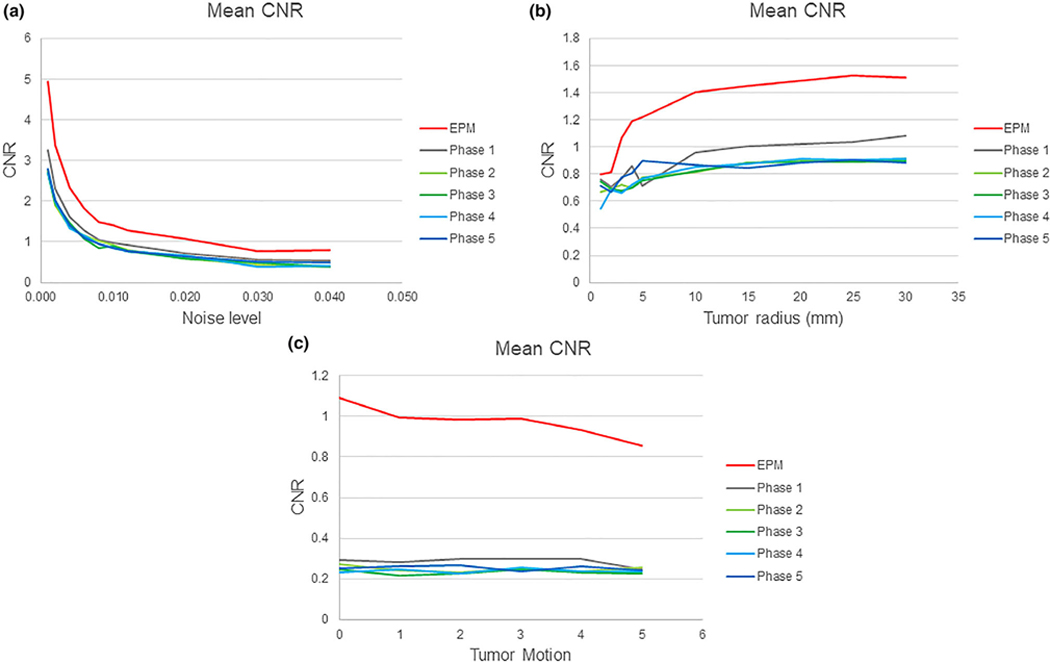
The proposed algorithm was tested in a controlled phantom simulation. Fig. 3(b) shows the result of one simulation of centrally located tumors (radius = 5 mm), under image noise levels (σ = 0.01). The tumor was designed to have a slightly faster uptake of contrast; thus, in the phase 2 images, it appears slightly hyperintense. As the noise levels increased from 0.01 to 0.04 for tumors with radius = 5 mm, the average CNR measured in all conventional CT images across different phases dropped from 2.83 to 0.54. A noise level of 0.02 and above made it difficult to discern the tumor on all multiphase images. The EPM image measured CNR dropped from 4.94 to 0.80 over the same noise range. EPM images showed a statistically significant improvement in the CNR (P < 0.05) when compared to conventional CT images at all time points [Fig. 6(a)].
FIG. 6.
(a) Contrast-to-noise ratio (CNR) vs. noise level in phantom from (σ) 0 to 0.04. No tumor motion was introduced, and the radius of the tumor was fixed at 5 mm. (b) CNR vs phantom tumor size, with the radius varying from 2 to 30 mm, compared with the radius under zero motion and the radius fixed at 5 mm (bottom). (c) CNR vs phantom tumor motion, simulated from 0 to 5 mm for tumor size, with a radius of 5 mm. The noise level and radius of the tumor were kept at 0.01 and 5 mm, respectively.
As the tumor radius decreased from 30 to 2 mm, the average CNR measured in all conventional CT images across different phases dropped from 0.93 to 0.68 for images under the noise levels = σ0.01. On EPM images, the CNR decreased from 1.5 to 0.79. The CNR measured using EPM images showed a statistically significant improvement over those measured using conventional CT images at all phases down to tumor radius of 3 mm. However, for tumors with a radius below 2 mm, this improvement disappeared — no statistically significant difference was observed between the EPM and conventional CT images [Fig. 6(b)].
For the CNR measurements obtained under the influence of tumor motion, we used a tumor radius = 10 mm. For the conventional images, the average CNR across all phases was 0.35 and unaffected by motion of up to 5 mm. The CNR measured in EPM images was more sensitive to tumor motion introduced during simulation, decreasing from 1.1 to 0.8. This was expected as the EPM requires voxel-to-voxel correspondence to compute the feature from the enhancement profile. EPM was found to be inherently sensitive to image registration errors due to tumor motion [Fig. 6(c)].
3.B. Patient study
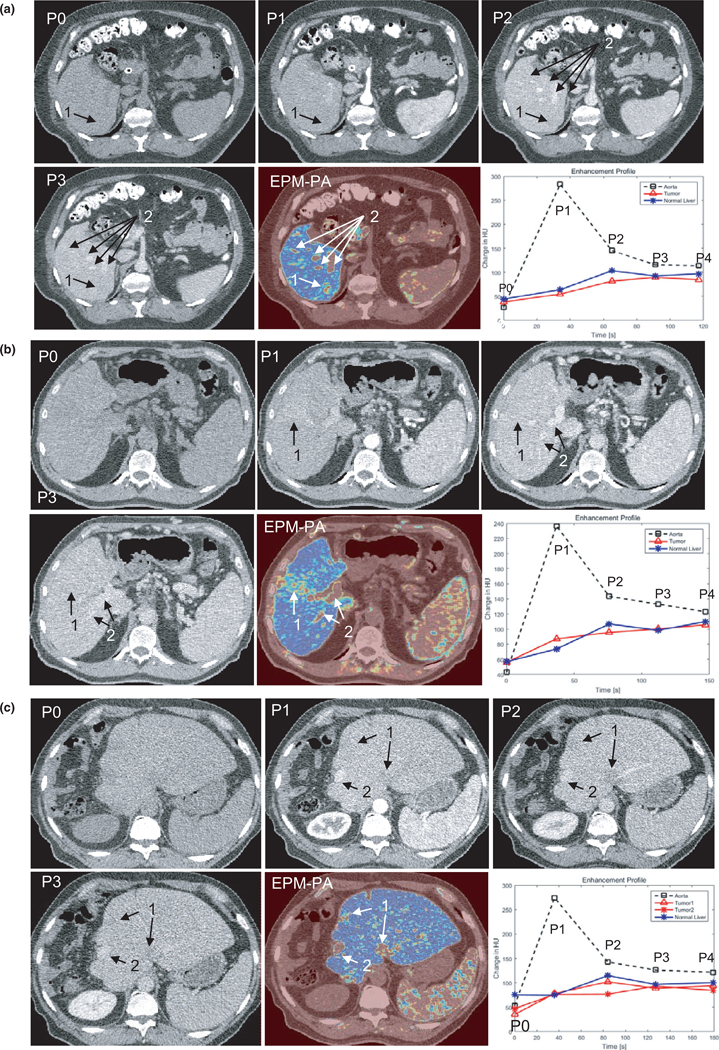
Figures 7(a)–7(c) compares EPM-PA images with MPCT images for each cancer type, along with the sampled enhancement curve for aorta, tumor, and normal liver tissues. All MPCT images shown are displayed in an abdominal window setting using center = 50 HU and width = 400 HU. All EPM images were created using the jet color map, which uses blue to red to represent the RMSD values from the most to the least similar enhancement characteristics to those of normal liver parenchyma.
FIG. 7.
(a) An example of the multiphase computed tomography (MPCT) image sets and enhancement pattern mapping patient-specific (EPM-PA) resulting from a cholangiocarcinoma case. The biopsy-proven tumor is slightly visible as a hypodense area in P1 and P2 of the MPCT images (arrow 1). On the EPM-PA image, the tumor is highly visible. Likewise, arrow 2 points to the nondiseased area that does not follow normal liver tissue enhancement characteristics that are enhanced in EPM-PA (i.e., arteries or veins). (b) An example of the MPCT image sets and EPM-PA from a patient with confirmed HCC (arrow 1). P0-P3 are the CT images from MPCT at different time points after contrast injection. The EPM-PA was calculated on the basis of RMSD feature mapping using the enhancement characteristics of the normal liver model. This particular tumor exhibited only a small difference in HU uptake in P1 and P2 phases, making it difficult to discern the tumor on conventional CT images. Arrow 2 points to the nondiseased area of high signal from EPM (i.e., arteries or veins). (c) An example of the MPCT image sets and EPM-PA resulting from colorectal cancer. Two known tumor locations are visible as hypodense areas on P2 (arrow 1). *All MPCT images in a-c are displayed in the abdominal window setting using center = 50 HU and width = 400 HU. The bottom right image shows the aorta contrast enhancement curve (black dashed), generalized enhancement curve of liver (blue solid), and the enhancement curve of tumor (red solid) where the region of interest was drawn for contrast-to-noise measurements.
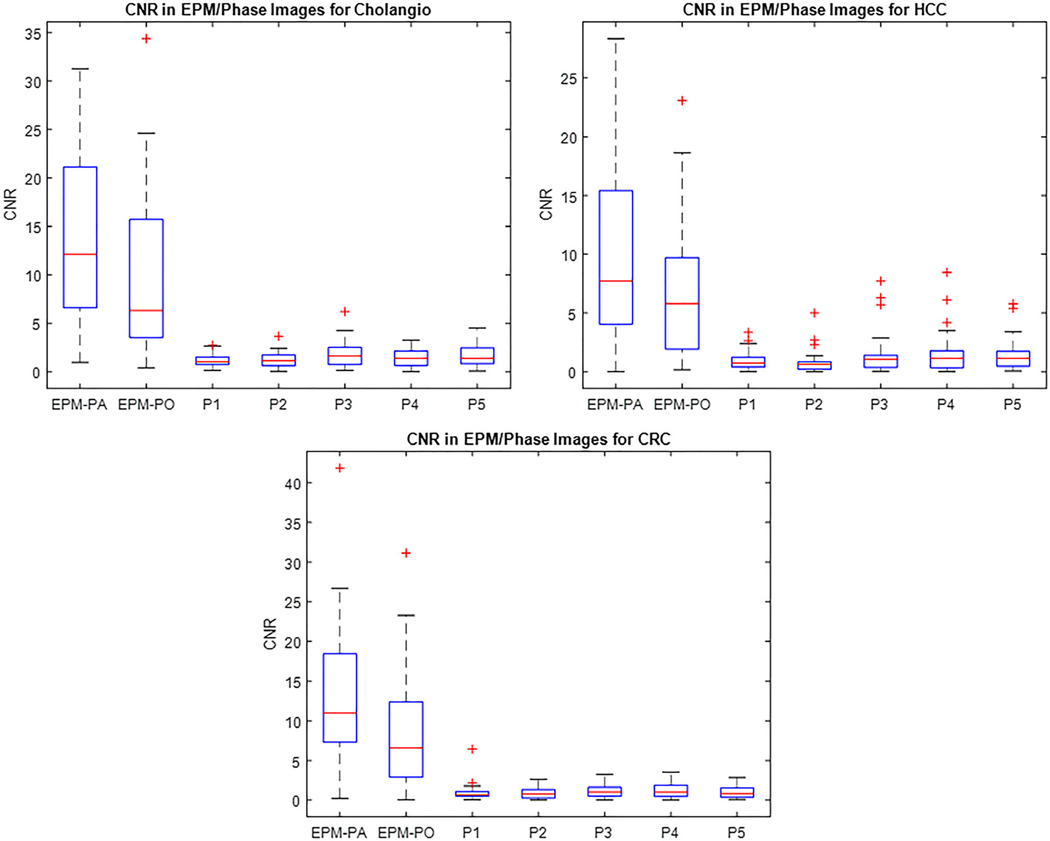
Of the 89 patients, 82 showed an improved CNR with the EPM-PA and EPM-PO compared to conventional CT over all phases. For the cholangiocarcinoma cohort, the average CNRs measured using the EPM-PA and EPM-PO were 13.4 and 9.4, respectively. For the HCC cohort, CNRs were 10.5 and 6.7, for EPM-PA and EPM-PO, respectively. For the colorectal cancer liver metastasis cohort, the average CNRs were 13.1 and 8.9 for EPM-PA and EPM-PO, respectively. For all groups, the EPM-PA and EPM-PO resulted in statistically significantly improved CNRs over the conventional CT scans (P < 0.05). The improvement in the EPM-PA was statistically larger than that of the EPM-PO. Figure 8 summarizes the results of the patient study using boxplots.
FIG. 8.
The boxplots of the patient study results show significant improvement of the CNR in both the patient-specific enhancement pattern mapping (EPM-PA) and the population model-based EPM models as compared to grayscale computed tomography images for all cancer types considered in this study: cholangiocarcinoma (cholangio), hepatocellular carcinoma, and colorectal cancer.
4. DISCUSSION
The field of medical image analysis is going through a major paradigm change, with images being interpreted by radiologists “as-is” to being mined, analyzed, and transformed.16–18 Although MPCT provides time-dependent signals through different phases, MPCT images have traditionally been reviewed with each phase studied individually.
In this study, we proposed and tested a method of using the entire spectrum of MPCT imaging data across all phases by computing and mapping the root mean square deviation (RMSD) to increase tumor-to-normal liver tissue contrast. Although EPM is similar in concept to arterial enhancement fraction (AEF),10 it incorporates modeling of enhancement characteristics using all given phases of MPCT data after deformable image registration.
To our knowledge, this is the first study to perform image processing of liver MPCT data sets using an active breath-hold technique and deformable image registration. The control of breathing amplitude during image acquisition, along with further fine-tuning of liver volume registration using deformable image registration, were important steps for reducing artifacts. The mapping feature can be any computable and quantifiable representation of an enhancement profile and may be different for the disease site (or anatomic site of interest, such as hepatic veins) compared to normal parenchyma.10 For example, it is expected that MPCT can be used to estimate the area under the enhancement profile or the slope of enhancement uptake and washout. These other quantifiable features may be useful in visualizing tumors in certain cases and will be the subject of future investigations.
In this investigation, we chose RMSD because of its conceptual simplicity and computation. RMSD was computed by comparing the change in HU values of a given voxel throughout all given phases against what was expected for normal liver tissue. As subtle differences in each phase can accumulate over all phases, the RMSD feature may be considered a cumulative difference between the tumor and normal liver tissue. As expected, EPM based on RMSD showed higher CNR for tumors compared to any single phase of conventional CT. As shown in Figs. 7(a)–7(c), without extra image processing, the EPM based on RMSD excludes all areas outside of the liver volume, as for other organs, enhancement profile is far from that of normal liver tissues except that of the spleen, which has similar contrast uptake timing as the liver. However, because RMSD is, by definition, an absolute value, the hyperdensity or hypodensity differentiation is lost. In our phantom study, we chose to demonstrate the effect of image noise, tumor size, and tumor motion on EPM by using the tumor with a hypervascular enhancement curve, taken from prototypical HCC tumors. Notably, the same results from our phantom study would have been obtained for a hypovascular tumor, like CRC liver mets, since RMSD-based EPM uses an absolute value. Thus, the current form of EPM cannot differentiate hyperdensities and hypodensities. Ongoing work will improve this potential deficiency of EPM so that radiologists can easily see the hyper- or hypodensities on both grayscale and EPM-rendered images. One possible application of EPM’s high CNR is to visualize the boundary of infiltrative and poorly defined tumors for precise segmentation during planning for radiation treatment. In Fig. 9, we show an example of a tumor with an ill-defined boundary that made it difficult to contour the diseased area. In this case, EPM suggested the boundaries of the two tissue types on the basis of the enhancement characteristics. Future studies will correlate EPM-based images with surgical resection specimens to provide a “ground truth” for the borders and sizes of the tumors, and internal heterogeneity that EPM highlights. We plan to perform these radiological/pathological correlation studies using a 3-step deformable image registration process to account for changes in the tumor and its boundaries after resection, tissue fixation, and histopathology mounting. The process starts by using deformable image registration of whole-mount histology slides to ex vivo fixed tissue imaging, and then the ex vivo fixed tissue imaging to fresh tissue imaging, and finally fresh tissue imaging to in vivo diagnostic imaging.19
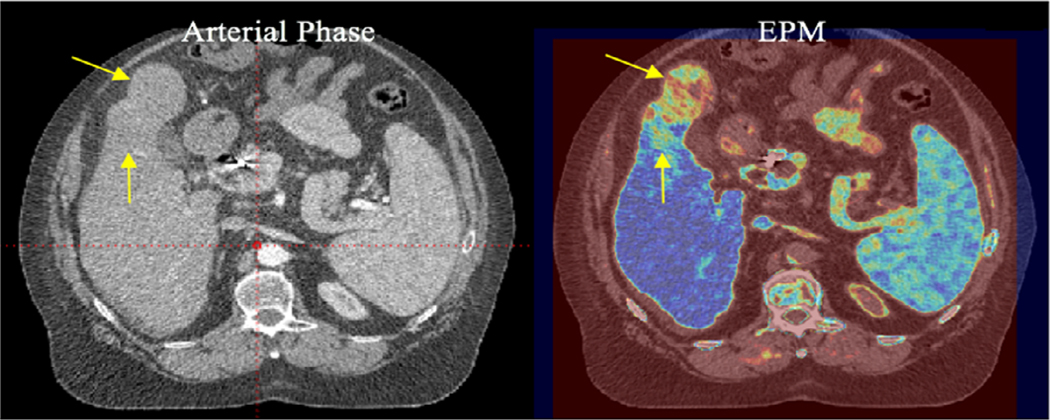
FIG. 9.
A 63-year-old man with hepatocellular cancer. Radiology showed an exophytic cancer with an ill-defined margin. Enhancement pattern mapping revealed the abnormal enhancement pattern, resulting in a clearer boundary between the tumor area and normal liver parenchyma.
The advantage of RMSD-based EPM is that it provides high CNR in all nonnormal liver tissue within the liver volume; the disadvantage, as demonstrated in the current study, is that it may also highlight noncancer tissues with enhancement patterns different from the generalized normal liver model. For example, as shown in Figs. 7(a)–7(c), the arteries and veins of the liver also exhibit a different signal from that of the liver parenchyma. Therefore, in the clinical setting, we expect that RMSD-based EPM should be used in conjunction with conventional MPCT image sets to screen and identify tissues with abnormal enhancement characteristics. Additionally, in the setting of radiotherapy, interventional radiology, and surgical treatment planning, the higher CNR of EPM may provide an opportunity to more accurately segment and target tumors with conventionally poorly defined boundaries. This study was designed to test the proof of concept of enhancing the visibility of tumor derived from MPCT by obtaining CNR measurements in real patients. EPM will need to be further validated for lesion detection with comparative studies with other imaging modalities such as dynamic contrast-enhanced MRI and functional imaging such as with single photon-emission CT. In particular, we envision clinical evaluation of the EPM technique combined with conventional reading compared to conventional reading alone. This clinical evaluation will include qualitative assessment of the lesions on one hand and also assessment of the number of benign and malignant lesions detected by each method, aiming to establish the impact of EPM on sensitivity and specificity. With further development, EPM may play a role in the early detection of cancer using MPCT or other multiparametric image techniques; it may also be useful in the assessment of treatment response over time by measuring changes from one image set to another.
5. CONCLUSIONS
In conclusion, EPM improved the tumor-to-normal tissue CNR compared to grayscale CT images in HCC, cholangiocarcinoma, and colorectal cancer liver metastasis cases. This technique does not require a hardware upgrade, and it has the potential to be clinically useful for the early detection, assessment, and contouring of diffusive tumors compared to using the conventional MPCT images alone.
ACKNOWLEDGMENTS
We gratefully acknowledge partial support from Jennifer and Wil VanLoh, KWS Foundation, Michael C Linn Family Foundation, Andrew Sabin Family Fellowship, Center for Radiation Oncology Research, the Sheikh Ahmed Center for Pancreatic Cancer Research, Khalifa Foundation, institutional funds from The University of Texas MD Anderson Cancer Center, equipment support by GE Healthcare and the Center of Advanced Biomedical Imaging, Project Purple, and Cancer Center Support (Core) Grant CA016672 from the National Cancer Institute to MD Anderson. Dr. Eugene Koay was also supported by NIH (U54CA210181–01, U01CA200468–01, R01CA218004–01A1, R01CA221971–01A1, 1U01CA214263–01A1, and U01CA196403).
Footnotes
CONFLICT OF INTEREST
The authors have no conflict of interest to disclose.
Contributor Information
Peter C. Park, Departments of Radiation Physics, The University of Texas MD Anderson Cancer Center, Houston, TX, USA
Gye W. Choi, Departments of Radiation Physics, The University of Texas MD Anderson Cancer Center, Houston, TX, USA Departments of Radiation Oncology, The University of Texas MD Anderson Cancer Center, Houston, TX, USA.
Mohamed M. Zaid, Departments of Radiation Physics, The University of Texas MD Anderson Cancer Center, Houston, TX, USA Departments of Radiation Oncology, The University of Texas MD Anderson Cancer Center, Houston, TX, USA.
Dalia Elganainy, Departments of Radiation Physics, The University of Texas MD Anderson Cancer Center, Houston, TX, USA; Departments of Radiation Oncology, The University of Texas MD Anderson Cancer Center, Houston, TX, USA.
Danyal A. Smani, Departments of Radiation Physics, The University of Texas MD Anderson Cancer Center, Houston, TX, USA Departments of Radiation Oncology, The University of Texas MD Anderson Cancer Center, Houston, TX, USA.
John Tomich, Space and Airborne Systems, Raytheon, McKinney, TX, USA.
Ray Samaniego, Space and Airborne Systems, Raytheon, McKinney, TX, USA.
Jingfei Ma, Departments of Radiation Physics, The University of Texas MD Anderson Cancer Center, Houston, TX, USA; Departments of Radiation Oncology, The University of Texas MD Anderson Cancer Center, Houston, TX, USA.
Eric P. Tamm, Departments of Radiation Physics, The University of Texas MD Anderson Cancer Center, Houston, TX, USA Departments of Radiation Oncology, The University of Texas MD Anderson Cancer Center, Houston, TX, USA.
Sam Beddar, Departments of Radiation Physics, The University of Texas MD Anderson Cancer Center, Houston, TX, USA; Departments of Radiation Oncology, The University of Texas MD Anderson Cancer Center, Houston, TX, USA.
Eugene J. Koay, Departments of Radiation Oncology, The University of Texas MD Anderson Cancer Center, Houston, TX, USA.
REFERENCES
- 1.Wong MC, Jiang JY, Goggins WB, et al. International incidence and mortality trends of liver cancer: a global profile. Sci Rep. 2017;7:45846. [DOI] [PMC free article] [PubMed] [Google Scholar]
- 2.Bipat S, van Leeuwen MS, Comans EF, et al. Colorectal liver metastases: CT, MR imaging, and PET for diagnosis–meta-analysis. Radiology. 2005;237:123–131. [DOI] [PubMed] [Google Scholar]
- 3.Mitsuzaki K, Yamashita Y, Ogata I, Nishiharu T, Urata J, Takahashi M. Multiple-phase helical CT of the liver for detecting small hepatomas in patients with liver cirrhosis: contrast-injection protocol and optimal timing. AJR Am J Roentgenol. 1996;167:753–757. [DOI] [PubMed] [Google Scholar]
- 4.Itoh S, Ikeda M, Achiwa M, Ota T, Satake H, Ishigaki T. Multiphase contrast-enhanced CT of the liver with a multislice CT scanner. Eur Radiol. 2003;13:1085–1094. [DOI] [PubMed] [Google Scholar]
- 5.Nino-Murcia M, Olcott EW, Jeffrey RB Jr., Lamm RL, Beaulieu CF, Jain KA. Focal liver lesions: pattern-based classification scheme for enhancement at arterial phase CT. Radiology. 2000;215:746–751. [DOI] [PubMed] [Google Scholar]
- 6.Laghi A, Iannaccone R, Catalano C, et al. Multiphase multislice spiral CT for liver assessment: optimization in cirrhotic patients. Radiol Med. 2002;103:188–195. [PubMed] [Google Scholar]
- 7.Francica G, Lapiccirella G. Focal liver lesions: one more example of discordance between contrast-enhanced sonography and CT pattern of enhancement. Am J Roentgenol. 2008;190:W222. [DOI] [PubMed] [Google Scholar]
- 8.Kim KW, Lee JM, Klotz E, et al. Quantitative CT color mapping of the arterial enhancement fraction of the liver to detect hepatocellular carcinoma. Radiology. 2009;250:425–434. [DOI] [PubMed] [Google Scholar]
- 9.Kim KW, Lee JM, Kim JH, et al. CT color mapping of the arterial enhancement fraction of VX2 carcinoma implanted in rabbit liver: comparison with perfusion CT. AJR Am J Roentgenol. 2011;196: 102–108. [DOI] [PubMed] [Google Scholar]
- 10.Kang SE, Lee JM, Klotz E, et al. Quantitative color mapping of the arterial enhancement fraction in patients with diffuse liver disease. AJR Am J Roentgenol. 2011;197:876–883. [DOI] [PubMed] [Google Scholar]
- 11.Koay EJ, Truty MJ, Cristini V, et al. Transport properties of pancreatic cancer describe gemcitabine delivery and response. J Clin Investig. 2014;124:1525–1536. [DOI] [PMC free article] [PubMed] [Google Scholar]
- 12.Wang H, Dong L, O’Daniel J, et al. Validation of an accelerated ‘demons’ algorithm for deformable image registration in radiation therapy. Phys Med Biol. 2005;50:2887–2905. [DOI] [PubMed] [Google Scholar]
- 13.Wang H, Dong L, Lii MF, et al. Implementation and validation of a three-dimensional deformable registration algorithm for targeted prostate cancer radiotherapy. Int J Radiat Oncol Biol Phys. 2005;61:725–735. [DOI] [PubMed] [Google Scholar]
- 14.Wang H, Krishnan S, Wang X, et al. Improving soft-tissue contrast in four-dimensional computed tomography images of liver cancer patients using a deformable image registration method. Int J Radiat Oncol Biol Phys. 2008;72:201–209. [DOI] [PubMed] [Google Scholar]
- 15.Crane CH, Koay EJ. Solutions that enable ablative radiotherapy for large liver tumors: fractionated dose painting, simultaneous integrated protection, motion management, and computed tomography image guidance. Cancer. 2016;122:1974–1986. [DOI] [PMC free article] [PubMed] [Google Scholar]
- 16.Kumar V, Gu Y, Basu S, et al. Radiomics: the process and the challenges. Magn Reson Imaging. 2012;30:1234–1248. [DOI] [PMC free article] [PubMed] [Google Scholar]
- 17.Lambin P, Rios-Velazquez E, Leijenaar R, et al. Radiomics: extracting more information from medical images using advanced feature analysis. Eur J Cancer. 2012;48:441–446. [DOI] [PMC free article] [PubMed] [Google Scholar]
- 18.Gillies RJ, Kinahan PE, Hricak H. Radiomics: images are more than pictures. They are data. Radiology 2016;278:563–577. [DOI] [PMC free article] [PubMed] [Google Scholar]
- 19.Samavati N, McGrath DM, Lee J, et al. Biomechanical model-based deformable registration of MRI and histopathology for clinical prostatectomy. J Pathol Inform. 2011;2:S10. [DOI] [PMC free article] [PubMed] [Google Scholar]


