Abstract
The giant Zambian mole rat (Fukomys mechowii) is a subterranean Afrotropical rodent noted for its regressed visual system and unusual patterns of circadian rhythmicity – within this species some individuals exhibit distinct regular circadian patterns of locomotor activity while others have arrhythmic circadian patterns. The current study was aimed at understanding whether differences in circadian chronotypes in this species affect the patterns and proportions of the different phases of the sleep-wake cycle. Physiological parameters of sleep (electroencephalogram and electromyogram) and behaviour (video recording) were recorded continuously for 72 h from 6 mole rats (3 rhythmic and 3 arrhythmic) using a telemetric system and a low-light CCTV camera connected to a DVD recorder. The results indicate that the arrhythmic individuals spend more time in waking with a longer average duration of a waking episode, less time in non-rapid eye movement (NREM) with a shorter average duration of an NREM episode though a greater NREM sleep intensity, and similar sleep cycle lengths. The time spent in rapid eye movement (REM) and the average duration of an REM episode were similar between the chronotypes.
Key Words: Rapid eye movement, Non-rapid eye movement, Slow wave sleep, Rodentia, Bathyergidae
Introduction
The reversible, homeostatically controlled state of reduced responsiveness, reduced motor ability and reduced metabolism commonly defines the physiological phenomenon of sleep [Siegel, 2008]. In mammals, this state is often separated into rapid eye movement (REM) and non-REM (NREM) stages that are differentiated by changes in the electroencephalogram (EEG) and electromyogram (EMG) amongst other features [Siegel, 2009]. Within mammals, sleep has been studied by visual observation or physiological recording in 17 orders, 47 families and 127 species [McNamara et al., 2008], but the exact function of sleep remains unclear.
Most mammals studied meet the standard criteria for sleep in that they have clearly distinguishable NREM and REM states [the marine mammals being unusual in this sense, Lyamin et al., 2008]. Tobler [1995] proposed that sleep is not fundamentally different in mammalian species, but Siegel [2004] suggests that adaptive mechanisms rather than phylogenetic relationships provide a better explanation of the variation in sleep time and other parameters across species. In contrast to this, Capellini et al. [2008] indicate that they have detected a ‘phylogenetic signal’ in mammalian sleep, perhaps indicating some predictability of this state across species. Detailed sleep studies in rodents have been examined in the rat [Alfoldi et al., 1990], mouse [Richardson et al., 1985; Ayala-Guerrero et al., 1998; Tang and Sanford, 2002], Djungarian hamster [Deboer et al., 1994], Syrian hamster [Tobler and Jaggi, 1987], chipmunk [Estep et al., 1978; Dijk and Daan, 1989], gerbil [Kastaniotis and Kaplan, 1976; Susic and Masirevic, 1986; Ambrosini et al., 1994], guinea pig [Tobler et al., 1993; Tobler and Franken, 1994], squirrel [Folk, 1963; Chepkasov, 1980], Octodon degus [Kas and Edgar, 1998] and the blind mole rat Spalax [Tobler and Deboer, 2001].
In the current study sleep was physiologically and behaviourally recorded in the giant Zambian mole rat (Fukomys mechowii) which is well known for its subterranean lifestyle, but other studies have reported a regressed visual system [Cooper et al., 1993; Hart et al., 2004; Nemec et al., 2004; McMullen et al., 2010] and unusual patterns of circadian rhythmicity [Lovegrove and Papenfus, 1995; Lovegrove and Muir, 1996; Oosthuizen et al., 2003] in other species of mole rat. It has been shown that the two main retinorecipient structures of the circadian system, the suprachiasmatic nucleus and the intergeniculate nucleus/leaflet, have different neuropeptide populations and afferents and are reduced in size in mole rats when compared to other rodents [Negroni et al., 2003; Bhagwandin et al., 2011]. Other approaches directed at understanding the unusual circadian rhythmicity in mole rats have shown that these subterranean rodents possess an endogenous melatonin rhythm that has a circadian pattern [Gutjahr et al., 2004] and that body temperature is not a reliable indicator of endogenous circadian activity in mole rats [Lovegrove and Muir, 1996]. Furthermore, locomotor activity studies have shown that within a particular species of mole rat some individuals have a rhythmic chronotype and others have a distinctly arrhythmic chronotype, and this is observed in both social and solitary species of mole rats [Oosthuizen et al., 2003].
The giant Zambian mole rat leads a social lifestyle in colonies of around 12 individuals, inhabiting diverse soil types in the tropical woodland and savannah regions of northern Zambia, southern Democratic Republic of Congo and central Angola [De Graaf, 1971; Sichilima et al., 2008]. This species is typically cinnamon brown in colour with a maximum body mass of 600 g for males and 350 g for females [Burda and Kawalika, 1993]. The current study aimed at determining: (1) whether measurable sleep parameters vary predictably with individuals that possess rhythmic chronotypes as opposed to individuals that are distinguishably arrhythmic and (2) whether dramatic changes in phenotype, such as the regressed visual system, affect sleep parameters in comparison to other rodents.
Materials and Methods
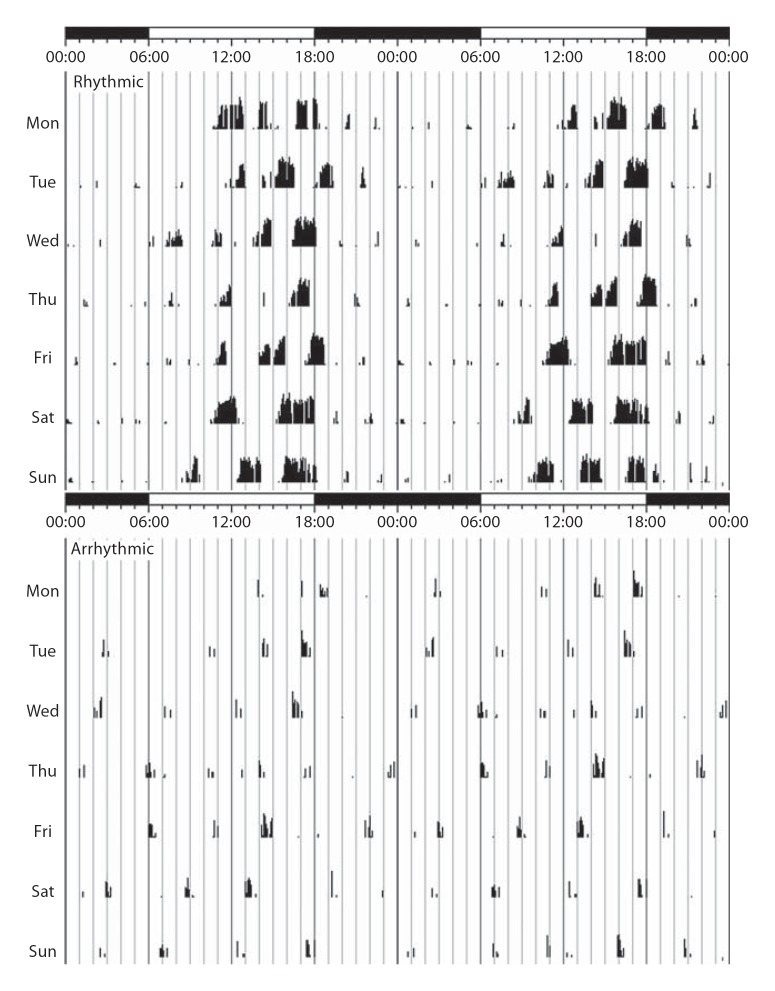
In the present study, physiological measures of EEG and EMG were telemetrically recorded from 6 individual wild-caught adult male giant Zambian mole rats (F. mechowii) (table 1). At the Mammal Research Institute, University of Pretoria these animals were identified as either rhythmic or arrhythmic (fig. 1), and once rhythmicity had been determined, these mole rats were transported to the University of the Witwatersrand for sleep recordings. Prior to the commencement of sleep recording, the animals were allowed 1 month of acclimatization in an isolated (to minimize noise and other disturbances) and environmentally controlled room (12-hour light/dark cycle with a constant ambient temperature of 25°C). A single mole rat was housed in an enclosure (60 × 50 cm) in which a transparent Perspex tube (20 cm long with a diameter of 6.5 cm) was secured to the floor of the enclosure. Wood shavings were used to line the floor, but not enough was placed to hinder visual observation of the animals. Each animal was fed a mixture of sweet potatoes, apples and carrots once a day. All animals were treated and used according to the guidelines of the University of the Witwatersrand Animal Ethics Committee, which parallel those of the NIH for the care and use of animals in scientific experimentation.
Table 1.
Data of rhythmic and arrhythmic mole rats scored in 5-second epochs for parameters measured in the current study
| Animal ID |
||||||||
|---|---|---|---|---|---|---|---|---|
| M3 | M8 | M9 | weighted mean rhythmic | M1 | M5 | M6 | weighted mean arrhythmic | |
| Circadian chronotype | rhythmic | rhythmic | rhythmic | arrhythmic | arrhythmic | arrhythmic | ||
| Body mass, g | 389 | 254 | 350 | 331 | 208 | 220 | 310 | 246 |
| Brain mass, g | 2.2 | 2.2 | 2.4 | 2.3 | 2.2 | 2.2 | 2.2 | 2.2 |
| Sex | male | male | male | male | male | male | ||
| TWT, % 24 h | 68 | 68 | 72 | 69 | 78 | 74 | 77 | 76 |
| TST, % 24 h | 32 | 30 | 26 | 29 | 20 | 23 | 23 | 22 |
| TNREM, % 24 h | 27 | 25 | 22 | 25 | 16 | 18 | 18 | 17 |
| TREM, % 24 h | 5 | 5 | 4 | 5 | 4 | 5 | 5 | 5 |
| Light period, % 12 h | ||||||||
| TWT | 68 | 77 | 74 | 73 | 82 | 74 | 79 | 78 |
| TST | 31 | 23 | 23 | 26 | 15 | 22 | 21 | 19 |
| TNREM | 27 | 20 | 19 | 22 | 11 | 17 | 17 | 15 |
| TREM | 5 | 4 | 3 | 4 | 4 | 5 | 4 | 4 |
| Dark period, % 12 h | ||||||||
| TWT | 67 | 60 | 71 | 66 | 74 | 75 | 75 | 75 |
| TST | 33 | 37 | 28 | 33 | 26 | 25 | 25 | 25 |
| TNREM | 28 | 30 | 24 | 27 | 21 | 19 | 19 | 20 |
| TREM | 6 | 7 | 5 | 6 | 4 | 5 | 6 | 5 |
TWT = Total waking time; TNREM = total slow wave sleep/NREM sleep; TREM = total REM.
Fig. 1.
Actograms illustrating circadian patterns of locomotor activity for 1 week in a rhythmic and arrhythmic giant Zambian mole rat (F. mechowii). These actograms indicate that the rhythmic mole rats have a predictable period of activity during the light period whereas locomotor activity in the arrhythmic animals is irregular.
Determination of Rhythmicity Patterns
Infrared detectors were used to detect activity patterns in the mole rats. The mole rats were exposed to differing light conditions that included light (L) and dark (D) cycles, DD cycles and LL cycles. Initially the experimental protocol started with a 12L:12D cycle (stage 1), and once entrainment was achieved, the light cycle was switched to constant darkness for 1 month (stage 2) to determine the expression of endogenous rhythms. For the purposes of the current study it was of importance to determine whether the mole rats were able to re-entrain to light cycles and switch their activity according to the light. If a mole rat was able to re-entrain, it was deemed ‘rhythmic’, and the converse was applied to ‘arrhythmic’ mole rats. Recorded behavioural activity data were analyzed using Actiview and Clocklab software that were also used to generate actigrams (for details regarding the specifics of circadian rhythm determination, see Oosthuizen et al. [2003]).
Surgery
Once the animals were acclimatized, they were administered a weight-dependent mixture of ketamine and xylazine (2:1, 0.01 ml/100 g, Bayer HealthCare). Throughout surgery, anaesthesia was maintained using isoflurane (at a concentration of 1–2.5% in an oxygen/70% nitrous oxide mixture, Safeline Pharmaceuticals) fed from a mask placed directly over the nostrils, which was supplied by a respirator. After shaving the scalp and left abdomen, a chemical disinfectant (CHX Chlorhexidine, 0.5% chlorhexidine in 75% alcohol, Kyron Laboratories) was applied to the skin using sterile swabs. Two incisions were made for implantation of the transmitter and electrodes, one over the midline of the skull and one over the left abdomen. At the abdominal incision a subcutaneous pocket was created to house the transmitter. The lead wires of the transmitter (two for EEG and one for EMG) were then fed subcutaneously from the abdominal incision to the cranial incision. Once the skin had been reflected at the cranial incision, the temporalis muscle over the left hemisphere was retracted to reveal the dorsal cranial surface. Cotton swabs immersed in H2O2 were used to clean the surface of the cranial vault and a small dental drill was used to bore two holes over the motor cortex of the left hemisphere without penetrating the dura mater. Thirty-six hours prior to surgical implantation, the transmitter and electrode wires were sterilized for 18 h using Cidex (a non-irritant chemical sterilant, Johnson & Johnson) and then placed in sterile normal saline for a further 18 h. Using a surgical microscope, the EEG electrodes (the leads of which were made out of stainless steel, have an outer diameter of 0.3 mm and a lead diameter of 0.2 mm) were placed into each hole to rest above the dura mater and secured in place using dental acrylic (Profdent). The EMG electrodes were then sutured into the nuchal musculature. Once the electrodes were secure, the transmitter was carefully inserted into the subcutaneous pocket and both incisions sutured. Anaesthesia was reversed by switching off the flow of isoflurane and the analgesic Temgesic (0.3 mg/100 g i.m., Reckitt Benckiser Healthcare) was administered. The animals were then returned to the enclosure and monitored for 7 days prior to recording.
Recording
EEG and EMG were recorded using a Data Sciences International (DSI) telemetric system that included a transmitter (PhysioTel Telemeric Systems, TL11 M2 F40-EET-Implant, the leads of which were made out of stainless steel, have an outer diameter of 0.3 mm and a lead diameter of 0.2 mm; weight: 7 g; volume: 4.5 ml; height: 13.8 mm) and a receiver (placed directly under the enclosure) connected to a DEM matrix that was connected to a computer. EEG and EMG were recorded continuously for 72 h in each animal and stored as a DSI file. Once recording was completed, the DSI files were converted to text files (containing information for the frequency bands 1.2–40 Hz; as well as information relating to muscle movements) that were subsequently converted into Spike files using the Spike 2 software (version 4.2, Cambridge Electronic Design). The Spike files subsequently generated presented the EEG and EMG data in a fashion that facilitated visual scoring of defined physiological states. Spectral power for the EEG was also calculated for each individual.
In addition to EEG and EMG, behaviour was recorded using the output of a low-light CCTV camera connected to the hard disk drive of a commercially available DVD recorder. At the cessation of recording, this information was copied to DVD-R discs and analyzed in conjunction with the physiological data. Red dark room lights were used to illuminate the enclosure throughout the 72-hour period.
Analysis
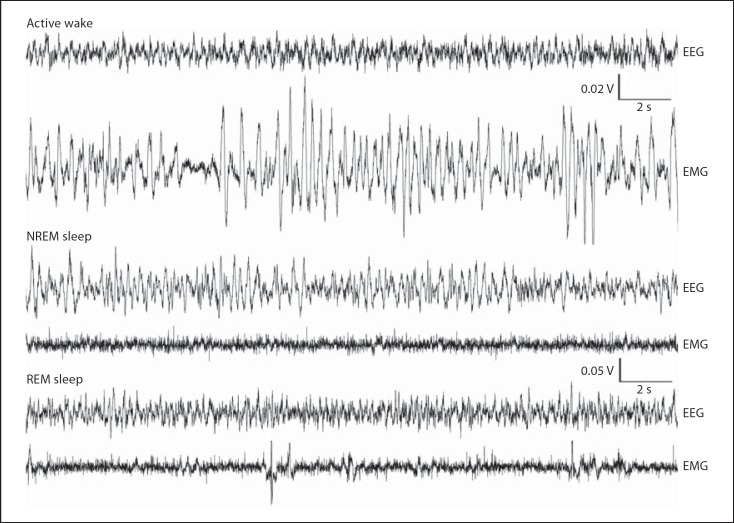
EEG and EMG allowed the scoring of 3 states: waking (W) which was characterized by low-amplitude, high-frequency EEG activity and irregular high-amplitude EMG activity; NREM which was defined by high-amplitude, low-frequency EEG activity and stable low-amplitude EMG activity, and REM (R) which was defined by low-amplitude, high-frequency EEG activity (similar to that of waking) and low-amplitude EMG activity that displayed large, high-amplitude infrequent spikes that were correlated with observed behavioural muscle twitches and jerks. EEG and EMG were scored in 5-second epochs and the results entered into a Microsoft Excel-generated template. Subsequently, these data were rescored at 1-min intervals by employing a mode formula (using Microsoft Excel) on the 5-second scored data, whereby the modal state for each minute was recorded.
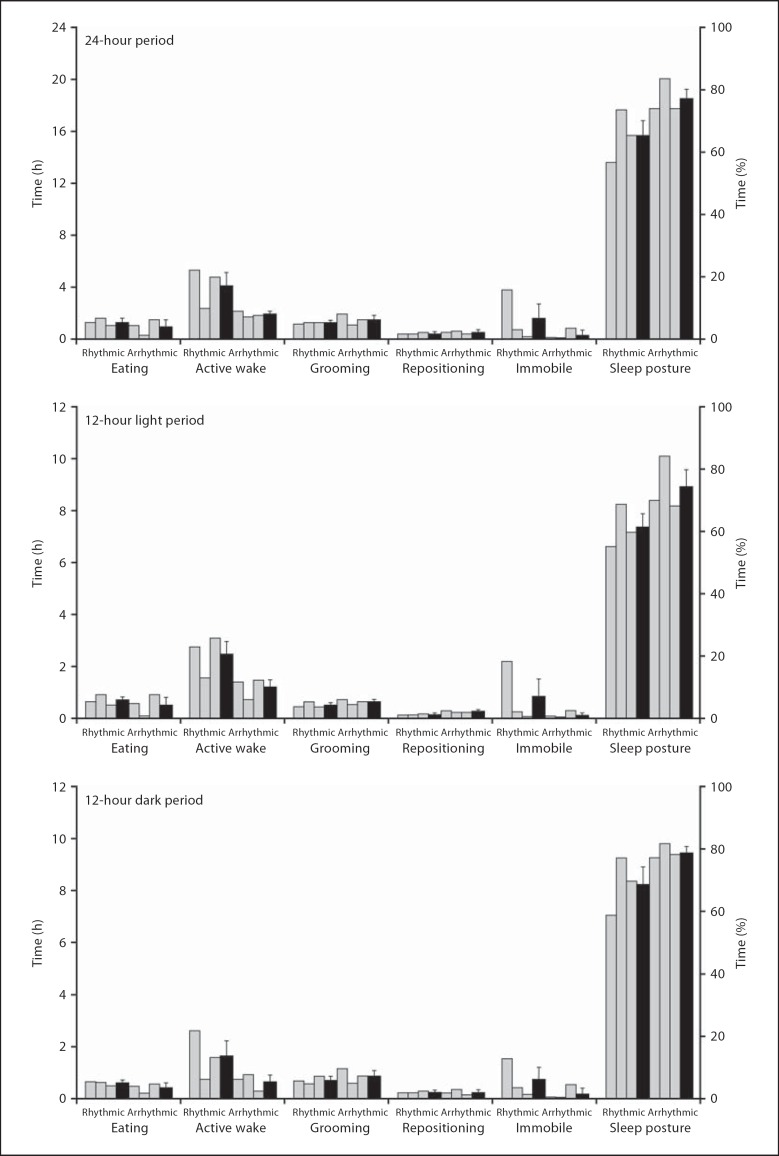
Behavioural data was scored at 1-min intervals (where a state was recorded only if it persisted for 50% or more of the scoring interval) as eating (1), active wake (2), grooming (3), repositioning (4), immobile (5) and sleep posture (6), the latter of which was assigned when the animal assumed a curled ‘ball-like’ position where the head was noticeably tucked underneath the body. The time spent in wake and sleep states (represented as a percentage of 24 h) and distribution of wake and sleep states between light and dark periods (percentage of 12 h) for both physiological and behavioural data were calculated in each individual.
The average number of episodes of wake and sleep states and the average duration of an episode of wake and sleep states were calculated for a 24-hour cycle and for light and dark periods. The duration of an episode of waking, NREM and REM was determined by calculating the total amount of time spent in a wake or sleep state and dividing it by the total number of episodes of the particular sleep and wake state. In 4 individuals the average spectral power of slow-wave activity (SWA, 1.2–4.0 Hz) during NREM for consecutive 2-hour periods was plotted for the 72-hour recording. Total spectral power of SWA during NREM was calculated in rhythmic and arrhythmic groups and compared between light and dark periods. The length of a sleep cycle was calculated as the difference in time between the onsets of consecutive REM episodes. This calculation eliminated episodes of waking with an uninterrupted duration that was greater than 10 min.
Data collected for the circadian chronotypes of the current study were analyzed for statistically significant differences in the time spent in wake and sleep states, the average number of episodes of wake and sleep states and the average duration of an episode of wake and sleep states, within and between chronotypes and within and between days and light and dark periods. Statistical tests used in the current study employed the Paleontological Statistics (PAST, version 2.02) software programme [Hammer et al., 2001]. A normality test was employed on each dataset and if the dataset was normally distributed (p > 0.05), a one-way ANOVA was employed, but if the dataset was not normal in its distribution (p < 0.05), a Mann-Whitney test was performed. Statistical significance was noted when the p < 0.05 for both ANOVA and Mann-Whitney tests. To determine the root of the statistical significance, univariate analyses were carried out for the datasets in question.
Results
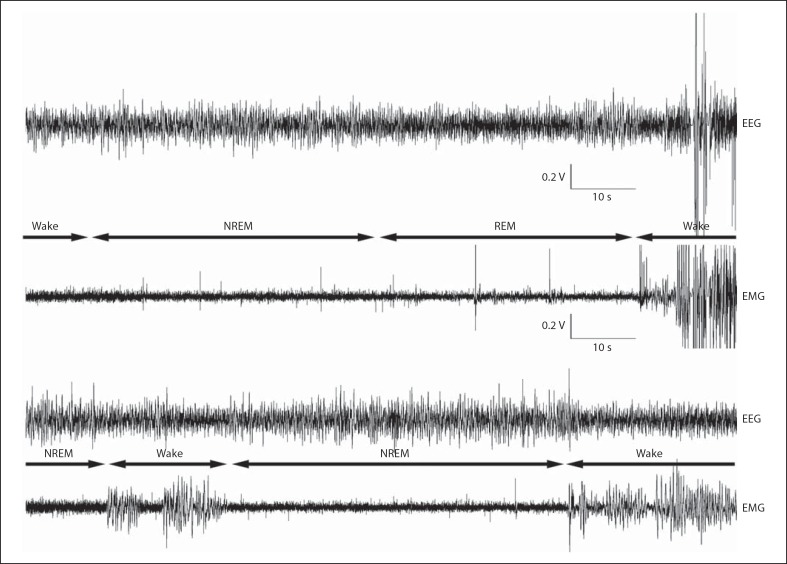
In the present study, electroencephalographic waking, NREM and REM, through the recording of EEG and EMG, were telemetrically recorded continuously over a period of 72 h, in conjunction with behavioural recordings, from 6 individual giant Zambian mole rats (F. mechowii). Three of the mole rats displayed a rhythmic chronotype, while 3 displayed an arrhythmic chronotype (fig. 1). Behaviourally scored waking involved the animal moving around the enclosure, eating, grooming and reposturing (fig. 2). These behavioural states were identified physiologically by low-amplitude, high-frequency EEG activity and irregular high-amplitude EMG activity. NREM was behaviourally identified when the animal presented itself in either a curled ‘ball-like’ position, where the head was noticeably tucked under the body, or a state of immobility with the head resting on the floor of the enclosure. NREM was characterized by high-amplitude, low-frequency EEG activity and stable low-amplitude EMG activity. REM sleep was behaviourally scored when body twitches or muscle jerks were observed while the animal was in a curled ‘ball-like’ posture or other immobile postures such as lying prone. This state was physiologically identified by low-amplitude, high-frequency EEG waves (similar to that seen in waking) and when the EMG had a very low muscle tone (lower than waking and NREM) and when the EMG displayed large, high-amplitude infrequent spikes (that correlated with behavioural twitches and jerks upon post hoc analysis) (fig. 3, 4). The results of the present study showed that the rhythmic chronotype spent more time in a state of NREM and had a longer average duration of an episode of NREM, while the arrhythmic chronotype spent more time in a state of waking and had a longer average episode of waking. The time spent in REM sleep, the average number of episodes of REM sleep and the average duration of an episode of REM were similar between the rhythmic and arrhythmic groups.
Fig. 2.
Graphs showing data for the various behavioural states in rhythmic and arrhythmic individuals (grey bars, same individuals from left to right in each graph and in all subsequent similar graphs) and the respective weighted means (black bars). The graphs represent the percentage and average amount of time spent in the various behavioural states for a 24-hour cycle (from 72 h of recording) and for the 12-hour light and dark periods (from 36 h of recording).
Fig. 3.
Polygraphic traces illustrating examples of the EEG and EMG recorded during sleep and wake states in the giant Zambian mole rat (F. mechowii). Active wake was characterized by low-amplitude, high-frequency EEG and high-amplitude EMG. NREM was characterized by high-amplitude, low-frequency EEG and low-amplitude EMG. REM sleep was characterized by low-amplitude, high-frequency EEG (similar to that seen in waking) and low-amplitude EMG that contained large, high-amplitude infrequent spikes (indicative of muscle twitches and jerks).
Fig. 4.
Polygraphic traces illustrating examples of the EEG and EMG during transitions from wake to NREM to REM to wake between wake and NREM.
Behavioural Analysis
Behaviour was recorded continuously over 72 h in each animal (n = 6) and in 1-min epochs such as eating, active wake, grooming, repositioning, immobility and sleep posture (curled ‘ball-like’ position). Behavioural analysis showed that, on average per 24 h, the rhythmic mole rats spent 1.3 h eating, 4.1 h in a state of active wake, 1.3 h grooming, 0.4 h repositioning, 1.6 h immobile and 15.6 h in sleep postures. The arrhythmic animals spent 1 h eating, 1.9 h in a state of active wake, 1.6 h grooming, 0.5 h repositioning, 0.3 h immobile and 18.5 h in sleep postures (fig. 2) (online suppl. videos 1–8, www.karger.com?doi=10.1159/000330360, showing the behavioural states). When the distributions of the various behavioural states between light and dark periods were compared, it was observed that both rhythmic and arrhythmic animals spent, on average, similar times during both light and dark periods in the various behavioural states. The rhythmic animals were in a state of active wake 1.5 times more during the light than the dark periods, whereas the arrhythmic individuals were actively awake almost twice the time in light compared to dark periods (fig. 2). A comparison of the total times spent in various behavioural states between the rhythmic and arrhythmic groups yielded no significant statistical differences across the 24-hour periods or between the 12-hour light and dark periods.
Physiological Analysis
State Definitions
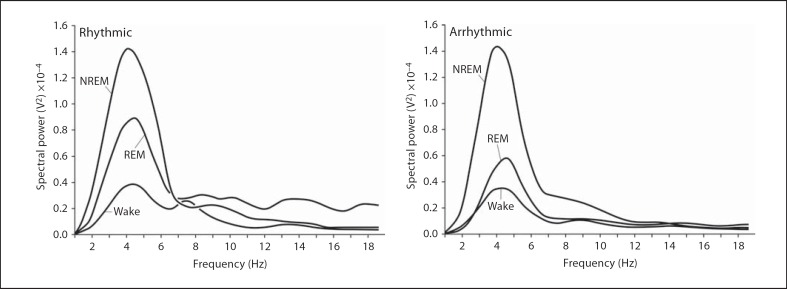
The state of wake was determined by low-amplitude, high-frequency EEG activity and irregular high-amplitude EMG activity and this was behaviourally correlated with activities that included moving around the enclosure (often in a clockwise direction), attempted burrowing which was identified in one of two ways: (1) when the animal was observed gnawing the inside of the Perspex tube using their incisors and (2) when the animal would flick the wood shavings backwards using their hind legs while moving in a backward direction, eating, grooming and repositioning (online suppl. videos 1–4, 8). The state of NREM was identified by high-amplitude, low-frequency EEG activity and stable low-amplitude EMG activity and this was behaviourally associated with either the curled ‘ball-like’ position defined when the head was tucked beneath the abdomen of the animal (behaviourally scored as sleep posture), or when the head was rested on the floor of the enclosure (behaviourally scored as immobile) (online suppl. videos 5, 6). REM sleep was identified by low-amplitude, high-frequency EEG waves (similar to that seen in waking) and when the EMG displayed large, high-amplitude infrequent spikes and this was behaviourally identified as varying combinations of neck jerks, leg jerks and body jerks that correlated with the large, high-amplitude spikes observed in the EMG during sleep posture or immobility (fig. 2, 3) (online suppl. video 7). It was observed that the frequency range for spectral power in the rhythmic group was 0–7 Hz for the physiologically defined wake and sleep states but the peak amplitude of spectral power occurred at 4.5 Hz during waking, 4 Hz during NREM and 4.4 Hz during REM sleep. The arrhythmic group also displayed the 0- to 7-Hz range for spectral power, but it was noticed that the peak amplitude of spectral power occurred at 4.5 Hz during waking, 3.9 Hz for NREM and 4.6 Hz during REM sleep in this group (fig. 5).
Fig. 5.
Graphs indicating the spectral power range during wake and sleep states for rhythmic and arrhythmic mole rats.
Time Spent in Wake and Sleep States
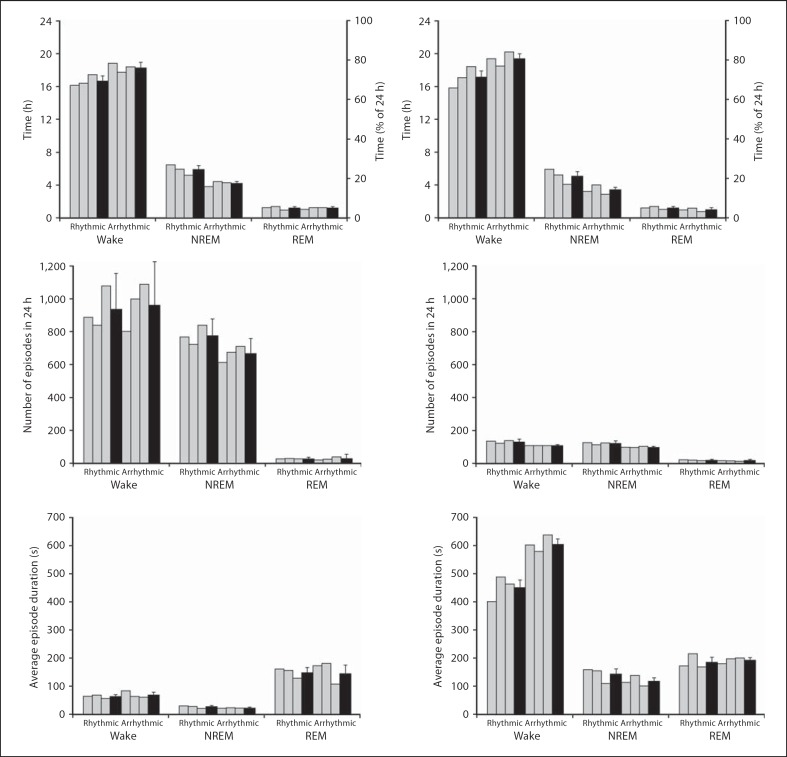
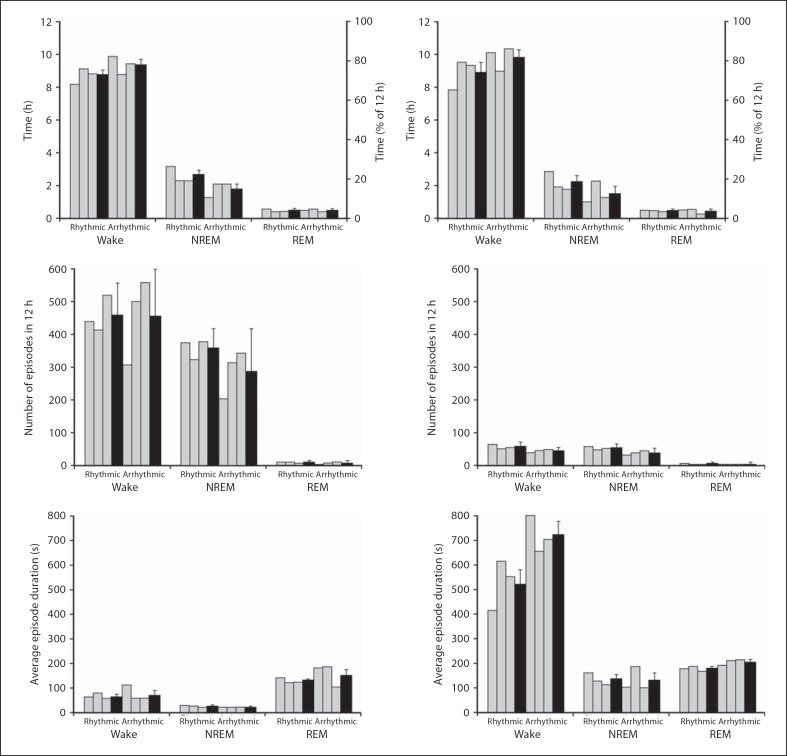
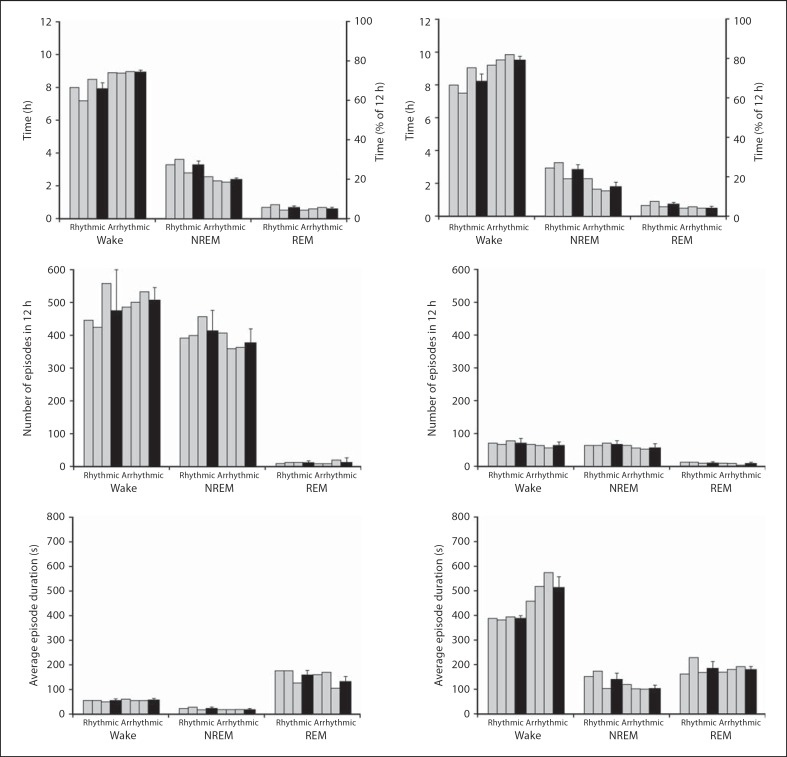
Upon analysis of the physiological data scored in 5-second epochs, it was observed that the rhythmic animals, on average for a 24-hour cycle, spent 16.7 h (70%) in a state of wake (the distribution of which was higher in the light period than the dark period), 5.9 h (26%) in NREM (the distribution of which was higher in the dark period than the light period) and 1.2 h (5.0%) in REM sleep (where the distribution was higher in the dark period than the light period). Total sleep time (TST) measured 29% (∼7.0 h) and the percentage of REM of TST was 16% (∼1.2 h) (tables 1, 3). The arrhythmic individuals generally spent 18.3 h (77%) in a state of wake (the distribution of which was higher in the light period than the dark period), 4.2 h (19%) in NREM (the distribution of which was higher in the dark period than the light period) and 1.1 h (4.6%) in REM sleep (where the distribution remained similar between light and dark times) (fig. 6, 7, 8). TST measured 22% (∼5.3 h) and the percentage of REM of TST was 21% (∼1.1 h) (tables 1, 3)
Table 3.
Results from rhythmic and arrhythmic mole rats of the current study for TST, percentage REM sleep of TST, average duration of an episode of NREM, and average duration of episode of REM compared to other rodents
| TST, h | % REM of TST | Duration NREM episode, min | Duration REM episode, min | Source | |
| Cryptomys mechowii, rhythmic 5-second epoch scored data | 7 | 16 | 0.5 | 2.5 | current study |
| Cryptomys mechowii, arrhythmic 5-second epoch scored data | 5.3 | 21 | 0.4 | 2.4 | current study |
| Cryptomys mechowii, rhythmic 1-min epoch scored data | 6.2 | 19 | 2.5 | 3.2 | current study |
| Cryptomys mechowii, arrhythmic 1-min epoch scored data | 4.3 | 23 | 2.0 | 3.3 | current study |
| Rattus norwegicus, Long-Evans rat | 13.2 | 18 | 5.2 | 1.7 | 1, 2, 6, 7 |
| Rattus norwegicus, Sprague-Dawley rat | 13.7 | 18 | 5.2 | 1.7 | 1, 2, 6, 7 |
| Mus musculus, laboratory mouse | 12.8 | 13–20 | 4.7–7.1 | 0.7–0.9 | 3, 9 |
| Mesocricetus auratus, golden hamster | 14.4 | – | – | – | 2 |
| Meriones unguiculatus, Mongolian gerbil | 15.3 | – | – | – | 4 |
| Chinchilla laniger, chinchilla | 12.5 | – | – | – | 2 |
| Spalax ehrenbergi, blind mole rat | 12.4 | 15.1 | 9.7 | 2.5 | 5 |
| Djungarian hamster | – | 15 | 7 | 1.8 | 8 |
Fig. 6.
Graphs illustrating physiological data (5-second epoch scoring, left column, and 1-min epoch scoring, right column) for sleep and wake states during a 24-hour cycle in rhythmic and arrhythmic individuals (grey bars) and the respective weighted means (black bars). The graphs indicate percentage and the average amount of time that is spent in wake or sleep states, the average number of episodes for wake and sleep states and the average duration of an episode in wake and sleep states.
Fig. 7.
Graphs illustrating physiological data (5-second epoch scoring, left column, and 1-min epoch scoring, right column) for sleep and wake states during the 12-hour light period in rhythmic and arrhythmic individuals (grey bars) and the respective weighted means (black bars). The graphs indicate percentage and the average amount of time spent in wake or sleep states, the average number of episodes for wake and sleep states and the average duration of an episode in wake and sleep states.
Fig. 8.
Graphs illustrating physiological data (5-second epoch scoring, left column, and 1-min epoch scoring, right column) for sleep and wake states during the 12-hour dark period in rhythmic and arrhythmic individuals (grey bars) and the respective weighted means (black bars). The graphs indicate percentage and the average amount of time spent in wake or sleep states, the average number of episodes for wake and sleep states and the average duration of an episode in wake and sleep states.
When the physiological data was scored at 1-min intervals, the results revealed that the rhythmic group, on average for a 24-hour cycle, spent 17.1 h (71%) in a state of wake (the distribution of which was higher in the light period compared to the dark period), 5.1 h (21%) in NREM (the distribution of which was higher in the dark period compared to the light period) and 1.2 h (5.0%) in REM sleep (where the distribution was slightly higher in the dark period compared to the light period). TST measured 26% (∼6.2 h) and the percentage of REM of TST was 19% (∼1.2 h) (tables 2, 3). Similarly, the arrhythmic individuals spent 19.4 h (81%) in a state of wake (the distribution of which was higher in the light period compared to the dark period), 3.4 h (14%) in NREM (the distribution of which was slightly higher in the dark period compared to the light period) and 1 h (4.2%) in REM sleep (where the distribution was slightly higher in the dark period than the light period) (fig. 6, 7, 8). TST measured 18% (∼4.3 h) and the percentage of REM of TST was 23% (∼1 h) (tables 2, 3).
Table 2.
Data of rhythmic and arrhythmic mole rats scored in 1-min epochs for parameters measured in the current study
| Animal ID |
||||||||
|---|---|---|---|---|---|---|---|---|
| M3 | M8 | M9 | weighted mean rhythmic | M1 | M5 | M6 | weighted mean arrhythmic | |
| Circadian chronotype | rhythmic | rhythmic | rhythmic | arrhythmic | arrhythmic | arrhythmic | ||
| Body mass, g | 389 | 254 | 350 | 331 | 208 | 220 | 310 | 246 |
| Brain mass, g | 2.2 | 2.2 | 2.4 | 2.3 | 2.2 | 2.2 | 2.2 | 2.2 |
| Sex | male | male | male | male | male | male | ||
| TWT, % 24 h | 66 | 71 | 77 | 72 | 72 | 81 | 78 | 80 |
| TST, % 24 h | 30 | 28 | 21 | 26 | 18 | 22 | 15 | 18 |
| TNREM, % 24 h | 25 | 22 | 17 | 21 | 14 | 17 | 12 | 14 |
| TREM, % 24 h | 5 | 6 | 4 | 5 | 4 | 5 | 3 | 4 |
| Light period, % 12 h | ||||||||
| TWT | 66 | 80 | 78 | 75 | 85 | 75 | 87 | 82 |
| TST | 29 | 20 | 19 | 23 | 12 | 24 | 13 | 16 |
| TNREM | 24 | 16 | 15 | 19 | 8 | 19 | 11 | 13 |
| TREM | 4 | 4 | 4 | 4 | 4 | 5 | 3 | 4 |
| Dark period, % 12 h | ||||||||
| TWT | 67 | 63 | 76 | 68 | 77 | 80 | 82 | 80 |
| TST | 31 | 35 | 24 | 30 | 23 | 19 | 17 | 20 |
| TNREM | 25 | 28 | 19 | 24 | 19 | 14 | 13 | 15 |
| TREM | 6 | 8 | 5 | 6 | 4 | 5 | 4 | 5 |
TWT = Total waking time; TNREM = total slow wave sleep/NREM sleep; TREM = total REM.
The time spent in waking, NREM and REM was then statistically compared (using both scoring techniques) between the groups for the 72-hour recording and the light and dark periods. With regard to the 5-second epoch scored data, statistical significance was noted between the groups in: (1) the time spent in waking (one-way ANOVA, p value: 2.99E–06, where the arrhythmic group showed a higher mean amount of time spent awake), (2) the time spent in waking during the light period (one-way ANOVA, p value: 0.015, where the arrhythmic group showed a higher mean amount of time spent awake), (3) the time spent in waking during the dark (one-way ANOVA, p value: 1.81E–05, where the arrhythmic group showed a higher mean amount of time spent awake), (4) the time spent in NREM (one-way ANOVA, p value: 5.32E–09, where the rhythmic group showed a higher mean amount of time spent in NREM), (5) the time spent in NREM during the light period between days (one-way ANOVA, p value: 0.0392, where the rhythmic group showed a higher mean amount of time spent in NREM), and (6) the time spent in NREM during the dark period between days (one-way ANOVA, p value: 0.0028, where the rhythmic group showed a higher mean amount of time spent in NREM). No statistically significant differences were noted for REM sleep times in the 5-second epoch data. When the 1-min epoch data were compared, no statistically significant differences between the groups were observed.
Number of Episodes of Wake and Sleep States
The number of episodes of waking, NREM and REM sleep were calculated for both 5-second epoch data and 1-min epoch data, in both rhythmic and arrhythmic groups. The results of the 5-second epoch data indicate that within the rhythmic group, the average number of episodes in 24 h was: 940 for waking (the number of which was higher in the dark period than in the light period), 779 for NREM (the number of which was higher during the dark period compared to the light period) and 28 for REM sleep (where the number was higher in the dark period than in the light period). The average number of episodes for the arrhythmic group for 24 h was: 966 for the waking state (the number of which was higher during the dark period compared to the light period), 669 for NREM (the number of which was higher in the dark period than the light period) and 28 for REM sleep (where the number was higher in the dark period compared to the light period) (fig. 6, 7, 8). Analysis of the 1-min epoch data showed that the average number of episodes during a 24-hour cycle within the rhythmic group was: 136 for waking (the number of which was higher during the dark period compared to the light period), 127 for NREM (the number of which was higher in the dark period compared to the light period) and 23 for REM sleep (where the number was slightly higher in the dark period compared to the light). The arrhythmic average episodic composition for the 1-min epoch data was: 115 for waking (the number of which was higher in the dark period than in the light period), 103 for NREM (the number of which was higher in the dark period compared to the light period) and 18 for REM (where the number was slightly higher in the dark period compared to the light period) (fig. 6, 7, 8).
The number of episodes for waking, NREM and REM were statistically compared (using both scoring techniques) between the groups for the 72-hour recording and the light and dark periods. With regard to the 5-second epoch data, statistical significance was noted between the groups in: (1) the number of NREM episodes (one-way ANOVA, p value: 0.0026, where the rhythmic group showed a higher mean number of episodes), and (2) the number of NREM episodes during the light period (one-way ANOVA, p value: 0.0059, where the rhythmic group showed a higher mean number of episodes). No statistically significant differences between the groups were observed when the 1-min epoch data were compared.
Duration of Wake and Sleep States
The average duration of an episode of waking, NREM and REM sleep was calculated for both 5-second and 1-min epoch data in both rhythmic and arrhythmic groups. The results of the 5-second epoch data indicate that within the rhythmic group, the average duration of an episode was 64 s for waking (the duration of which was longer during the light period than the dark period), 27 s for NREM (where the duration was longer in the dark period than the light period) and 150 s for REM sleep (where the duration was longer in the light period than in the dark period). The arrhythmic group revealed an average duration of an episode of 68 s for waking (where the duration was longer in the light period than the dark period), 23 s for NREM (where the duration was similar between the light and dark period) and 146 s for REM sleep (where the duration was longer in the dark period than the light period) (fig. 6, 7, 8). Analysis of the 1-min epoch data showed that the average duration of an episode of waking was 453 s (where the duration was longer in the dark period than in the light period), 147 s for NREM (where the duration was longer in the dark period than in the light period) and 189 s for REM sleep (where the duration was longer in the dark period than in the light period). The arrhythmic group revealed an average duration for an episode of waking of 609 s (where the duration was longer in the light period than in the dark period), 119 s for NREM (where the duration was longer in the light period than in the dark period) and 195 s for REM sleep (where the distribution was longer in the light period than in the dark period) (fig. 6, 7, 8).
The average duration of an episode of waking, NREM and REM was then statistically compared (using both scoring techniques) between the groups for the 72-hour recording and the light and dark periods. With regard to the 5-second epoch data, statistical significance was noted between the groups in: (1) the average duration of a waking episode (one-way ANOVA, p value: 0.0156, where the arrhythmic group showed a higher mean average duration); (2) the average duration of a waking episode during the dark period (one-way ANOVA, p value: 0.0164, where the arrhythmic group showed a higher mean average duration); (3) the average duration of an NREM episode (one-way ANOVA, p value: 1.99E–04, where the rhythmic group showed a higher mean average duration), and (4) the average duration of an NREM episode during the light period (one-way ANOVA, p value: 0.0059, where the rhythmic group showed a higher mean average duration). No statistically significant differences between the groups were observed when 1-min epoch data were compared.
SWA and Spectral Power
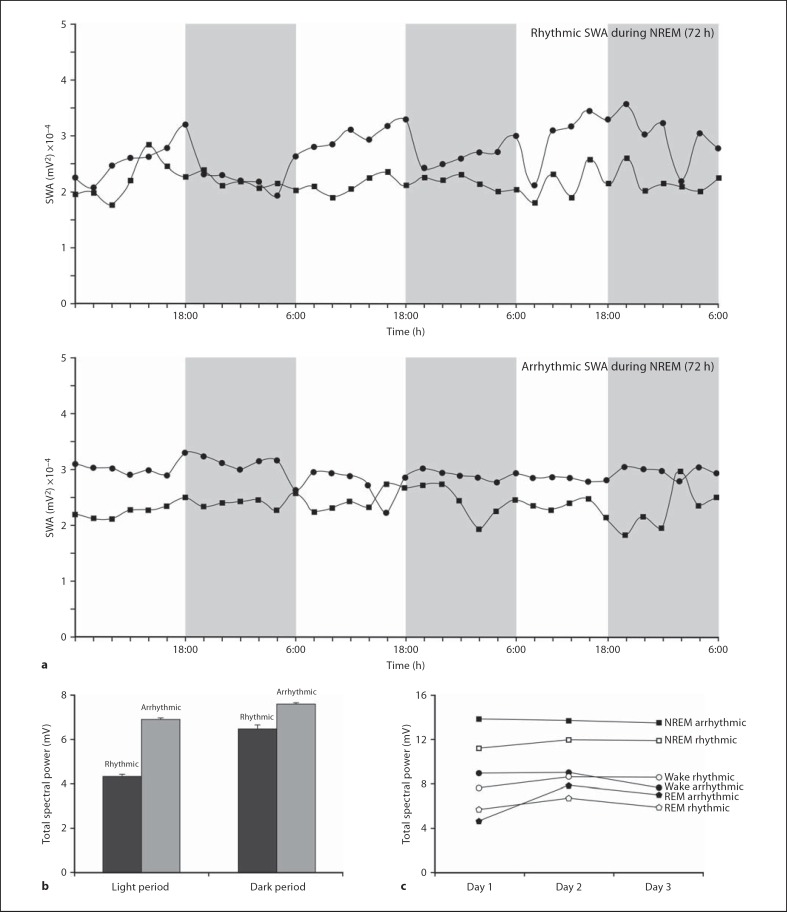
Statistical analysis of spectral power during sleep and wake states of both chronotypes of mole rats showed statistical significance in: (1) waking episodes compared to NREM episodes (p < 0.05, where NREM episodes had a higher mean), and (2) NREM episodes compared to REM episodes (p < 0.05, where NREM episodes had a higher mean) (fig. 5). Comparisons of spectral power during wake and sleep states between the chronotypes of mole rat showed no statistical differences, though this result may be influenced by small sample sizes of the respective chronotypes. Spectral power (from the frequency band 1.2–4 Hz) is used to indicate the intensity of the SWA. The distribution of spectral power was calculated as an average of 2-hour intervals. In the present study, SWA (calculated as a measure of spectral power) was compared between the groups during waking, NREM and REM sleep. It was observed that SWA was highest during NREM sleep and lowest during REM sleep in both groups of mole rats. The arrhythmic group showed a higher SWA during NREM sleep compared to the rhythmic group. When SWA was analyzed between the groups during the light and dark period, it was observed that the arrhythmic group showed a higher SWA during NREM in both the light and dark period compared to the rhythmic group (fig. 9).
Fig. 9.
Graphs representing the variations of spectral power of SWA in NREM for 72 h between rhythmic and arrhythmic groups (a), the total spectral power of SWA in NREM for 72 h during the light and dark phases between rhythmic and arrhythmic groups (b), and the total spectral power in SWA during sleep and wake states for 72 h between rhythmic and arrhythmic groups for each day (c).
State Transitions and REM Periodicity
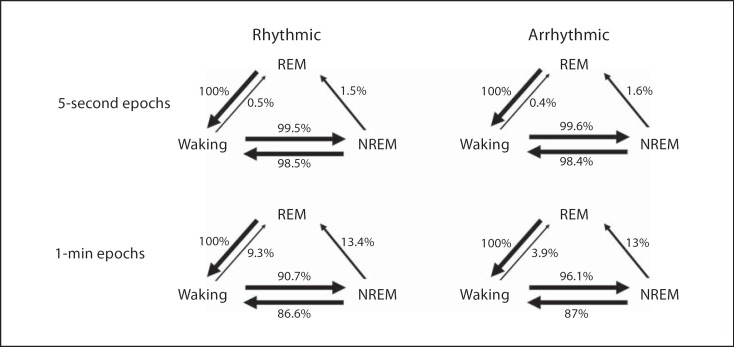
Transitions between the physiologically identified states were counted in both groups for the 5-second and 1-min scored data. The 5-second data showed that from the waking state the rhythmic individuals transitioned with greater frequency to NREM (99.5%) and only 0.5% to REM, whilst the arrhythmic group transitioned to these states 99.6 and 0.4%, respectively. From a state of NREM the rhythmic group transitioned significantly more often to waking (98.5%) than to REM (1.5%) while the arrhythmic group transitioned to these states 98.4 and 1.6%, respectively. In both groups, the state of REM transitioned only to waking (fig. 10, 11). The 1-min scored data showed that from the state of waking the rhythmic group transitioned with greater frequency to NREM (90.7%) than to REM (9.3%) while the arrhythmic group transitioned to these states 96.1 and 3.9%, respectively. From a state of NREM the rhythmic group transitioned significantly more often to waking (86.6%) than to REM (13.4%) while the arrhythmic group transitioned to these states 87 and 13%, respectively. Transitions from a state of REM were limited to waking only in both groups (fig. 10, 11).
Fig. 10.
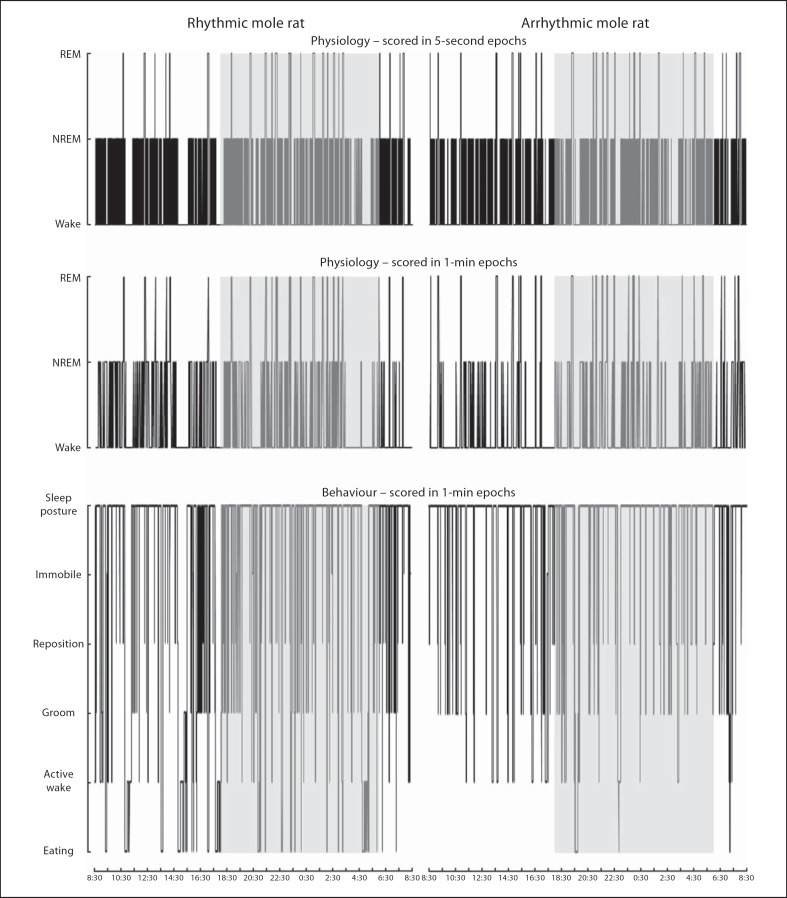
Hypnograms depicting physiological (5-second epoch scoring and 1-min epoch scoring) and behavioural data (1-min epoch scoring) in 24 h from a rhythmic and an arrhythmic individual. These hypnograms illustrate the compatibility of visually scored transitions between defined physiological wake and sleep states and the various behavioural states. Grey shaded areas indicate the dark period of a 24-hour cycle.
Fig. 11.
Flow diagrams illustrating transitions (represented as a percentage) between physiological wake and sleep states in 24 h for 5-second and 1-min epoch scoring data from rhythmic and arrhythmic individuals.
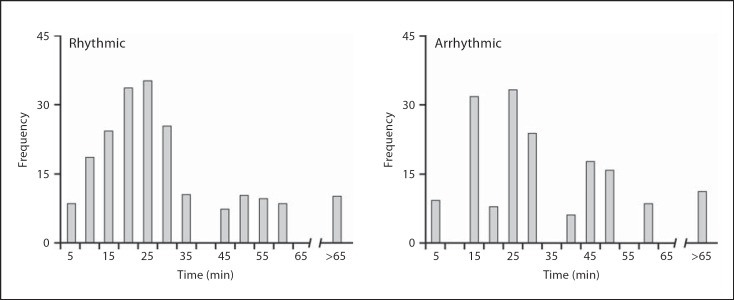
REM periodicity was calculated as the difference in time (1-min data only) between the onsets of consecutive REM episodes, and also when episodes of waking with a duration of greater than 10 min were eliminated (fig. 12). The results revealed that the rhythmic group exhibited a higher frequency of REM onset within a 1-hour period indicating that the peak sleep cycle duration was 25–30 min in length. A similar scenario was noted when waking episodes greater than 10 min were eliminated, but peak cycle lengths were observed in the range of 15–25 min. The arrhythmic group showed a relative variation in the frequency of REM onsets within a 1-hour bracket with a peak cycle length that occurred in the range of 10–15 and 20–25 min, suggesting a more a variable cycle duration in this group (fig. 12).
Fig. 12.
Graphs representing the time lapse (5-min periods) between onsets of consecutive physiologically identified REM episodes (REM periodicity) for 1-min epoch scoring data from rhythmic and arrhythmic individuals excluding episodes of waking greater than 10 min.
Discussion
The present study was undertaken to examine whether differences in wake and sleep states were readily observable in a species of mole rat from which individuals with a rhythmic or arrhythmic chronotype were identifiable and whether a regressed visual system affected these parameters in comparison to other rodents. The current study used established techniques for identifying the chronotype of the individual mole rats [Oosthuizen et al., 2003] and then employed telemetric recording of physiological EEG and EMG combined with behavioural recording. In assigning physiological states the EEG and EMG enabled the identification of wake, NREM and REM sleep states in this species, and these assignations correlated closely with behavioural recordings. We used both a 5-second epoch scoring method and a 1-min epoch scoring method to probe for potential differences, both methods having advantages and disadvantages in revealing similarities and differences, of which several were noted. The results indicate that the arrhythmic individuals spent more time in waking with a longer average duration of a waking episode, and less time in NREM with a shorter average duration of an NREM episode, though with a greater SWA intensity in NREM. Total TST for both chronotypes of this rodent species was shorter than that seen in other rodents. This was a result of the species studied spending less time in NREM compared to other rodents (table 3), as the amount of time spent in REM sleep was within the range, though at the upper end, reported previously for other rodents.
State Definitions
In the present study, wake and sleep states were telemetrically recorded and subsequently scored for both the 5-second epoch and the 1-min epoch. The state of wake was polygraphically identified by low-amplitude, high-frequency cortical EEG activity and irregular high-amplitude nuchal EMG activity. The state of NREM was polygraphically identified by high-amplitude, low-frequency cortical EEG activity and stable low-amplitude nuchal EMG activity. REM sleep was polygraphically identified by low-amplitude, high-frequency cortical EEG waves (similar to that seen in waking) and when the nuchal EMG was lower in amplitude (without reaching complete atonia) compared to waking and NREM and displayed large, high-amplitude infrequent spikes (that correlated with behavioural twitches and jerks). These criteria used for the polygraphic identification of wake and sleep states in the mole rats of the current study are congruent with those previously utilized in the physiological identification of wake and sleep states in a different species of mole rat [Tobler and Deboer, 2001] and in other rodents and terrestrial mammals [see review by Campbell and Tobler, 1984; Tobler, 1995; McNamara et al., 2010].
5-Second Epoch Scoring versus 1-min Epoch Scoring
The scoring techniques employed in the current study yielded some similarities and differences in the results. It was observed that between the rhythmic and arrhythmic mole rats for both methods of scoring (5-second and 1-min epochs) the time spent in waking, NREM and REM sleep remained similar. This is of importance as it reveals that the determination of the time spent in the various wake and sleep states is not altered by the scoring method. The 5-second epoch scored data produced more statistically significant differences for the average number of episodes of wake and sleep states and the average duration of an episode of wake and sleep states, within and between chronotypes and within and between days and light and dark periods when compared to the 1-min epoch scored data. The average duration of an episode of waking and NREM generated by the 5-second epoch scoring data seems unusually short, but if the average number of episodes is factored into this equation, then the results indicate that both the rhythmic and arrhythmic individuals may exhibit a form of sleep fragmentation, as determined by the occurrence in brief arousals during NREM [Franken et al., 1991]. The differences between the methods of scoring are a direct result of a decrease in sampling size from the 5-second epoch scoring to the 1-min epoch scoring, but the 1-min epoch scoring data generate a more credible biological scenario for waking and NREM without significantly changing the times spent in these physiological states. Interestingly, despite the differences between the two methods for waking and NREM, the average number of episodes and the average duration of an episode of REM sleep remained similar for both scoring methods. In light of the above, both the 5-second and 1-min scoring data appear to be acceptable methods to draw conclusions in terms of the total time spent in wake and sleep states, while the 1-min scoring data provide a more biologically relevant method, as it correlated more closely with the behaviour, to determine the average number of episodes of wake and sleep states and the average duration of an episode of wake and sleep states. In the text that follows the values generated from the 1-min scoring data are used for comparisons and discussion.
Rhythmic versus Arrhythmic Mole Rats
The results of the present study indicated that the arrhythmic mole rats spent more time in a state of wake (19.4 vs. 17.1 h, with a peak during the dark period), and had a longer average duration for a waking episode (609 vs. 453 s) than the rhythmic group. In contrast, the rhythmic mole rats spent more time in NREM (5.1 vs. 3.4 h, especially during the light period), had a higher average number of NREM episodes (122 vs. 103) and had a longer average duration of an NREM episode (147 vs. 119 s) than the arrhythmic mole rats. Both groups spent a similar amount of time in REM sleep (1.2 h for rhythmic vs. 1 h for arrhythmic), had a similar average number of REM sleep episodes (23 for rhythmic vs. 18 for arrhythmic) and had a similar average duration of an REM episode (189 s for rhythmic vs. 194 s for arrhythmic). The homeostatic nature of sleep dictates that sleep propensity is related to the history of prior waking, i.e. the longer the vigilance state of wake is maintained, the greater the drive for sleep becomes [Tucci and Nolan, 2010]. Given that the arrhythmic group spends more time awake than the rhythmic group, it is tempting to suggest that sleep propensity in the arrhythmic group should be higher. Interestingly, in potential mitigation of this apparent paradox, it was observed that SWA during NREM was consistently higher (although not statistically significantly different, probably due to the small sample size of each chronotype) in the arrhythmic group compared with the rhythmic group, indicating that the arrhythmic individuals may display a greater intensity of NREM compared to the rhythmic individuals. As SWA in NREM can be used as an indicator of NREM intensity, it is possible that the decrease in total NREM time observed in the arrhythmic mole rats could be compensated for by increasing SWA. The SWA activity during NREM of the arrhythmic mole rats of the current study is congruent with previous studies of sleep deprivation in different mammals that have consistently shown an increase in SWA during NREM following sleep deprivation [Tobler, 1995]. Despite this, these observations should be treated with caution as the results were obtained in a controlled laboratory environment from isolated individuals of a species that is known to be social, and it has been previously demonstrated that total sleep and wake times are different between laboratory and field studies [Rattenborg et al., 2008].
Comparison to Other Rodents
In the present study it was found that the TST in the rhythmic individuals was 6.5 h while for the arrhythmic group it was 4.3 h. These values are lower than those noted (under similar recording conditions) for other rodents (table 3). The amount of time spent in REM sleep in both groups of mole rats falls within the range that has been observed in other rodents (0.7–1.9 h; table 3); however, the proportion of REM sleep relative to the TST in the rhythmic group is 19% while that of the arrhythmic group is 23%, which while within the range seen for other rodents are on the higher end of the range (table 3). The average duration of an episode of NREM in the rhythmic and arrhythmic mole rats (147 and 119 s, respectively) is shorter than that seen in other rodents (table 3), but the average duration of an REM episode in the rhythmic and arrhythmic mole rats (189 and 195 s, respectively) is longer than that reported in other rodents (table 3).
The consistency in the average duration of an episode of REM sleep between rhythmic and arrhythmic groups suggests a crucial baseline function for REM sleep in the mole rats. It has been previously noted that subterranean mole rats have a lower body temperature than surface-dwelling mammals [Bennett and Faulkes, 2000], though it is unknown whether body temperature differences exist between different circadian chronotypes. It has been shown that REM sleep reaches maximal activity when body temperature is at its lowest [Dijk and Franken, 2005]; therefore, it could be possible that REM sleep is specifically regulated in these mole rats irrespective of their chronotype in relation to their body temperature, and this may explain the slightly higher duration of REM in the mole rats of the current study compared to other rodents (table 3). A possible explanation for the discrepancy observed between the mole rats of the current study and other rodents could lie in the genetic variation of these rodents, as some of the classic sleep disorders have been associated with single gene mutations [Kimura and Winkelmann, 2007], and several studies have identified genomic regions that contain allelic variations affecting quantifiable sleep parameters commonly referred to as quantitative trait loci (QLT) [Tafti et al., 1997; Tafti, 2007]. It is known in humans and mice that genetics are responsible for the phenomenological architecture of sleep [Lindowski et al., 1991; Franken et al., 1998, 1999; Tafti et al., 1997]. It would appear that a series of loci on chromosomes 5, 7, 12 and 17 are associated with the vigilance phenotype in mice [Tafti et al., 1997]. This was further assessed by characterizing differences in EEG parameters in inbred mouse strains where a number of differences between sleep states but also significant genotype-specific variations were reported, thereby indicating that EEG parameters are under genetic control [Franken et al., 1998]. It would be of interest to examine the mole rats for specific QLTs on the chromosomes mentioned to determine if specific differences to other rodents that may explain the differences in sleep could be found.
Despite similar methodologies for sleep recording, the results presented in the current study are different from those reported for the blind mole rat [Tobler and Deboer, 2001]. TST per 24 h ranged from 18 to 29%, while percent REM of TST ranged from 16 to 23% between the chronotypes of the mole rat of the current study; in the blind mole rat, on the other hand, 52 and 15% were reported for these measures. These discrepancies could possibly be dictated by differences in body temperature and QLTs between these species of mole rats rather than adaptations to a regressed visual system and subterranean lifestyle. Also, the blind mole rat is a member of the Spalacidae family typically found in shrubbish vegetation of the Middle East. It has been suggested that ecological factors can have significant effects on patterns of sleep and wake [Acerbi et al., 2008]; therefore, the differences in sleep and wake patterns observed between the giant Zambian mole rat and the blind mole rat could result from differences in their natural habitat.
Circadian Rhythmicity and Sleep
One of the aims of the current study was to determine whether baseline physiological sleep parameters would differ in individuals of the same species with distinct circadian chronotypes. The results of the present study indicate that while there were some differences between the rhythmic and arrhythmic groups, for the most part the measured sleep parameters were not significantly different. It is known that circadian rhythmicity and sleep homeostasis both contribute to the sleep-wake cycle and the structure of sleep in animals, yet it is apparent that sleep homeostasis is driven by sleep-wake behaviour, whilst the circadian clock is influenced by light and might be affected by the feedback of the sleep-wake cycle [Dijk and Franken, 2005]. Several studies have shown that the phase relationship between the sleep-wake cycle and circadian rhythms may change and that the duration and structure of sleep may depend on the circadian phase at which sleep occurs [e.g. Czeisler et al., 1980; Zulley et al., 1981]. The results of the present study support the notion of elevated SWA as it was observed that SWA in NREM of the arrhythmic group was consistently higher when compared to the rhythmic group and this was seen in both light and dark periods; however, the results disagree with the notion of an increase in sleep duration as it was observed that the average duration of an episode of NREM in the arrhythmic group was significantly lower when compared to the rhythmic group. Interestingly, investigation of circadian chronotypes in the O. degus showed that differential responses to melatonin do not induce distinct circadian chronotypes [Vivanco et al., 2007], yet scheduled feeding can induce differing patterns of rhythmicity [Vivanco et al., 2010], but assessment of locomotor activity yielded the most significant distinction of circadian chronotypes [Vivanco et al., 2009]. It has been shown that TST in the O. degus amounts to 37.6 ± 3.7% per 24 h [Kas and Edgar, 1998], though it is unclear whether the patterns of sleep and wake are different between circadian chronotypes of the O. degus.
Circadian rhythms can be altered through genetic mutation of clock genes. Studies have shown that ablation of the clock genes per1 and per2, which results in the absence of circadian rhythms in mice, does not affect sleep homeostasis and is not associated with a major change in the sleep deprivation-induced increase in SWA [Kopp et al., 2002; Shiromani et al., 2004]. Wisor et al. [2002] showed that mice lacking the cryptochrome genes, cry1 and cry2, also had an absence of circadian rhythmicity. This study concluded that the cryptochrome genes affect sleep homeostasis, where NREM sleep time is increased and SWA is higher compared to wild types and sleep deprivation produces no change in NREM sleep time, yet attenuates SWA compared to wild types. These genetic mutation studies indicate that the separation of circadian rhythmicity and sleep homeostasis does not extend to all components of circadian rhythm generation [Dijk and Franken, 2005]. In the present study, the results are congruent with the theory postulating independence of circadian rhythmicity and sleep homeostasis, since no statistical significance could be identified between the rhythmic and arrhythmic groups in the amount of waking, the amount of NREM sleep, the percentage of TST, the amount of REM sleep and the percentage of REM sleep relative to the TST; however, changes in the clock genes within the arrhythmic group may explain the statistically longer duration of waking and shorter duration of NREM sleep compared to the rhythmic group.
Acknowledgements
The current study was supported by funding from the National Research Foundation of South Africa to P.R.M. and N.C.B. We gratefully acknowledge the assistance of the members of the Central Animal Services of the University of the Witwatersrand throughout this study.
References
- Acerbi A, McNamara P, Nunn CL. To sleep or not to sleep: the ecology of sleep in artificial organisms. BMC Ecol. 2008;14:10. doi: 10.1186/1472-6785-8-10. [DOI] [PMC free article] [PubMed] [Google Scholar]
- Alfoldi P, Tobler I, Borbely AA. Sleep regulation in rats during early development. Am J Physiol Regul Integr Comp Physiol. 1990;258:R634–R644. doi: 10.1152/ajpregu.1990.258.3.R634. [DOI] [PubMed] [Google Scholar]
- Ambrosini MV, Gambelunghe C, Mariucci G, Bruschelli G, Adami M, Guiditta A. Sleep-wake variables and EEG power spectra in Mongolian gerbils and Wistar rats. Physiol Behav. 1994;56:963–968. doi: 10.1016/0031-9384(94)90330-1. [DOI] [PubMed] [Google Scholar]
- Ayala-Guerrero F, Vargas-Reyna L, Ramos JI, Mexicano G. Sleep patterns of the volcano mouse (Neotomodon alstoni alstoni) Physiol Behav. 1998;64:557–580. doi: 10.1016/s0031-9384(98)00081-x. [DOI] [PubMed] [Google Scholar]
- Bennett NC, Faulkes CG. Cambridge, Cambridge University Press. ed 1 2000. African Mole-Rats: Ecology and Eusociality. [Google Scholar]
- Bhagwandin A, Fuxe K, Bennett NC, Manger PR. Distribution of orexinergic neurons and terminal networks in the brains of two species of African mole rats. J Chem Neuroanat. 2011;41:32–42. doi: 10.1016/j.jchemneu.2010.11.002. [DOI] [PubMed] [Google Scholar]
- Borbély AA, Neuhaus U. Sleep-deprivation: effects on sleep and EEG in the rat. J Comp Physiol. 1979;133:71–87. [Google Scholar]
- Burda H, Kawalika M. Evolution of eusociality in the Bathyergidae: the case of the giant mole-rat (Cryptomys mechowi) Naturwissenschaften. 1993;80:235–237. doi: 10.1007/BF01175742. [DOI] [PubMed] [Google Scholar]
- Campbell SS, Tobler I. Animal sleep: a review of sleep duration across phylogeny. Neurosci Biobehav Rev. 1984;8:296–300. doi: 10.1016/0149-7634(84)90054-x. [DOI] [PubMed] [Google Scholar]
- Capellini I, Barton RA, McNamara P, Nunn CL. A phylogenetic analysis of the ecology and evolution of mammalian sleep. Evolution. 2008;62:1764–1776. doi: 10.1111/j.1558-5646.2008.00392.x. [DOI] [PMC free article] [PubMed] [Google Scholar]
- Chepkasov IE. Daily rhythm of sleep and wakefulness in the Arctic ground squirrel (Citellus parryi) during the summer season. Zh Evol Biokhim Fiziol. 1980;17:77–80. [Google Scholar]
- Cooper HM, Herbin M, Nevo P. Visual system of a naturally microphthalamic mammal: the blind mole rat (Spalax ehrenbergi) J Comp Neurol. 1993;328:313–350. doi: 10.1002/cne.903280302. [DOI] [PubMed] [Google Scholar]
- Czeisler CA, Weitzman ED, Moore-Ede ED, Zimmerman JC, Knauer RS. Human sleep: its duration and organisation dependent on its circadian phase. Science. 1980;210:1264–1267. doi: 10.1126/science.7434029. [DOI] [PubMed] [Google Scholar]
- Deboer T, Franken P, Tobler I. Sleep and cortical temperature in the Djungarian hamster under baseline conditions and after sleep deprivation. J Comp Physiol. 1994;174:145–155. doi: 10.1007/BF00193782. [DOI] [PubMed] [Google Scholar]
- De Graaf G, Family Bathyergidae . The Mammals of Africa: An Identification Manual. In: Meester J, Setzer HW, editors. Washington, Smithsonian Institution Press. 1971. [Google Scholar]
- Dijk DJ, Daan S. Sleep EEG spectral analysis in a diurnal rodent: Eutamias sibiricus. J Comp Physiol. 1989;165:205–215. doi: 10.1007/BF00619195. [DOI] [PubMed] [Google Scholar]
- Dijk DJ, Franken P. Interaction of sleep homeostasis and circadian rhythmicity: dependent or independent systems? In: Kryger MH, Roth R, Dement WC, Principles and Practices of Sleep Medicine, editors. New York, Saunders. ed 4 2005. [Google Scholar]
- Estep D, Canney EL, Cochran CC, Hunter JL. Components of activity and sleep in two species of chipmunks: Tamias striatus and Eutomias dorsalis. Bull Psychonomic Soc. 1978;12:341–343. [Google Scholar]
- Folk MA. The daily distribution of sleep and wakefulness in the arctic ground squirrel. J Mammal. 1963;44:575–577. [Google Scholar]
- Franken P, Dijk DJ, Tobler I, Borbely AA. Sleep deprivation in the rat: effects of the electroencephalographic power spectra, vigilance states and cortical temperature. Am J Physiol. 1991;261:R198–R208. doi: 10.1152/ajpregu.1991.261.1.R198. [DOI] [PubMed] [Google Scholar]
- Franken P, Malafosse A, Tafti M. Genetic variation in the EEG during sleep in inbred mice. Am J Physiol. 1998;275:R1127–R1137. doi: 10.1152/ajpregu.1998.275.4.R1127. [DOI] [PubMed] [Google Scholar]
- Franken P, Malafosse A, Tafti M. Genetic determinants of sleep regulation in inbred mice. Sleep. 1999;22:155–169. [PubMed] [Google Scholar]
- Franken P, Tobler I, Borbély AA. Cortical temperature and EEG slow-wave activity in the rat: analysis of vigilance state related changes. Pflügers Arch. 1992;420:500–507. doi: 10.1007/BF00374625. [DOI] [PubMed] [Google Scholar]
- Gutjahr GH, van Rensburg LJ, Malpaux B, Richter TA, Bennett NC. The endogenous rhythm of plasma melatonin and its regulation by light in the highveld mole-rat (Cryptomys hottentotus pretoriae): a microphthalmic, seasonally breeding rodent. J Pineal Res. 2004;37:185–192. doi: 10.1111/j.1600-079X.2004.00151.x. [DOI] [PubMed] [Google Scholar]
- Hammer O, Harper DAT, Ryan PD. PAST: paleontological statistics software package for education and data analysis. Palaeontol Electron. 2001;4:9. [Google Scholar]
- Hart L, Bennett NC, Malpaux B, Chimimba CT, Oosthuizen MK. The chronobiology of the Natal mole rat, Cryptomys hottentotus natalensis. Physiol Behav. 2004;82:563–569. doi: 10.1016/j.physbeh.2004.05.008. [DOI] [PubMed] [Google Scholar]
- Huber R, Deboer T, Tobler I. Effects of sleep deprivation on sleep EEG in three mouse strains: empirical data and simulations. Brain Res. 2000;857:8–19. doi: 10.1016/s0006-8993(99)02248-9. [DOI] [PubMed] [Google Scholar]
- Kas MJ, Edgar DM. Crepuscular rhythms of EEG sleep-wake in a hystricomorph rodent, Octodon degus. J Biol Rhythms. 1998;13:9–17. doi: 10.1177/074873098128999871. [DOI] [PubMed] [Google Scholar]
- Kastaniotis C, Kaplan P. Sleep and wakefulness in the Mongolian gerbil Meriones unguiculalus. J Sleep Res. 1976;5:96. [Google Scholar]
- Kimura M, Winkelmann J. Genetics of sleep and sleep disorders. Cell Mol Life Sci. 2007;64:1216–1226. doi: 10.1007/s00018-007-6532-1. [DOI] [PMC free article] [PubMed] [Google Scholar]
- Kopp C, Albrecht U, Zheng B, Tobler I. Homeostatic sleep regulation is preserved in mPer1 and mPer2 mutant mice. Eur J Neurosci. 2002;16:1099–1106. doi: 10.1046/j.1460-9568.2002.02156.x. [DOI] [PubMed] [Google Scholar]
- Lindowski P, Kerkhofs M, Hauspie R, Mendlewicz J. Genetic determinants of EEG sleep: a study in twins living apart. Electroencephalogr Clin Neurophysiol. 1991;79:114–118. doi: 10.1016/0013-4694(91)90048-9. [DOI] [PubMed] [Google Scholar]
- Lovegrove BG, Muir A. Circadian body temperature rhythms of the solitary Cape mole rat, Georychus capensis (Bathyergidae) Physiol Behav. 1996;60:991–998. doi: 10.1016/0031-9384(96)00076-5. [DOI] [PubMed] [Google Scholar]
- Lovegrove BG, Papenfus ME. Circadian activity rhythms in the solitary Cape mole rat (Georychus capensis: Bathyergidae) with some evidence of splitting. Physiol Behav. 1995;58:679–685. doi: 10.1016/0031-9384(95)00106-s. [DOI] [PubMed] [Google Scholar]
- Lyamin OI, Manger PR, Ridgway SH, Mukhametov LM, Siegel JM. Cetacean sleep: an unusual form of mammalian sleep. Neurosci Biobehav Rev. 2008;32:1451–1484. doi: 10.1016/j.neubiorev.2008.05.023. [DOI] [PMC free article] [PubMed] [Google Scholar]
- McMullen CA, Andrade FH, Crish SD. Underdeveloped extraocular muscles in the naked mole-rat (Heterochephalus glaber) Anat Rec. 2010;293:918–923. doi: 10.1002/ar.21107. [DOI] [PMC free article] [PubMed] [Google Scholar]
- McNamara P, Barton RA, Nunn CL. New York, Cambridge University Press. ed 1 2010. Evolution of Sleep: Phylogenetic and Functional Perspectives. [Google Scholar]
- McNamara P, Capellini I, Harris S, Nunn CL, Barton RA, Preston B. The phylogeny of sleep database: a new resource for sleep scientists. Open Sleep J. 2008;1:11–14. doi: 10.2174/1874620900801010011. [DOI] [PMC free article] [PubMed] [Google Scholar]
- Mistlberger RE, Bergmann BM, Waldenar W, Rechtschaffen A. Recovery sleep following sleep deprivation in intact and suprachiasmatic nuclei-lesioned rats. Sleep. 1983;6:217–233. doi: 10.1093/sleep/6.3.217. [DOI] [PubMed] [Google Scholar]
- Negroni J, Bennett NC, Cooper HM. Organization of the circadian system in the subterranean mole rat, Cryptomys hottentotus (Bathyergidae) Brain Res. 2003;967:48–62. doi: 10.1016/s0006-8993(02)04208-7. [DOI] [PubMed] [Google Scholar]
- Nemec P, Burda H, Peichl L. Subcortical visual systems of the African mole-rat Cryptomys anselli: to see or not to see? Eur J Neurosci. 2004;20:757–768. doi: 10.1111/j.1460-9568.2004.03510.x. [DOI] [PubMed] [Google Scholar]
- Oosthuizen MK, Cooper HM, Bennett NC. Circadian rhythms of locomotor activity in solitary and social species of African mole rats (family: Bathyergidae) J Biol Rhythms. 2003;18:481–490. doi: 10.1177/0748730403259109. [DOI] [PubMed] [Google Scholar]
- Rattenborg NC, Voirin B, Vyssotski AL, Kays RW, Spoelstra K, Kuemmeth F, Heidrich W, Wikelski M. Sleeping outside the box: electroencephalographic measures of sleep in sloths inhabiting a rainforest. Biol Lett. 2008;23:402–405. doi: 10.1098/rsbl.2008.0203. [DOI] [PMC free article] [PubMed] [Google Scholar]
- Richardson GS, Moore-Ede MC, Czeisler CA, Dement WC. Circadian rhythms of sleep and wakefulness in mice: analysis using long-term automated recording of sleep. Am J Physiol Regul Integr Comp Physiol. 1985;248:R320–R330. doi: 10.1152/ajpregu.1985.248.3.R320. [DOI] [PubMed] [Google Scholar]
- Shiromani PJ, Xu M, Winston EM, Shiromani SN, Gerashchenko D, Weaver DR. Sleep rhythmicity and homeostasis in mice with targeted disruption of mPeriod genes. Am J Physiol Regul Integr Comp Physiol. 2004;287:R47–R57. doi: 10.1152/ajpregu.00138.2004. [DOI] [PubMed] [Google Scholar]
- Sichilima AM, Faulkes CG, Bennett NC. Field evidence for aseasonality of reproduction and colony size in the Afrotropical giant mole-rat Fukomys mechowii (Rodentia: Bathyergidae) Afr Zool. 2008;43:144–149. [Google Scholar]
- Siegel JM. Sleep phylogeny: clues to the evolution and function of sleep. In: Luppi PH, Sleep: Circuits and Functions, editor. Boca Raton, CRC Press. 2004. [Google Scholar]
- Siegel JM. Do all animals sleep? Trends Neurosci. 2008;31:208–213. doi: 10.1016/j.tins.2008.02.001. [DOI] [PMC free article] [PubMed] [Google Scholar]
- Siegel JM. Sleep viewed as a state of adaptive inactivity. Nat Rev Neurosci. 2009;10:747–753. doi: 10.1038/nrn2697. [DOI] [PMC free article] [PubMed] [Google Scholar]
- Susic V, Masirevic G. Sleep patterns in the Mongolian gerbil (Meriones unguiculatus) Physiol Behav. 1986;37:257–261. doi: 10.1016/0031-9384(86)90229-5. [DOI] [PubMed] [Google Scholar]
- Tafti M, Franken P, Kitahama K, Malafosse A, Jouvet M, Valtax J-L. Localisation of candidate genomic regions influencing paradoxical sleep in mice. Neuroreport. 1997;8:3755–3758. doi: 10.1097/00001756-199712010-00019. [DOI] [PubMed] [Google Scholar]
- Tafti M. Quantitative genetics of sleep in inbred mice. Dialogues Clin Neurosci. 2007;9:273–278. doi: 10.31887/DCNS.2007.9.3/mtafti. [DOI] [PMC free article] [PubMed] [Google Scholar]
- Tang X, Sanford LD. Telemetric recording of sleep and home cage activity in mice. Sleep. 2002;25:691–699. [PubMed] [Google Scholar]
- Tobler I. Is sleep fundamentally different between mammalian species? Behav Brain Res. 1995;69:35–41. doi: 10.1016/0166-4328(95)00025-o. [DOI] [PubMed] [Google Scholar]
- Tobler I, Deboer T. Sleep in the blind mole rat Spalax ehrenbergi. Sleep. 2001;24:147–154. [PubMed] [Google Scholar]
- Tobler I, Franken P. Sleep homeostasis in the guinea pig: similar response to sleep deprivation in the light and dark period. Neurosci Lett. 1994;164:105–108. doi: 10.1016/0304-3940(93)90868-l. [DOI] [PubMed] [Google Scholar]
- Tobler I, Franken P, Jaggi K. Vigilance states, EEG and cortical temperature in the guinea pig. Am J Physiol. 1993;264:R1125–R1132. doi: 10.1152/ajpregu.1993.264.6.R1125. [DOI] [PubMed] [Google Scholar]
- Tobler I, Jaggi K. Sleep and EEG in the Syrian hamster (Mesocrictus auratus) under baseline conditions and following sleep deprivation. J Comp Physiol. 1987;161:449–459. doi: 10.1007/BF00603970. [DOI] [PubMed] [Google Scholar]
- Tucci V, Nolan PM. Toward and understanding of the function of sleep: new insights from mouse genetics. In: McNamara P, Barton RA, Nunn CL, Evolution of Sleep: Phylogenetic and Functional Perspectives, editors. New York, Cambridge University Press. ed 1 2010. [Google Scholar]
- Valatx JL, Bugat R. Facteurs génétiques dans le déteminisme du cycle veille-sommeil chez la souris. Brain Res. 1974;69:315–330. doi: 10.1016/0006-8993(74)90009-2. [DOI] [PubMed] [Google Scholar]
- Van Twyver H. Sleep patterns in five rodent species. Physiol Behav. 1969;4:901–905. [Google Scholar]
- Vivanco P, Ortiz V, Rol MA, Madrid JA. Looking for the keys to diurnality downstream from the circadian clock: role of melatonin in a dual-phasing rodent, Octodon degus. J Pineal Res. 2007;42:280–290. doi: 10.1111/j.1600-079X.2007.00418.x. [DOI] [PubMed] [Google Scholar]
- Vivanco P, López-Espinoza A, Madariaga AM, Rol MA, Madrid JA. Nocturnalism induced by scheduled feeding in diurnal Octodon degus. Chronobiol Int. 2010;27:233–250. doi: 10.3109/07420520903398575. [DOI] [PubMed] [Google Scholar]
- Vivanco P, Rol MA, Madrid JA. Two steady-entrainment phases and graded masking effects by light generate different circadian chronotypes in Octodon degus. Chronobiol Int. 2009;26:219–241. doi: 10.1080/07420520902768203. [DOI] [PubMed] [Google Scholar]
- Wisor JP, O'Hara BF, Terao A, Selby CP, Kilduff TS, Sancar A, Edgar DM, Franken P. A role for cryptochromes in sleep regulation. BMC Neurosci. 2002;3:20. doi: 10.1186/1471-2202-3-20. [DOI] [PMC free article] [PubMed] [Google Scholar]
- Zulley J, Wever R, Aschoff J. The dependence of onset and duration of sleep on the circadian rhythm of rectal temperature. Pflügers Arch. 1981;391:314–318. doi: 10.1007/BF00581514. [DOI] [PubMed] [Google Scholar]


