Summary
The neurotensin receptor 1 (NTSR1) is a G-protein-coupled receptor (GPCR) that engages multiple G-protein subtypes and is involved in regulation of blood pressure, body temperature, weight, and response to pain. Here we present 3-Å structures of the human NTSR1 in complex with the agonist JMV449 and the heterotrimeric Gi1 protein in two conformations (C state and NC state). While the C-state complex is similar to recently reported GPCR-Gi/o complexes, with the nucleotide-binding pocket adopting more flexible conformations that may facilitate nucleotide exchange, the G protein in the NC state is rotated by ~45 degrees relative to the receptor and exhibits a more rigid nucleotide-binding pocket. NTSR1 in the NC state exhibits features of both active and inactive conformations, suggesting that the structure may represent an intermediate along the G-protein-activation pathway. This structural information, complemented by molecular dynamics simulations and functional studies, provides insights into the complex process of G-protein activation.
Neurotensin (NTS) is a 13-amino-acid peptide (ELYENKPRRPYIL)1working as a neurotransmitter/neuromodulator in the brain and as a hormone in the peripheral organs, mainly in the gastrointestinal tract2. NTS regulates a wide range of physiological processes and is associated with the pathogenesis of diverse conditions, including hypotension, hypothermia, obesity, analgesia, drug addiction, cancer cell growth, Parkinson’s disease and schizophrenia3-6. Three different neurotensin receptors (NTSRs) have been cloned so far7-10, with most of the biological effects of NTS mediated through neurotensin receptor 1 (NTSR1)11. NTSR1 is a promiscuous G-protein coupled receptor (GPCR); it preferentially couples to Gq but also to all other Gα subtypes, including Gs, Gi/o, and G12/1312. Several rat NTSR1 (rNTSR1) structures with agonist peptide NTS8–13 (RRPYIL) have been determined, enhancing our understanding of agonist binding13-16. Here, we employed cryo-electron microscopy (cryo-EM) to obtain the structure of human NTSR1 (hNTSR1) in complex with the agonist peptide JMV449 (K-psi(CH2NH)-KPYIL) and the heterotrimeric protein Gi1. Unexpectedly, the cryo-EM analysis revealed two distinct conformations of the NTSR1-Gi1 complex, termed C state (canonical state) and NC state (non-canonical state). Our studies suggest that the NC state may represent an intermediate along the activation pathway and provide dynamic molecular insights into the process of G-protein activation.
Structural determination
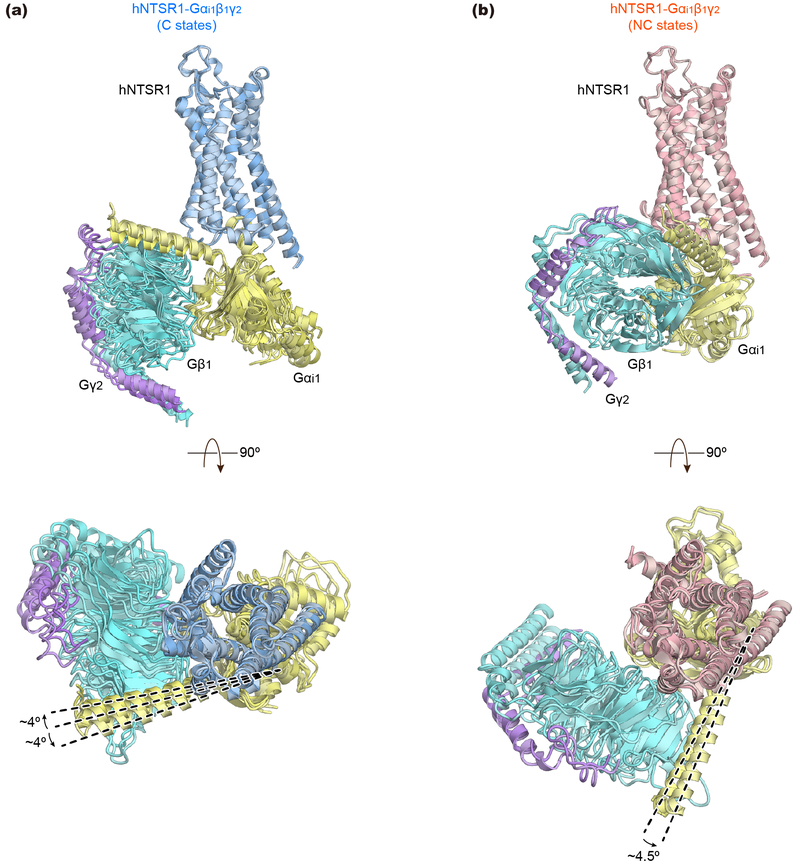
To improve the expression of hNTSR1, we first truncated 19 N-terminal amino acids and introduced the A851.54L mutation (superscripts denote Ballesteros–Weinstein numbering17) (Extended Data Fig. 1). The receptor was expressed in Sf9 insect cells, solubilized in lauryl maltose-neopentyl glycol (LMNG) with cholesteryl hemisuccinate (CHS), and purified in the presence of JMV44918, a pseudopeptide analogue of NTS8–13. JMV449-bound hNTSR1 was incubated with Gi1 heterotrimer, and the complex was treated with apyrase and further stabilized by a single-chain variable fragment (scFv16) that binds to the Gi1 heterotrimer19 (Extended Data Fig. 2a). Preliminary cryo-EM analysis of the purified complex revealed two major conformations with strikingly different orientations of the G-protein (Extended Data Fig. 2b). To further optimize our preparation for structural studies, we deleted ~10 amino acids from intracellular loop 3 (ICL3), which we found to increase the thermostability of the complex while displaying comparable or stronger G-protein signaling compared to the receptor with intact ICL3 (Extended Data Fig. 3a-e). Cryo-EM visualization of this construct also revealed the presence of the two major complex conformations, for which we sought to determine high-resolution cryo-EM maps (Extended Data Fig. 2c-i). To account for the conformational variability and the large fraction of damaged particles due to adverse effects upon cryo-specimen preparation20, we obtained and processed a cryo-EM dataset of more than six million particle projections. 3-D classification of projections from well-defined complexes reveals that the two conformers, which we call C state (canonical state) and NC state (non-canonical state), are present at a similar distribution within the complex population. This observation may suggest that the two major conformers present two thermodynamically comparable or equably stable states. Further classification enabled us to identify small-scale variations in the C and NC states, for which we refined independent three-dimensional reconstructions. Accordingly, we obtained cryo-EM maps for three conformers in the C state with nominal resolutions of 3.0 Å, 3.5 Å, and 6.7 Å, and two conformers in the NC state with nominal resolutions of 3.0 Å and 3.7 Å. The four higher resolution maps enabled model building and refinement, whereas the 6.7-Å C-state conformer was adequate for rigid body docking of the receptor and Gi independently to obtain a model for their relative arrangement. Close examination and superposition of the conformers within each state revealed limited in-plane rotations of the G-protein in respect to the receptor (4–5°) but no distinguishable differences in the structure of either receptor or G-protein or their interaction profile (Extended Data Fig. 4). These observations suggest that the micro-conformers observed within each major conformation represent small variations of the same state (either NC or C state) and reflect the underlying dynamics of complex formation.
The α-helical domain (AHD) of Gi is separated from the Ras-like domain, and due to its relative mobility we masked out its density for high-resolution map refinement (Methods). We note, however, that the overall positioning of the AHD appears more stable in the C state, where we observe stronger density in low-pass-filtered maps compared to the NC state (Extended Data Fig. 2b and g).
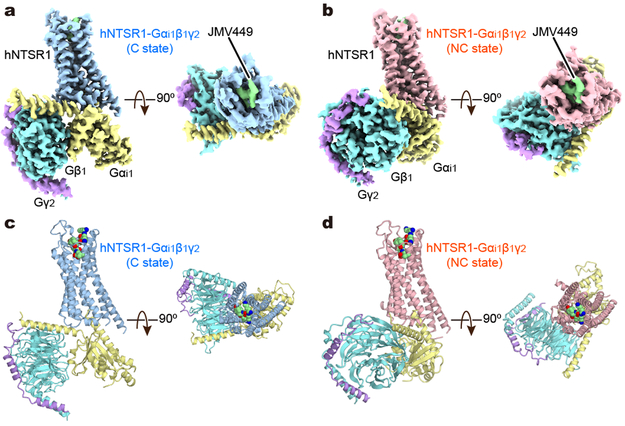
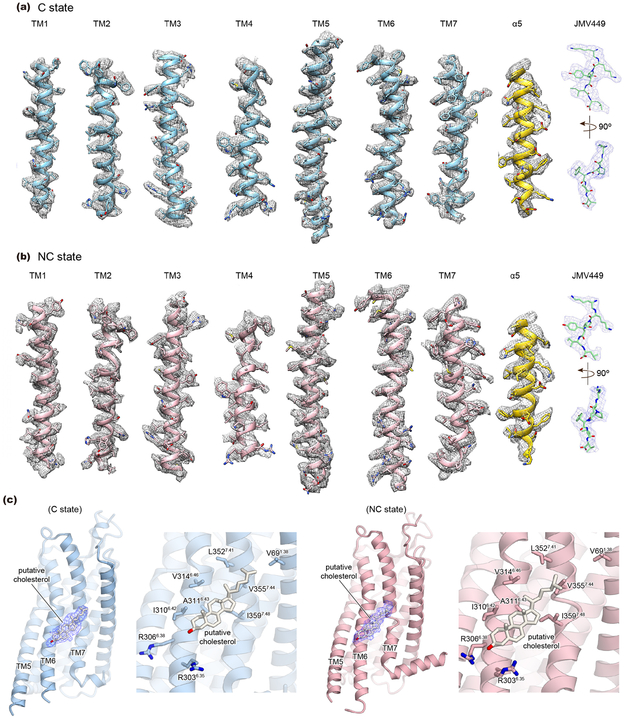
The highest resolution maps of the NC and C state, with indicated global resolutions of 3.0 Å, both showed local resolution ranges from 2.7–3.4 Å (Fig. 1, Extended Data Fig. 2f-i, and Extended Data Table 1) and overall excellent density features that allowed confident modeling of most amino acids, including most intracellular and extracellular loops (ICLs and ECLs, respectively) of hNTSR1 (Extended Data Fig. 5). The maps also revealed well defined electron density for JMV449 and putative density for cholesterol (Extended Data Fig. 5 and supplementary discussion).
Figure 1∣. Cryo-EM structures of hNTSR1-Gi1 complex.
a, b, Orthogonal views of the cryo-EM density maps of the hNTSR1–Gi1 heterotrimer complex in C state (a) and NC state (b), colored by subunit. Blue, hNTSR1 in C state; red, hNTSR1 in NC state; green, JMV449; yellow, Gαi1 Ras-like domain; cyan, Gβ1; purple, Gγ2. c, d, Ribbon representation of the hNTSR1–Gi1 complexes in C state (c) and NC state (d) in the same views and color scheme as shown in (a) and (b).
Extended Data Table 1∣.
Cryo-EM data collection, refinement and validation statistics
| hNTSR1-Gαi1β1γ2-scFv16 (C state) (EMDB-20180) (PDB 6OS9) |
hNTSR1-Gαi1β1γ2 (NC state) (EMDB-20181) (PDB 6OSA) |
|
|---|---|---|
| Data collection and processing | ||
| Magnification | 47170 | 47170 |
| Voltage (kV) | 300 | 300 |
| Electron exposure (e−/Å2) | 75 | 75 |
| Defocus range (μn) | −1.0 ~ −2.5 | −1.0 ~ −2.5 |
| Pixel size (Å) | 1.06 | 1.06 |
| Symmetry imposed | C1 | C1 |
| Initial particle images (no.) | 6,548,648 | |
| Final particle images (no.) | 163,333 | 207,119 |
| Map resolution (Å) | 3.0 Å | 3.0 Å |
| FSC threshold | 0.143 | 0.143 |
| Map resolution range (Å) | 2.7 – 3.4 Å | 2.7 – 3.4 Å |
| Map sharpening B factor (Å2) | −98 | −90 |
| Refinement | ||
| Initial model used (PDB code) | 4XEE | 4XEE |
| 1GP2 | 1GP2 | |
| Model resolution (Å) | 3.4 Å | 3.4 Å |
| FSC threshold | 0.5 | 0.5 |
| Model resolution range (Å) | 2.8 – 4.3 | 2.8 - 4.3 |
| Model composition | ||
| Non-hydrogen atoms | 8,969 | 7,338 |
| Protein residues | 1,146 residues (8,916 atoms) | 931 residues (7,285 atoms) |
| Ligands | 6 residues (53 atoms) | 6 residues (53 atoms) |
| B factors (Å2) | ||
| Protein | 68.6 | 80.8 |
| Ligand | 85.7 | 86.2 |
| R.m.s. deviations | ||
| Bond lengths (Å) | 0.010 | 0.008 |
| Bond angles (°) | 1.049 | 1.001 |
| Validation | ||
| MolProbity score | 1.62 | 1.45 |
| Clashscore | 5.27 | 4.42 |
| Poor rotamers (%) | 0.21 | 0 |
| Ramachandran plot | ||
| Favored (%) | 95.14 | 96.53 |
| Allowed (%) | 4.86 | 3.47 |
| Disallowed (%) | 0 | 0 |
Structures of hNTSR1 in C and NC states
To date, eight NTS8–13-bound rNTSR1 crystal structures with 3–29 stabilizing mutations have been reported13-16, illustrating several features of active and inactive receptor conformations. Since rNTSR1-ELF15 and rNTSR1-TM86V-ΔIC3A14 have the fewest stabilizing mutations (3 and 11, respectively), we have used these two structures as representatives of active (rNTSR1-act) and inactive (rNTSR1-inact) conformations, respectively, to compare with our structures.
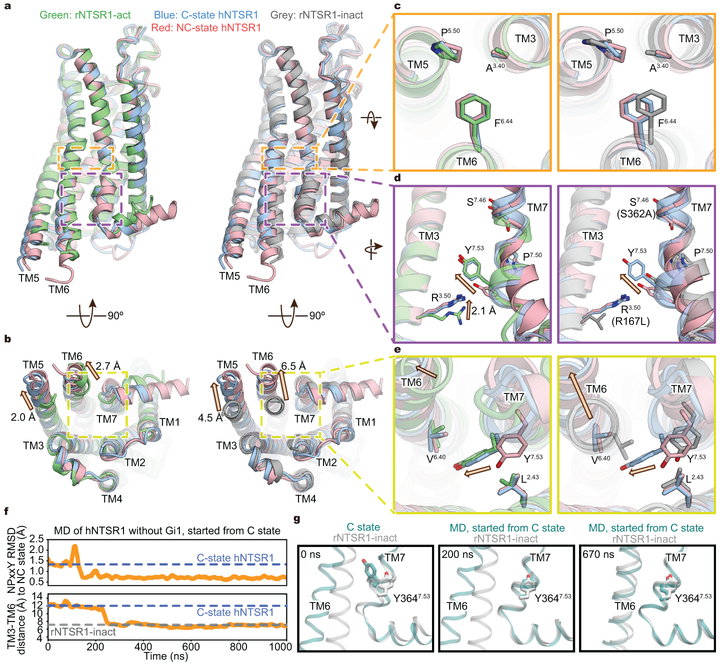
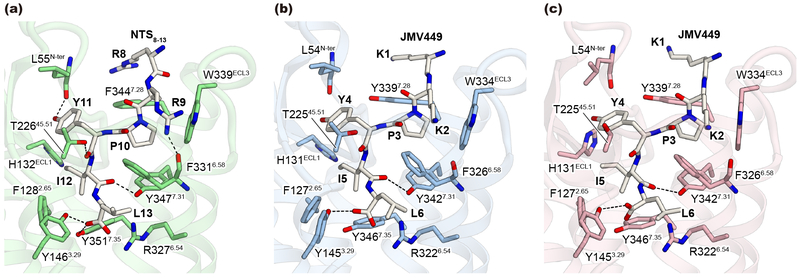
The overall structures of hNTSR1 in both C and NC states are similar to the active-like conformation of rNTSR1-act, with a root mean square deviation (RMSD) of 0.95 and 1.11 Å, respectively (Fig. 2a and b). TMs 1–4 superpose well onto those of rNTSR1-act, and rotamers of the conserved triad motif21,22 (PIF/PAF motif; P2485.50, A1563.40, F3126.44 in hNTSR1) are essentially identical (Fig. 2c). Although the N-terminal two residues of NTS8–13 and JMV449 are different, the overall ligand-binding mode is similar, with four shared C-terminal residues (PYIL) being recognized by extensive van der Waals interactions and a few hydrogen bonds (Extended Data Fig. 6).
Figure 2∣. Structural comparison of hNTSR1 in C and NC states.
a-e, Superimposed structures of C-state hNTSR1 (blue), NC-state hNTSR1 (red), rNTSR1-act15 (green), and rNTSR1-TM86V-∆ICL3A14 (grey). Side (a) and intracellular view (b) of the overall structure, and magnified view of the PIF/PAF (c), DRY (d), and NPxxY motifs (e). C- and NC-state hNTSR1 are superposed onto rNTSR1-act (a-e, left) and rNTSR1-inact (a-e, right). The arrows mark differences between superposed structures. f, g, Traces (f) and representative snapshots (g) during simulations of hNTSR1 alone, started from C state. The RMSD of the NPxxY motif relative to the NC-state structure (top) and the distance between TM3 and TM6 (bottom) are plotted in (f).
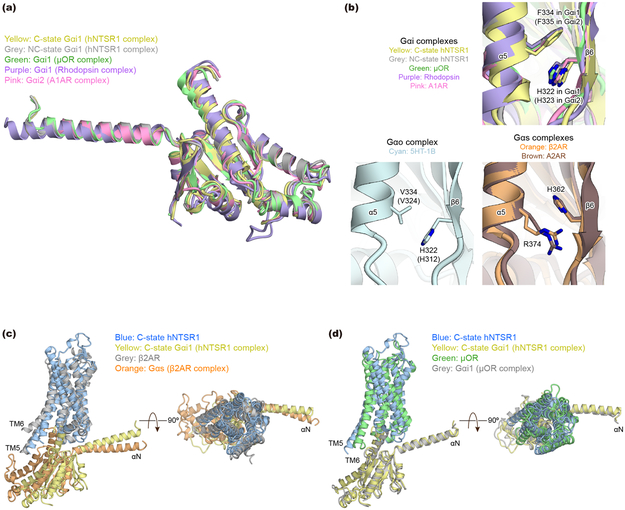
There are notable differences between C-state hNTSR1, NC-state hNTSR1, and rNTSR1-act. While the cytoplasmic ends of TMs 5 and 6 of all three structures are displaced away from the receptor core relative to the inactive-like conformation of rNTSR1-inact, the movements in hNTSR1 in both NC and C states are more pronounced, likely stabilized by the engagement of the Gi1 protein (Fig. 2b, left). The extensive displacement of TM6, a universal feature of GPCR activation in order to accommodate the binding of the Gα α5-helix, is still significantly smaller in hNTSR1 NC and C states than in the β2AR (β2 adrenergic receptor)-Gs complex (~6.5 Å and ~14 Å, respectively)23. This smaller TM6 displacement has been suggested to be a feature of GPCR-Gi/o complexes compared to the larger TM6 displacement required to accommodate the bulkier α5 helix of Gαs (Extended Data Fig. 7a)24.
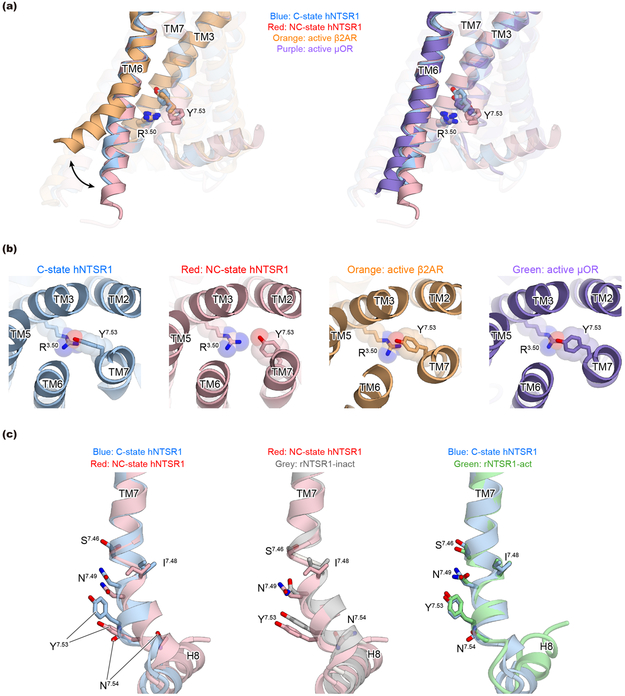
Structural comparisons reveal that C-state hNTSR1 adopts the canonical conformation of an activated GPCR, but NC-state hNTSR1 displays features of both active and inactive GPCR conformations; TM5, TM6 and DRY motifs assume active configurations, whereas TM7, including the NPxxY motif, is still in an inactive conformation (Fig. 2d and e, Extended Data Fig. 7b and c). The side chain of NC-state Y3647.53 (rY369) (rNTSR1 numbering is shown in parentheses after hNTSR1 numbering for comparison with earlier literature) is positioned between TM2 and 7, and it packs against L1052.43 (rL106) (Fig. 2e left). In contrast, C-state Y3647.53 resides into the core of the transmembrane bundle where it engages in hydrophobic interactions with amino acids in TM2 and TM6 (Fig. 2e right, Extended Data Fig. 7c left).
As the NC-state receptor exhibits both active-like and inactive-like features and resembles a previously reported intermediate for the β2AR25, its conformation could represent an intermediate along the activation pathway. To probe whether the receptor can transition from the canonically active C state toward an inactive-like state via the NC state, we performed all-atom molecular dynamics (MD) simulations of hNTSR1 starting from the C state with the Gi1 protein removed (Fig. 2f and g). We found that in three out of twenty-four independent simulations, the receptor does reach an inactive conformation on the intracellular surface (Fig. 2g, right). In these simulations, the receptor indeed deactivates via the NC state (Fig. 2g, middle), i.e., the NPxxY region first adopts an inactive conformation before TM6 moves inward by ~4 Å on the intracellular side. In three additional simulations, the receptor also adopts the NC-state conformation but does not fully transition to the inactive state. In the remaining simulations, the receptor remains in an active-like conformation, consistent with previous studies in which GPCR deactivation timescales often exceed the timescales of these simulations25,26. Notably, these sequential conformational changes closely resemble those previously observed for β2AR25,26, reinforcing the notion that multiple Class-A GPCRs may adopt similar conformations along their activation pathways.
Structures of Gi1 in C and NC states
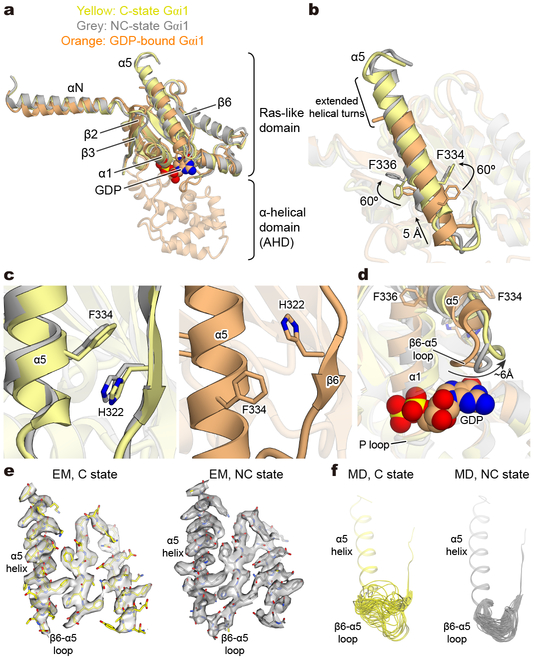
The overall structures of the Gi1 heterotrimer in both C and NC states are similar to Gi in previously reported GPCR–Gi complexes19,27,28 (Fig. 3a and Extended Data Fig. 8a). No density for GDP is observed in the GDP binding pocket mainly formed by the β1–α1 loop (P-loop) and the β6–α5 loop, suggesting that Gi1 in both the C and NC states is nucleotide-free.
Figure 3∣. Structural comparison of Gαi1 in C and NC states.
a, b, Overall structures (a) and α5-helices (b) of GDP-bound Gαi129 (orange) and nucleotide-free Gαi1 from C-state (yellow) and NC-state (grey) hNTSR1-Gi1 complexes. c, d, Comparison of the interface between the α5-helix and the β6-strand (c) and the β6-α5 loop (d) between C-state Gαi1, NC-state Gαi1, and GDP-bound Gαi1. GDP is shown as spheres and the black arrow in (d) indicates the displacement of the β6-α5 loop. e, f, The dynamics of α5-β6 loop in C-state Gαi1 (left) and NC-state Gαi1 (right). Cryo-EM density (e) and superposed snapshots during MD simulation (f). Frames sampled every 20 ns from representative simulations.
Compared to the GDP-bound Gi1 heterotimer29, the α5-helix of Gi1 is rotated by ~60°, translated by ~5Å, and extended by two additional helical turns into the receptor core (Fig. 3b). The position of the α5-helix in both the C and NC states is stabilized by the π-π stacking interaction between F334 on the α5-helix and H322 on the β6-strand, which is observed in other GPCR-Gi complexes (Fig. 3b, c, and Extended Data Fig. 8b). Notably, alanine mutations at H322 and F334 dramatically destabilize the rhodopsin-Gi1 complex without affecting the stability of GDP-bound Gi130, suggesting that this π-π stacking is one of the conserved, key interactions to stabilize GPCR-Gi complexes.
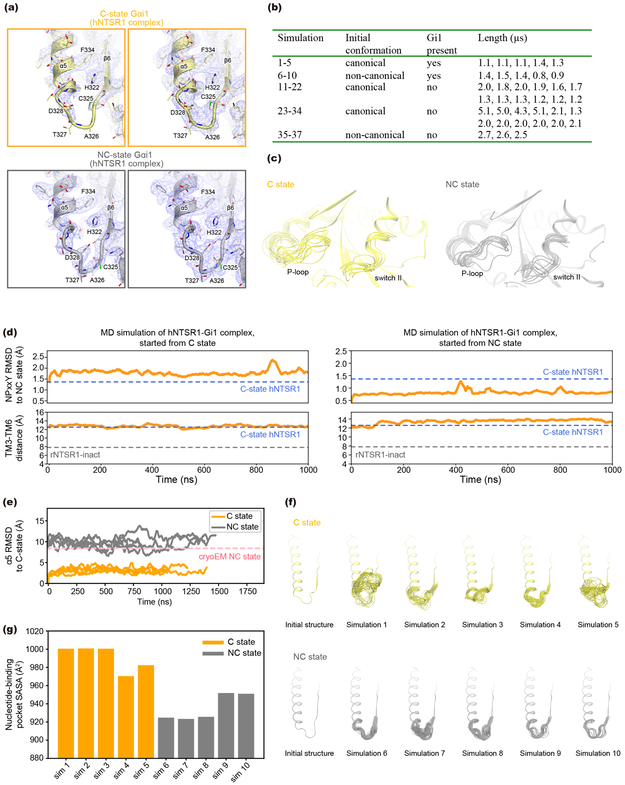
The movement of the α5 helix leads to further structural changes in the β6–α5 loop containing the conserved TCAT motif (T324, C325, A326, T327 in Gαi1), which is crucial for coordinating the guanine ring of GDP31-33. Although neither state shows density for GDP, the β6–α5 loop appears to behave very differently between the C and NC states (Fig. 3d-f). In the C state, the EM density for the β6–α5 region is weak and disappears at map thresholds that properly represent the structure in adjacent regions, suggesting that the loop is flexible in this state (Fig. 3e and Extended Data Fig. 9a top). In contrast, the β6–α5 loop in NC-state Gi1 is ordered, with well-defined and stable density compared to the C state (Fig. 3e and Extended Data Fig. 9a bottom). To further probe the dynamics of this region, we performed MD simulations of the hNTSR1-Gi1 complexes starting from the NC and C states (Extended Data Fig. 9b). Indeed, we find that the β6–α5 loop is more conformationally variable in the C state than in the NC state (Fig. 3f and Extended Data Fig. 9c, d, and e). The difference in both position and conformational flexibility of the β6–α5 loop between the C- and NC-state Gi1 suggests that the nucleotide accessibility could be different between these two states of the hNTSR1-Gi1 complex. To probe this, we calculated the solvent-accessible surface area (SASA) for the nucleotide-binding pocket based on our simulations of the NC and C states. We found a significantly larger SASA for the C state, suggesting that the increased motion of the β6–α5 loop in the C state could enhance nucleotide exchange. We postulate that the higher concentrations of GTP in the cytosol would then drive the reaction toward GTP binding and subsequent G protein dissociation. (Extended Data Fig. 9f and g).
Different hNTSR1-Gi1 interfaces
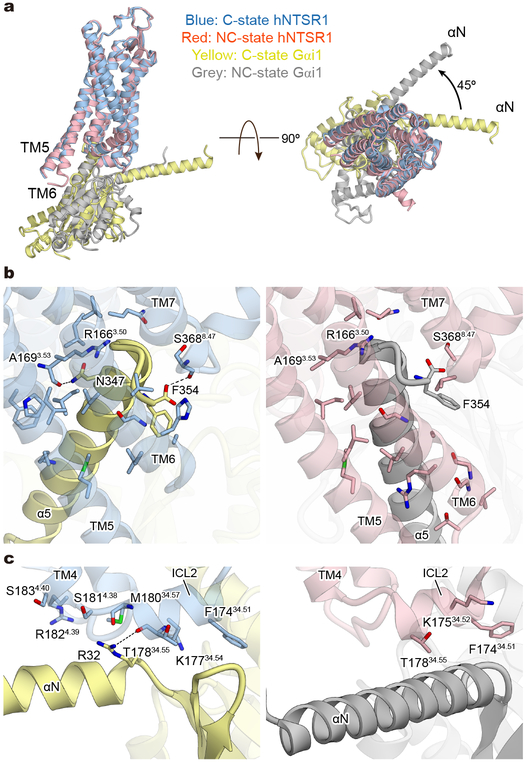
As mentioned above, there are several differences between the C and NC states within the receptor or the G-protein alone, but the most striking difference is observed in the complex interface (Fig. 4a). The overall structure of the C-state complex is well superposed onto other activated GPCR-Gi complexes, such as the μOR-Gi1 complex, and the complex interface is well conserved (Extended Data Fig. 8c and d). In both C-state hNTSR1-Gi1 and the μOR-Gi1 structures, the G-protein and receptor interactions are mainly mediated by extensive hydrophobic interactions between (i) α5-helix of Gi1 and ICL2, TM3, and TMs5–7 of the receptor (Fig. 4b left), and (ii) αN helix and αN-β1 loop of Gi1 and ICL2 of receptor (Fig. 4c left). A number of interactions are conserved, including a key hydrogen bond between R32 of Gi1 and an amino acid positioned at 34.55 (T17834.55 of hNTSR1 and D17734.55 of μOR). In contrast, Gi1 in the NC state is rotated by ~45° relative to the receptor (Fig. 4a). Due to this rotation, the α5-helix is tilted by ~25° compared to the α5-helix of C-state Gi1, and most hydrophobic interactions between α5-helix and TM3 and ICL2 are missing (Fig. 4b). Three hydrogen bonds observed in the C-state complex (R32 of Gi1 to T17834.55 of hNTSR1, N347 of Gi1 to A1693.53 of hNTSR1, and F354 of Gi1 to S3688.47 of hNTSR1) are also not present in the NC state, and the αN- and α5-helices of NC-state Gi1 interact with the receptor solely via van der Waals forces (Fig. 4b and c). However, the tilt of the α5-helix generates new interactions with ICL3 and TM6 (Fig. 4b right). Moreover, the rotation of the Gi1 heterotrimer results in the creation of a new interaction surface: the α4-β6 loop of Gαi1 and helix 8 of hNTSR1 (Fig. 5a left), the α3-β5 and α2-β4 loops of Gαi1 and ICL1 of hNTSR1 (Fig. 5a middle), and the WD7 repeat of the Gβ1 subunit and ICL1 and ICL2 of hNTSR1 (Fig. 5a right). These results would be consistent with a number of previous studies suggesting that the α4-β6 and α3-β5 loops directly interact with the GPCR35,36, and that a different Gβ subtype in the Gi1 heterotrimer affects the coupling efficiency between Gi1 and rNTSR137. Due to these new interactions, the total buried surface area in the NC-state complex is larger than that of the C-state complex (1430 Å2 and 1199 Å2, respectively). As noted earlier, however, the similar distribution of the NC- and C-state complexes in the cryo-EM data implies that the two states have comparable stability and likely similar probability for transitioning from one to the other under our experimental conditions. To evaluate the physiological importance of the NC-state complex, we introduced alanine mutations to S9312.49, L9412.50, R2946.26, and H3738.52, which interact with Gi1 only in the NC state (Fig. 4b, c, and 5a) and analyzed the downstream signaling using a Nano-BiT™ complementation-based G-protein sensor to monitor dissociation of a Gα subunit from a Gβγ subunit (NanoBiT G-protein dissociation assay; Methods)38. The assay reveals that the hNTSR1 mutant (S93A/L94A/R294A/H373A) shows decreased Gi/o signaling despite robust expression and signaling through other G-proteins, suggesting that NC-state complex formation is physiologically important for efficient Gi/o signaling (Fig. 5b; Extended Data Fig. 3c, f, and g).
Figure 4∣. Comparison of receptor-G-protein interfaces in C and NC states.
a, Side (left) and intracellular view (right) of the superposed structures of C-state hNTSR1 (blue), NC-state hNTSR1 (red), C-state Gαi1 (yellow), and NC-state Gαi1 (grey). b, Interaction between α5-helix of Gαi1 and hNTSR1. The α5-helix has more contacts with TM3 and ICL2 of hNTSR1 in C state (left), and TM6 of hNTSR1 in NC state (right). Black dashed lines represent hydrogen bonds. c, Interaction between the αN helix and αN-β1 loop of Gαi1 and ICL2 of hNTSR1 in C-state (left) and NC-state (right) complexes. Black dashed lines represent hydrogen bonds.
Figure 5∣. Interactions specifically observed in NC-state hNTSR1-Gi1 complex.
a, Interactions specifically observed in NC-state complex. Van der Waals contacts between α4-β6 loop of Gαi1 and helix 8 (H8) of hNTSR1 (left), α3-β5 and α2-β4 loop of Gαi1 and ICL1 of hNTSR1 (middle), and WD7 repeat of Gβ1 and ICL1 and TM4 of hNTSR1 (right). b, c, Concentration-response curves of Gs, Gi1, Go, Gq, and G13 signaling in NanoBiT G-protein dissociation assay of hNTSR1 WT and S93A/L94A/R294A/H373A mutant for full length constructs. Symbols and error bars represent mean and SEM from four independent experiments each performed in duplicates.
Working model
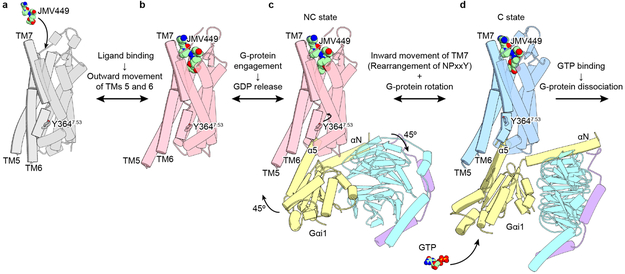
Based on these results and previous studies of rNTSR1, we propose a sequential Gi1 activation model by NTSR1 (Fig. 6). When an agonist peptide binds to the ligand-binding pocket, TMs 5 and 6 move outward by ~4.5 Å and ~6.5 Å, respectively (Fig. 2b; Fig. 6a and b). The displacement of TMs 5 and 6 creates space within the helical bundle sufficient to accommodate Gi1 (Fig. 6b). Next, the Gi1 heterotrimer engages the receptor through predominantly hydrophobic interactions between the α5-helix and TM6 (NC state, Fig. 4b and Fig. 6c). Gi1 in the NC-state complex represents a nucleotide-free state, suggesting that these interactions could be sufficient to trigger the translational and rotational movement of α5-helix (Fig. 3b) and rearrangement of the β6-α5 loop (Fig. 3d), leading to GDP release. Subsequently, there is an inward movement of Y7.53 in the NPxxY motif on the intracellular end of TM7, and the Gi1 heterotrimer rotates by ~45° relative to the receptor (C state, Fig. 4a and Fig. 6d). The C-state hNTSR1-Gi1 complex is similar to the structures of other published GPCR-G-protein complexes, suggesting that the C state is a fully active conformation (Fig. 4a; Extended Data Fig. 8c and d). In this state, the nucleotide-binding pocket of the Gi1 Ras domain is more dynamic (Fig. 3 d-f), facilitating rapid access to the nucleotide-binding pocket (Extended Data Fig. 9f and g). Accordingly, we have depicted the NC state as an intermediate along the activation pathway for Gi1 (Fig. 6), with both MD simulations (Fig. 2f, g) and mutagenesis studies (Fig. 5b, c) compatible with this conclusion. Thus, we propose that the conformation of the G protein in the NC state allows for GDP release, but its conformation in the C state will further enhance nucleotide exchange for GTP. Such a stepwise mechanism implies that the receptor would adopt the C-state conformation before the G protein engages GTP and dissociates from the receptor.
Figure 6∣. Proposed model of hNTSR1 activation.
JMV449 and GTP are represented by sphere models, and Y3647.53 is depicted by a ball-and-stick model. a, Inactive state of hNTSR1 (the model is based on rNTSR1-inact)14. b, JMV449 binding induces the outward movements of TMs 5 and 6. c, GDP-bound Gi1 heterotrimer engages the receptor, triggering the displacement of the α5-helix and GDP release, forming the NC state. d, The Gi1 heterotrimer is rotated by 45°, whereas TM7, including the NPxxY motif, is rearranged forming C state. The C state has a more flexible nucleotide-binding pocket than the NC state, increasing the likelihood of GTP binding under cytosolic conditions.
Some ambiguity remains, even within this proposed framework. For example, it is possible that GDP could remain bound to the G protein in the NC state and undergo release in the C state, although our structural data suggest that the NC state is predominantly nucleotide-free in vivo. We also note that we considered the possibility that the NC state might represent an off-pathway intermediate that forms after the C state. However, our mutagenesis studies suggest that perturbing interactions unique to the NC state decreases Gi/o signaling, pointing toward a model in which the NC state precedes the C state along the activation pathway. We further considered a scenario in which the NC state forms after the C state to bind nucleotide, but the increased dynamics of the nucleotide-binding pocket suggest that GTP will much more rapidly bind the C state and argue against this possibility.
Conclusions
The present cryo-EM study of the hNTSR1-Gi1 complex revealed two different conformational states, a fully active (C state) and a putative intermediate state (NC state). Recent spectroscopic studies have suggested that other GPCR-G-protein complexes adopt multiple intermediate states39-41, and we thus assume that besides hNTSR1-Gi1, other GPCR-G-protein complexes undergo conformational transitions that may be similar to the NC state of the hNTSR1-Gi1 complex. The reason why the NC-state conformation was not observed in previous cryo-EM structures of class-A GPCR-G-protein complexes remains unclear, but it might be related to the G-protein-coupling promiscuity of the receptor. NTSR1 can couple to all subtypes of G-proteins (Extended Data Fig. 3)12, suggesting that the energy landscape of NTSR1 activation is different from other GPCRs. The NC-state hNTSR1-Gi1 complex is likely trapped in a relatively deep energy well, resulting in a large number of such complexes in our sample, and thereby enabling us to identify this conformation (Fig. 6e). While this study provides further structural insights into the mechanism of G protein activation, additional studies are needed to determine if similar intermediate states are involved in the formation of other GPCR-G protein complexes.
Methods
Expression and purification of hNTSR1
N-terminal truncated wild-type human hNTSR1 (UniProtKB: P30989; residues 20–418) was modified to include an N-terminal FLAG tag epitope and a C-terminal enhanced green fluorescent protein (EGFP) and 10× histidine tag; N-terminal and C-terminal tags are removable by tobacco etch virus (TEV) protease and human rhinovirus 3C protease cleavages, respectively. The A851.54L mutation was introduced to increase expression, and ten amino acids are truncated from ICL3 (residues 282–291) to increase thermostability of the complex. Spodoptera frugiperda Sf9 insect cells (Expression Systems) were grown in suspension in ESF921 media (Expression Systems) to a density of 2.5 × 10⁶ cells/ml, infected with hNTSR1 baculovirus (Expression Systems) and incubated for 48 h. To purify hNTSR1, the pellets were lysed with a hypotonic lysis buffer (20 mM HEPES pH 7.5 and protease inhibitors). The cell debris was then homogenized with a glass douncer in a solubilization buffer (1% lauryl maltose neopentyl glycol (LMNG, Anatrace), 0.1% cholesteryl hemisuccinate tris salt (CHS), 20 mM HEPES pH 7.5, 500 mM NaCl, 20% glycerol, 5 mM imidazole, 100 μM TCEP, 0.05 μM JMV449 (Tocris), and protease inhibitors) and solubilized for 2 h in 4 °C. The insoluble cell debris was removed by centrifugation (37,900 g, 25 mins), and the supernatant was mixed with the HisPur™ cobalt resin (Thermo Scientific) for 2 h in 4 °C. The resin was collected into a glass chromatography column, washed with 5–10 column volumes of a wash buffer (0.01% LMNG, 0.001% CHS, 20 mM HEPES pH 7.5, 500 mM NaCl, 20% glycerol, 20 mM imidazole, and 0.1 μM JMV449) and was eluted in a wash buffer supplemented with 250 mM imidazole. Following the cleavage of EGFP-His10 by His-tagged 3C protease (home-made), the sample was loaded onto the Ni-NTA (Qiagen) column to capture the cleaved EGFP-His10. The flow-through containing hNTSR1 was collected, concentrated and purified through gel-filtration chromatography in a final buffer (100 mM NaCl, 20 mM HEPES pH 7.5, 5% glycerol, 0.01% LMNG, 0.001% CHS, and 0.5 μM JMV449). Peak fractions were pooled and concentrated to ~20 mg/ml.
Expression and purification of heterotrimeric Gi1.
Gi1 heterotrimer was expressed and purified as previously described42. In brief, Trichuplusia ni Hi5 insect cells (Expression Systems) were co-infected with two viruses, one encoding the wild-type human Gαi1 subunit and another encoding the wild-type human β1γ2 subunits with an 8x His tag inserted at the amino terminus of the β1 subunit. Cultures were harvested 48 h post infection. Cells were lysed in hypotonic buffer and lipid-modified heterotrimeric Gi1 was extracted in a buffer containing 1% sodium cholate. The soluble fraction was purified using Ni-NTA chromatography, and the detergent was exchanged from sodium cholate to n-dodecyl-β-d-maltoside (DDM, Anatrace) on a column. After elution, the protein was dialyzed against a buffer containing 20 mM HEPES pH 7.5, 100 mM NaCl, 0.05% DDM, 1 mM MgCl2, 100 μM TCEP, 10 μM GDP, and concentrated to ~20 mg/ml.
Expression and purification of scFv16.
Single chain construct of Fab16 (scFv16) was expressed and purified as previously described19. In brief, a C-terminal 6× histidine tagged scFv16 was expressed in secreted form from Trichuplusia ni Hi5 insect cells using the baculovirus method (Expression Systems), and purified by Ni-NTA (Qiagen) chromatography. Supernatant from baculovirus-infected cells was pH balanced by addition of Tris pH 8.0. The C-terminal 6x His-tag of Ni-NTA eluent was cleaved by 3C protease, and the protein was dialyzed into a buffer consisting of 20 mM HEPES pH 7.5 and 100 mM NaCl. The sample was reloaded onto the Ni-NTA column to capture the cleaved His6. The flow-through containing scFv16 was collected, concentrated and purified through gel-filtration chromatography in a final buffer (100 mM NaCl and 20 mM HEPES pH 7.5). Monomeric fractions were pooled, concentrated to ~100 mg/ml.
Formation and purification of the hNTSR1-Gi1-scFv16 complex.
To exchange detergent from DDM to LMNG, an equal volume of 20 mM HEPES pH 7.5, 50 mM NaCl, 1% LMNG, 0.1% CHS, 1 mM MgCl2, 50 μM TCEP, 10 μM GDP was added to purified Gi1, and the protein was incubated at room temperature (RT) for 1 h. Purified hNTSR1 was mixed with a 1.2 molar excess of Gi1 heterotrimer, and the coupling reaction was allowed to proceed at RT for 3 h. Apyrase and λ-phosphatase (New England Biolabs) were added to catalyze hydrolysis of unbound GDP and to remove phosphorylation from proteins, respectively. After one more hour of incubation at 4 °C, the complexing mixture was loaded onto M1 anti-FLAG immunoaffinity resin (home-made). Bound complex was first washed in a buffer containing 1% LMNG, followed by washes in gradually decreasing LMNG concentrations and increasing glyco-diosgenin (GDN) concentrations. The complex was then eluted in 20 mM HEPES pH 7.5, 50 mM NaCl, 0.00375% LMNG, 0.000375% CHS, 0.00125% GDN, 5% glycerol, 5 μM JMV449, 2 mM EDTA and 200 μg/ml FLAG peptide. A 1.2 molar excess of scFv16 was added to the sample, and the complex was further incubated at 4 °C O/N. The hNTSR1-Gi1-scFv16 complex was purified by size exclusion chromatography on a Superdex 200 10/300 GL column (G.E. healthcare) in 20 mM HEPES pH 7.5, 50 mM NaCl, 0.00075% LMNG, 0.000075% CHS, 0.00025% GDN, 0.5 μM JMV449, and 100 μM TCEP (Extended Data Fig. 2a). Peak fractions were concentrated to ~15 mg/ml for electron microscopy studies.
Cryo-EM Data collection
3.5 μL of purified protein sample at ~5 mg/mL was applied onto a glow-discharged holey carbon grid (Quantifoil R1.2/1.3). The grids were blotted using a Vitrobot Mark IV (FEI) with 1 s blotting time at 20 °C at 100% humidity and plunge-frozen in liquid ethane. Cryo-EM imaging was performed on a Titan Krios electron microscope equipped with a K2 Summit direct electron camera. The microscope was operated at 300 kV accelerating voltage, at a calculated magnification of 47,170× in counting mode, corresponding to a pixel size of 1.06 Å. A total of 10,027 (hNTSR1-∆ICL3-Gi) movies were obtained at a dose rate of 7.5 electrons/ Å2 /s with defocus values ranging from −1.0 μm to −2.5 μm. The total exposure time was 10.0 s and intermediate frames were recorded in 0.2 s intervals resulting in an accumulated dose of 75 electrons per Å2 and a total of 50 frames per micrograph.
Imaging processing and 3D reconstruction
Dose-fractionated image stacks were subjected to beam-induced motion correction using MotionCor243. A sum of all frames, filtered according to the exposure dose, in each image stack was used for further processing. Contrast transfer function (CTF) parameters for each non-dose weighted micrograph were determined by Gctf44. For both datasets, particle selection, two-dimensional and three-dimensional classifications were performed on a binned dataset with a pixel size of 2.12 Å using RELION 2.1.045. A total of 6,548,648 particles were initially extracted from the hNTSR1-∆ICL3-Gi sample using semi-automated particle selection and were subjected to reference-free 2D classifications to discard false positive particles or particles categorized in poorly defined classes. The subsequent 3D classification identified two main different conformation of the complex (C state and NC state) accounting for 634,282 particles and 604,637 particles, respectively. Further 3D classifications focusing the alignment on the receptor and G-protein led to three sub-states for C state and two sub-states for NC state, designated C1 (163,333 particles), C2 (210,051 particles), C3 (118,544 particles), NC1 (207,119 particles), and NC2 (164,713 particles), respectively. Maps for these five conformations were refined independently with a pixel size of 1.06 Å, yielding 3D reconstructions with indicated global resolution of 3.0 Å, 3.5 Å, 6.7 Å, 3.0 Å, and 3.5 Å, respectively. The masks used for generating final maps include the density corresponding to the receptor, ScFv16 and the G protein heterotrimer excluding the mobile AHD. All masks were generated with the same extended-pixel and soft-edge level using the “Mask creation” function in RELION. Reported resolution is based on the “gold-standard” Fourier shell correlation (FSC) using the 0.143 criterion. Local resolution was determined using the Bsoft package46 with half maps as input.
Model building and refinement.
An initial model was formed by rigid body fitting of the active-like state hNTSR1 (PDB code 4XEE)15, as well as the Ras domain and βγ subunits of GDP-bound Gi1 (PDB 1GP2)29. This starting model was then subjected to iterative rounds of manual and automated refinement in Coot47 and Phenix48, respectively. The final model was visually inspected for general fit to the map, and geometry was further evaluated using Molprobity49 as part of the Phenix suite of software. FSC curves were calculated between the resulting model and the half map used for refinement, as well as between the resulting model and the other half map for cross validation, and also against the full map (Extended Data Fig. 2h and i). The final refinement statistics for both models are summarized in Extended Data Table 1. All molecular graphics figures were prepared with UCSF Chimera50, UCSF ChimeraX51, and Cuemol (Ishitani; http://www.cuemol.org).
Molecular dynamics simulations
We prepared atomistic molecular dynamics (MD) simulations of hNTSR1 in the canonical (C) and non-canonical (NC) conformations based on their respective cryo-EM structures. We performed 37 simulations, totaling over 70 μs in aggregate simulation time.
System setup for MD simulations
The structures were modeled according to the receptor construct used for the structure determination, which included an N-terminal truncation comprising 19 amino acid residues, a 10-residue truncation in ICL3 (residues E282-E291), as well as the A85L mutation in TM1. Missing amino acid side chains were modeled using Prime (Schrödinger)52,53, while missing loops were added using Modeller54. Palmitoyl groups were added on residue C383 of the receptor and on residue C3 of Gα, while G2 of Gα was N-myristoylated. The unresolved α-helical domain of Gα was not modeled here, as it has previously been found to have little effect on the dynamics of the complex42. Similarly, the unresolved C-terminal residues of Gγ were not modeled here. Neutral acetyl and methylamide groups were added to cap the N- and C-termini of the protein chains. No caps were added to the αN or to the α5 regions of the Ras domain. Titratable residues were kept in their dominant protonation state at pH 7, except for D1122.50 and E1653.49, which were protonated, as these residues have been suggested to be protonated for several active-state GPCRs55,56. As the inactivation pathway of GPCRs can depend on the protonation state of these residues25, we also performed additional simulations of the receptor with both D1122.50 and E1653.49 charged. Here, we obtained similar results with D1122.50 and E1653.49 protonated as compared to having both of these residues charged. Dowser was used to add water molecules to protein cavities, and the protein structures were aligned using the crystal structure for rat NTSR1 (PDB ID: 4GRV)13 in the Orientation of Proteins in Membranes (OPM) database57. The aligned structures were inserted into a pre-equilibrated palmitoyl-oleoyl-phosphatidylcholine (POPC) membrane bilayer using Dabble58. Sodium and chloride ions were added to neutralize each system at a concentration of 150 nM. We also prepared simulations of the receptor-ligand system with Gi1 removed, as well as simulations without either Gi1 or the ligand present. The final systems comprised up to 240,000 atoms for the Gi1-bound simulations and up to 67,000 atoms for the non-Gi-bound simulations. The simulations are summarized in Extended Data Fig. 9b.
With the exception of simulations 29–34, which were unliganded, all simulations included the ligand JMV449, which was used in the structure determination. In simulations 23–34, both D1122.50 and E1653.49 were charged. Given that transitions from inactive to active GPCR conformations occur on the timescale of milliseconds59 and are thus likely not accessible through MD simulations, we instead probed the deactivation pathway. Due to microscopic reversibility, activation and deactivation should occur along the same pathway60,61.
Simulation and analysis protocols
Equilibration was performed by heating the systems over 12.5 ps from 0 K to 100 K in the NVT ensemble using a Langevin thermostat with harmonic restraints of 10.0 kcal∙mol−1∙Å−2 on the non-hydrogen atoms of the lipids, protein, and the ligand. Initial velocities were sampled from a Boltzmann distribution. The system was then heated to 310 K over 125 ps in the NPT ensemble. Additional equilibration was performed at 310 K with 5.0 kcal∙mol−1∙Å−2 harmonic restraints on the protein and the ligand. The restraints were then reduced by 1.0 kcal∙mol−1∙Å−2 in a stepwise manner every 2 ns for 10 ns, and finally by 0.1 kcal∙mol−1∙Å−2 every 2 ns for an additional 18 ns.
Production simulations were performed at 310 K and 1 bar in the NPT ensemble using the Langevin thermostat and Monte Carlo barostat. The simulations were performed using a time step of 4.0 fs while employing hydrogen mass repartitioning62. Bond lengths were constrained using SHAKE63. Non-bonded interactions were cut off at 9.0 Å, and long-range electrostatic interactions were calculated using the particle-mesh Ewald (PME) method with an Ewald coefficient (β) of approximately 0.31 Å and B-spline interpolation of order 4. The PME grid size was chosen such that the width of a grid cell was approximately 1 Å.
For all simulations, we employed the CHARMM36m force field and the TIP3P water model64-68. The simulations were performed using the Compute Unified Device Architecture (CUDA) version of particle-mesh Ewald molecular dynamics (PMEMD) in AMBER1769,70. The AmberTools17 CPPTRAJ package was used to reimage trajectories, while Visual Molecular Dynamics (VMD)71 was used for visualization and analysis.
For Figure 2f, the TM3–TM6 distance refers to the distance between the Cα atoms of residues R1663.50 and V3026.34. The alignment for the RMSD calculation was performed on the backbone atoms of residues 3597.48–3657.54, and the RMSD was calculated for the non-symmetric side-chain atoms of residues 3607.49 to 3647.53, i.e., the NPxxY motif. We classified simulations as adopting an inactive conformation based on the TM3–TM6 distance, the RMSD of the NPxxY region to the NC-state structure, and visual comparison to the rNTSR1-inact structure. Based on these criteria, simulations 14, 26, and 34 showed deactivation. In simulation 26, the final positions of TM5 and TM6 were slightly laterally shifted relative to their corresponding positions in the rNTSR1-inact structure, but as the NPxxY region adopted and remained in the inactive conformation, and the intracellular portion of TM6 moved toward and remained in close contact with TM3 for the duration of the simulation, we classified this simulation as showing deactivation. For the SASA calculations, we defined the nucleotide-binding pocket as residues 41–48, 202, 203, 269, 270, 272, 273, 325–327 of Gα, which represent residues that are within 4 Å of GNP, a GTP analogue, in the 1CIP crystal structure72.
Fluorescence-detection size-exclusion chromatography-based thermostability assay (FSEC-TS assay)
The hNTSR1 constructs with N-terminal FLAG tag and C-terminal EGFP-His10 were expressed from Sf9 insect cells (Expression Systems) using the baculovirus method (Expression Systems). The cell pellets were solubilized in a solubilization buffer (1% LMNG (Anatrace), 0.1% CHS, 20 mM HEPES pH 7.5, 500 mM NaCl, 20% glycerol, 10 mM imidazole, 1 μM JMV449 (Tocris), and protease inhibitors) and incubated for 1 h in 4 °C. The insoluble cell debris was removed by centrifugation (21,130 g, 20 mins), and the supernatant was mixed with Ni-NTA resin (Qiagen) for 1 h in 4 °C. The resin was collected into a 1.5 ml tube, washed with 10 column volumes of a wash buffer (0.005% LMNG, 0.0005% CHS, 20 mM HEPES pH 7.5, 100 mM NaCl, 10% glycerol, 30 mM imidazole, and 1 μM JMV449) and was eluted in a wash buffer supplemented with 250 mM imidazole, 5 μM JMV449, 100 μM TCEP, 2 mM MgCl2, and 10 μM GDP. An excessive amount of purified Gi1 heterotrimer was added to the sample, and the complex was further incubated at 4 °C O/N. Apyrase was added, and after one more hour at 4 °C, the sample was incubated at 4, 45, or 50°C for 10 min, and centrifuged at 21,130 g for 20 min. Ten microliters of the supernatant were loaded onto a ENrich™ SEC 650 10 × 300 Column (Bio-rad) equipped to Prominence-i (Shimadzu), pre-equilibrated with FSEC buffer (100 mM NaCl, 20 mM HEPES pH 7.5, 5% glycerol, 0.01% LMNG, 0.001% CHS, and 0.5 μM JMV449), and run at a flow rate of 0.8 ml/min. The eluent from the SEC column was passed through a fluorometer and monitored at λex of 480 nm and λem of 512 nm.
GTP turnover assay (GTPase-Glo assay)
Analysis of GTP turnover was performed by using a modified protocol of the GTPase-Glo™ assay (Promega) described previously40. This assay detects the amount of GTP remaining after GTP hydrolysis, which is enhanced upon activation of the G protein by the ligand-bound receptor. After the GTPase reaction, addition of GTPase-Glo-reagent converts the remaining GTP to ATP that is converted to a luminescent signal by the detection reagent. hNTSR1 was incubated with JMV449 for 60 minutes at room temperature. The reaction was started by mixing the JMV449-bound hNTSR1 (0.5 μM) and G-protein (0.25 μM for Gi1 and 0.5 μM for Gq) in an assay buffer containing 20 mM HEPES, pH 7.5, 50 mM NaCl, 0.01% LMNG, 0.001% CHS, 100 μM TCEP, 5 mM μM GDP, and 5 μM GTP. After incubation for 40 minutes, reconstituted GTPase-Glo-reagent was added to the sample and incubated for 30 min at room temperature. Luminescence was measured after the addition of detection reagent and incubation for 30 min at room temperature using a SpectraMax Paradigm plate reader (Molecular Devices).
G-protein signaling assay (NanoBiT G-protein dissociation assay)
G-protein activation was measured by a NanoBiT-G protein dissociation assay38 in which GPCR-induced G protein dissociation is monitored by a NanoBiT system (Promega). A large fragment (LgBiT) of the NanoBiT luciferase was inserted into the helical domain (between the αA and the αB helices) of a Gα subunit with 15-amino acid-flexible linkers. A small fragment (SmBiT) was N-terminally fused to a C68S-mutated Gγ2 subunit with a 15-amino acid-flexible linker. Amino acid sequences of the NanoBiT-G-protein constructs used in this study are shown in Supplementary Information. HEK293 cells devoid of Gαq/11 subunits73 were seeded in a 6-well culture plate at a concentration of 2 × 10⁵ cells/ml (2 mL per well) 1-day before transfection. Transfecion solution was prepared by combining 4 μL (per well hereafter) of polyethylenimine solution (Polysciences; 1 mg/mL) and a plasmid mixture consisting of 100 ng LgBiT-inserted Gα subunit (Gαs, Gαi1 Gαi2, Gαo, Gαq or Gα13), 500 ng Gβ1, 500 ng C68S-mutant SmBiT-fused Gγ2 (C68S), and 200 ng test GPCR in 200 μL of Opti-MEM (ThermoFisher Scientific). Plasmid encoding a RIC8 chaperone (100 ng) was included for Gs (RIC8B) and Gq or G13 (RIC8A). After 1-day incubation, transfected cells were harvested with 0.5 mM EDTA-containing D-PBS, centrifuged and suspended in 2 mL of HBSS containing 0.01% bovine serum albumin (BSA; fatty acid–free grade; SERVA) and 5 mM HEPES (pH 7.4) (assay buffer). The cell suspension was dispensed in a white 96-well plate at a volume of 80 μL per well and loaded with 20 μL of 50 μM coelenterazine (Carbosynth) diluted in the assay buffer. After 2-h incubation at room temperature, the plate was measured for baseline luminescence (Spectramax L, Molecular Devices). Test compounds (20 μL) were added and incubated for 3–5 minutes at room temperature before second measurement. Luminescence counts were normalized to the initial count and fold-change signals over vehicle treatment were used to show G-protein dissociation response. Further details of the NanoBiT-G-protein dissociation assay is described elsewhere38.
Flow cytometry analysis
HEK293 cells were seeded in a 12-well culture plate at a concentration of 2 × 10⁵ cells/ml (1 mL per well) 1 day before transfection. Transfection solution was prepared by combining 2 μL of the polyethylenimine solution and 500 ng of a plasmid encoding FLAG epitope-tagged GPCR in 100 μL of Opti-MEM. One day after transfection, the cells were collected by adding 100 μL of 0.53 mM EDTA-containing Dulbecco’s PBS (D-PBS), followed by 100 μL of 5 mM HEPES (pH 7.4)-containing Hank’s Balanced Salt Solution (HBSS). The cell suspension was transferred in a 96-well V-bottom plate and fluorescently labeled by using anti-FLAG epitope tag monoclonal antibody (Clone 1E6, Wako Pure Chemicals; 10 μg/mL diluted in 2% goat serum- and 2 mM EDTA-containing D-PBS (blocking buffer)) and a goat anti-mouse IgG secondary antibody conjugated with Alexa Fluor 647 (ThermoFisher Scientific; 10 μg/mL in diluted in the blocking buffer). After washing with D-PBS, the cells were resuspended in 200 μl of 2 mM EDTA-containing-D-PBS and filtered through a 40-μm filter. Fluorescent intensity of single cells was quantified by an EC800 flow cytometer equipped with dual 488 nm and 642 nm lasers (Sony). Fluorescent signal derived from Alexa Fluor 647 was recorded in a FL3 channel and flow cytometry data were analyzed by a FlowJo software (FlowJo). Live cells were gated with a forward scatter (FS-Peak-Lin) cutoff of 390 setting a gain value of 1.7 and samples were shown as a histogram with the FL3 channel (s axis). Values of mean fluorescence intensity (MFI) from 20,000 cells per sample were used for statistical analysis.
Reporting summary.
Further information on experimental design is available in the Nature Research Reporting Summary linked to this paper.
Data availability
All data generated or analyzed during this study are included in this published article and its Supplementary Information. The cryo-EM density maps for the hNTSR1-Gi1 complex in C and NC states have been deposited in the Electron Microscopy Data Bank (EMDB) under accession codes EMD-20180 and EMD-20181, respectively. The coordinates for the models of hNTSR1-Gi1 in both states have been deposited in the Protein Data Bank (PDB) under accession numbers 6OS9 and 6OSA respectively. All other data are available upon request to the corresponding authors.
Extended Data
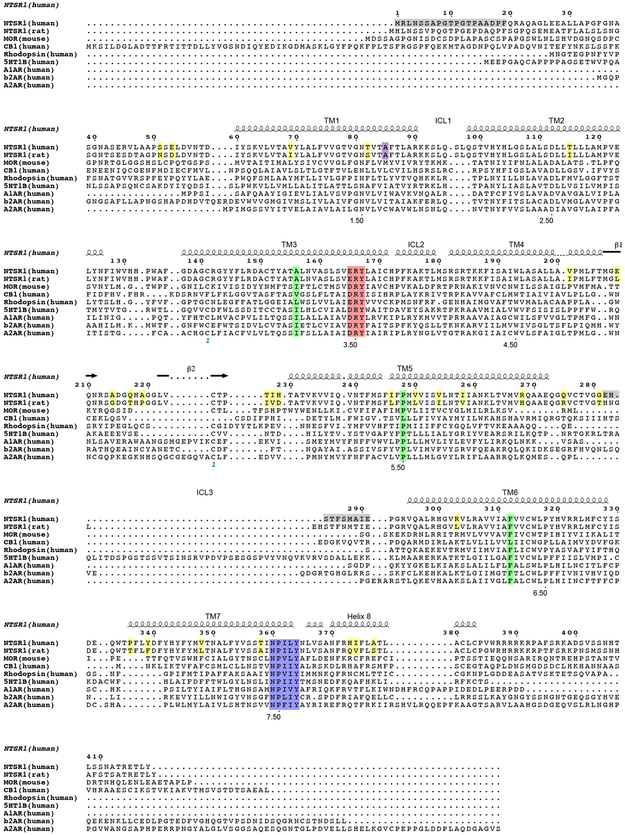
Extended Data Figure 1∣. Structure-based sequence alignment of class A GPCRs.
The sequences are for human neurotensin receptor 1 (NTSR1), rat NTSR1, mouse μ opioid receptor (μOR), human cannabinoid receptor 1 (CB1), human rhodopsin, human 5-hydroxytryptamine receptor 1B (5HT1B), human A1 adenosine receptor (A1AR), human β2 adrenergic receptor (β2AR), and human A2 adenosine receptor (A2AR). The sequence alignment was created using GPCRdb (http://www.gpcrdb.org) and ESPript 374 servers. Secondary structure elements for hNTSR1 are shown as coils and arrows. PIF/PAF/PLF/LVF, DRY/ERY, and NPxxY motifs are highlighted in green, red, and blue, respectively. The truncated sequences of hNTSR1(∆ICL3) are highlighted in grey.
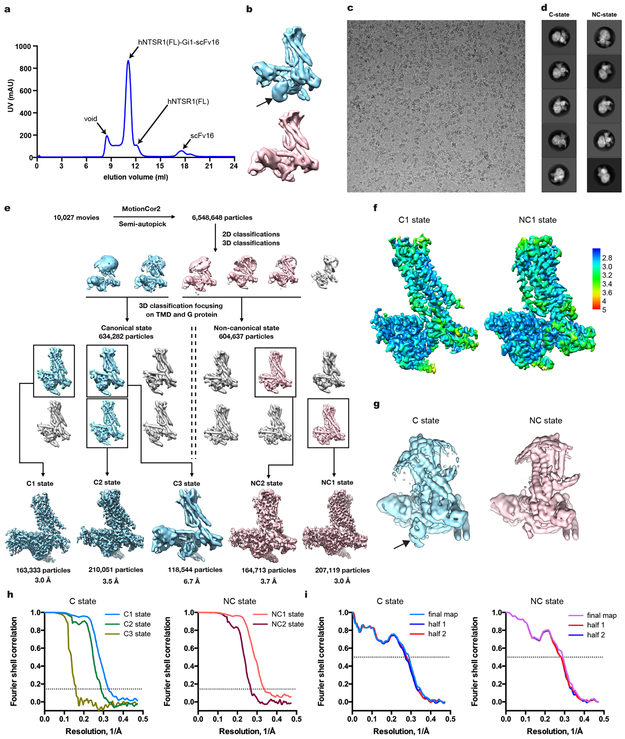
Extended Data Figure 2∣. Preparation and cryo-EM of the hNTSR1(FL)-Gi1-scFv16 and the hNTSR1(∆ICL3)-Gi1-scFv16 complexes.
a, Representative elution profile (out of more than three independent runs) of hNTSR1(FL; residues 20-418, A85L)-Gi1-scFv16 complex on Superdex 200 Increase 10/300 GL. b, Representative 3D classifications of the hNTSR1(FL)-Gi1-scFv16 complex. The C-state and NC-state complex maps are coloured in cyan and red, respectively. The black arrow indicates the partially disordered AHD. c, Representative cryo-EM micrograph of the hNTSR1(∆ICL3; residues 20-418, A85L, ∆282-291)-Gi1-scFv16 complex. d, Representative 2D averages showing different views of the hNTSR1(∆ICL3)-Gi1-scFv16 complex. e, Flow chart of cryo-EM data processing. f, Local resolutions of C1 state (left) and NC1 state (right). Full view of the RELION local-resolution-filtered map coloured by local resolution. g, Representative 3D classifications of the hNTSR1(∆ICL3)-Gi1-scFv16 complex. The black arrow indicates the partially disordered AHD. h, “Gold-standard” Fourier shell correlation (FSC) plots. i, FSC curves for the final model versus the final map and the half maps.
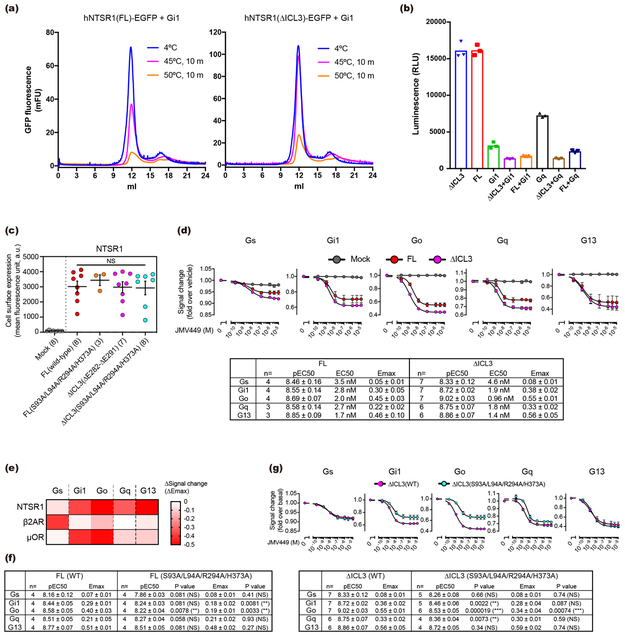
Extended Data Figure 3∣. Functional comparison between FL and ∆ICL3 hNTSR1.
a, Fluorescence-detection size-exclusion chromatography-based thermostability assay (FSEC-TS)75 for hNTSR1(FL; residues 20-418, A85L)-Gi1 (left) and hNTSR1(∆ICL3; residues 20-418, A85L, ∆282-291)-Gi1 (right). Each profile is a representative of two independent experiments. While only ~50% hNTSR1(FL)-Gi1 complex is survived after 45°C incubation for 10 min, >90% hNTSR1(FL)-Gi1 complex is survived after the same heat stress. b, Glo assay40 of hNTSR1(FL) (n=3) and hNTSR1(∆ICL3) (n=3). The intrinsic GTP hydrolysis activities of Gi1 heterotrimer and Gq heterotrimer are enhanced by hNTSR1. The guanine-nucleotide exchange factor (GEF) activities of FL and ∆ICL3 hNTSR1 proteins are equally potent. Symbols and bars represent individual value and mean of single experiment performed in triplicate. c, Cell surface expression level. HEK293 cells transiently expressing a FLAG epitope-tagged NTSR1 construct were analyzed by flow cytometry. Sample sizes are shown in parentheses. Centre lines and error bars represent mean and SEM of the indicated experiments. One-way ANOVA with Dunnet post hoc test was employed to assess statistical analyses (ANOVA P value = 0.90, NS, not significantly different among the four samples). d-g, NanoBiT G-protein dissociation assay. Concentration-response curves for G-protein dissociation signals (d, top) and its summary (d, bottom) of hNTSR1(FL) and hNTSR1(∆ICL3). Symbols and error bars represent mean and SEM of indicated independent numbers of experiments each performed in duplicates. e, Heatmap representation of NanoBiT G-protein dissociation signals for NTSR1 (∆ICL3; 10 μM JMV449), β2AR (10 μM isoproterenol), and μOR (10 μM DAMGO). Mean values of test GPCR-specific signal-changes (differences in NanoBiT-G protein dissociation signal between test GPCR-transfected cells and mock-transfected cells) are shown. Sample sizes for Gs, Gi1, Go, Gq, G13 are as follows: 5, 5, 5, 5, 5 (NTSR1); 6, 5, 3, 3, 3 (β2AR); 7, 7, 6, 5, 5 (μOR). Unlike β2AR and μOR, NTSR1 agonist (JMV449) causes signal decrease for all G-proteins (e), suggesting that all G-proteins can be recognized and activated by hNTSR1, and dissociated into Gα and Gβγ subunits. f, The summary of NanoBiT G-protein dissociation assay of hNTSR1 WT and S93A/L94A/R294A/H373A mutant for FL constructs. Concentration-response curves are shown in Fig. 5b. We used unpaired t-test with correction for multiple comparisons using the Holm-Sidak method. (NS: not significantly different from WT, ** P<0.01) g, NanoBiT G-protein dissociation assay of hNTSR1 WT and S93A/L94A/R294A/H373A mutant for ∆ICL3 constructs. Concentration-response curves of Gs, Gi1, Go, Gq, and G13 signaling (top), and the summary of the assay result (bottom). Symbols and error bars (top) represent mean and SEM of indicated independent numbers of experiments (bottom) each performed in duplicates. We used unpaired t-test with correction for multiple comparisons using the Holm-Sidak method. (NS: not significantly different from WT, * P<0.05, ** P<0.01, *** P<0.001)
Extended Data Figure 4∣. Structural comparisons of micro-conformers observed in NC- and C-state hNTSR1(∆ICL3)-Gi1 complexes.
a, Side (top) and extracellular view (bottom) of the superposed structures of three conformers in the C state. b, Side (top) and extracellular view (bottom) of the superimposed structures of two conformers in the NC state. In each micro-conformer, the G-protein is 4-5° rotated relative to the receptor.
Extended Data Figure 5∣. Cryo-EM map quality.
a, b, Density and model for transmembrane helices (TMs) of hNTSR1, α5-helix of Gαi1, and JMV449 in C-state (a) and NC-state (b) complexes. c, Putative cholesterol observed near TMs 6 and 7, and the neighboring side chains in the putative binding site of C-state (left) and NC-state (right) complexes.
Extended Data Figure 6∣. Agonist peptide binding to NTSR1.
a-c, Agonist peptide and the neighboring side chains in the ligand binding site of rNTSR1-act (a), C-state complex (b), and NC-state complex (c). Black dashed lines represent hydrogen bonds.
Extended Data Figure 7∣. Structural comparison of NTSR1s, β2AR, and μOR.
a, b, Comparison of TM6, DRY motif, and NPxxY motif between C-state hNTSR1 (blue), NC-state hNTSR1 (red), active β2AR (orange, PDB ID: 3SN6), and active μOR (purple, PDB ID: 6DDF). Black double head arrow represents the conformational difference of TM6 between receptor in Gs complex and those in Gi complex (a). Y7.53 in NPxxY motif packs against R3.50 in C-state hNTSR1, active β2AR, and active μOR, but there is no direct interaction between them in NC-state hNTSR1 (b). c, Comparison of the cytoplasmic half of TM7 between C-state hNTSR1 (blue), NC-state hNTSR1 (red), rNTSR1-inact (grey), and rNTSR1-act (green). NC-state hNTSR1 is well superimposed onto rNTSR1-inact, suggesting that TM7 adopts an inactive-like conformation in NC-state hNTSR1.
Extended Data Figure 8∣. Structural comparison of G-proteins and GPCR-G-protein complexes.
a, Overall structures of Gαi1 from C-state NTSR1-Gi1 (yellow), NC-state NTSR1-Gi1 (grey), μOR-Gi1 (green), and rhodopsin-Gi1 (purple), and Gi2 of A1AR (pink) complexes. The α-helical domain of rhodopsin-Gi1 complex is removed for clarity. b, The π-π stacking interaction between α5-helix and β6-strand, specifically observed in Gi complexes. c, d, Side view and extracellular view of the superimposed structures of C-state hNTSR1-Gi1 complex (hNTSR1: blue, Gi1: yellow) and β2AR-Gs complex (β2AR: grey, Gs: orange) (c), and C-state hNTSR1-Gi1 complex (hNTSR1: blue, Gi1: yellow) and μOR-Gi1 complex (μOR: preen, Gi1: grey) (d).
Extended Data Figure 9∣. Dynamics of the nucleotide-binding pocket in NC and C states.
a, Cryo-EM density, shown in two different contour levels, corresponding to the α5-β6 loop of Gαi1 from C-state (top) and NC-state (bottom) hNTSR1-Gi1 complex. b, Summary of MD simulation conditions. c, Dynamics of the P-loop and switch II regions during MD simulations of the C-state (left) and NC-state (right) complexes. The figures show superposed frames sampled every 50 ns from five independent simulations for each state. In these simulations, the P-loop and switch II regions show similar flexibility for both the C-state and NC-state complexes. d, Representative MD simulations initiated from the C-state hNTSR1-Gi1 complex (left) and the NC-state hNTSR1-Gi1 complex (right). The RMSD of the NPxxY motif relative to the NC-state structure (top) and the distance between TM3 and TM6 (bottom) are plotted for each simulation. In both C-state and NC-state hNTSR1-Gi1 complexes, the NPxxY region and TM6 consistently retain the conformations observed in the cryoEM structures. e, RMSD of α5 to the cryoEM C-state Gi1 for each simulation of the NC-state and C-state complexes. The trajectories were aligned on TM1–TM4 of the receptor, and the RMSD was calculated for the backbone atoms of residues 329 to 354 of α5. f, Dynamics of the α5-β6 loop for each independent simulation of the C- and NC-state complexes. Frames are sampled every 20 ns from each individual simulation. In these simulations, the α5-β6 loop shows enhanced conformational variability in the C-state complex compared to the NC-state complex. g, The calculated solvent-accessible surface area (SASA) of the nucleotide-binding pocket in the NC and C states. The solvent accessibility of the pocket is consistently larger for the C state (P = 0.00027976943074583155) using Welch’s two-sided t-test and treating each simulation as an independent data point).
Supplementary Material
Acknowledgements
We thank Yoon Seok Kim for assistance in HEK cell maintenance and transfection; Betsy White for assistance in Sf9 insect cell maintenance and mini prep of plasmids; Shoji Maeda for P1 virus of scFv16; Karen Geiselhart and Michele Lima for administrative support of the project; Matthieu Masureel and Steven Lavington for useful discussions on the manuscript. C.-M.S. acknowledges the Sigrid Jusélius Foundation and the International Human Frontier Science Program (Long-Term Fellowship LT000916–2018-L). R.F. was funded by grant NNF15OC0015268 from the Novo Nordisk Foundation and the Stanford Bio-X Program. This work was supported by National Institutes of Health (NIH) grants R01GM127359 (R.O.D.), R01GM083118 (B.K.K and G.S.), and R01NS028471 (B.K.K.), the PRIME JP17gm5910013 (A.I.) and the LEAP JP17gm0010004 (A.I. and J.A.) from the Japan Agency for Medical Research and Development, JSPS KAKENHI 19H03163 (H.E.K.) and 17K08264 (A.I.), and the Mathers Foundation (G.S. and B.K.K.). B.K.K. is a Chan–Zuckerberg Biohub Investigator.
Footnotes
B.K.K. is a founder of and consultant for ConfometRx, Inc. Readers are welcome to comment on the online version of the paper.
Supplementary Information is linked to the online version of the paper at www.nature.com/nature.
References
- 1.Carraway R & Leeman SE The isolation of a new hypotensive peptide, neurotensin, from bovine hypothalami. J Biol Chem 248, 6854–61 (1973). [PubMed] [Google Scholar]
- 2.Vincent JP, Mazella J & Kitabgi P Neurotensin and neurotensin receptors. Trends Pharmacol Sci 20, 302–9 (1999). [DOI] [PubMed] [Google Scholar]
- 3.Boules M, Li Z, Smith K, Fredrickson P & Richelson E Diverse roles of neurotensin agonists in the central nervous system. Front Endocrinol (Lausanne) 4, 36 (2013). [DOI] [PMC free article] [PubMed] [Google Scholar]
- 4.Wu Z, Martinez-Fong D, Tredaniel J & Forgez P Neurotensin and its high affinity receptor 1 as a potential pharmacological target in cancer therapy. Front Endocrinol (Lausanne) 3, 184 (2012). [DOI] [PMC free article] [PubMed] [Google Scholar]
- 5.Mustain WC, Rychahou PG & Evers BM The role of neurotensin in physiologic and pathologic processes. Curr Opin Endocrinol Diabetes Obes 18, 75–82 (2011). [DOI] [PubMed] [Google Scholar]
- 6.Schroeder LE & Leinninger GM Role of central neurotensin in regulating feeding: Implications for the development and treatment of body weight disorders. Biochim Biophys Acta 1864, 900–916 (2018). [DOI] [PMC free article] [PubMed] [Google Scholar]
- 7.Tanaka K, Masu M & Nakanishi S Structure and functional expression of the cloned rat neurotensin receptor. Neuron 4, 847–54 (1990). [DOI] [PubMed] [Google Scholar]
- 8.Chalon P, Vita N, Kaghad M, Guillemot M, Bonnin J, Delpech B, Le Fur G, Ferrara P & Caput D Molecular cloning of a levocabastine-sensitive neurotensin binding site. FEBS Lett 386, 91–4 (1996). [DOI] [PubMed] [Google Scholar]
- 9.Mazella J, Botto JM, Guillemare E, Coppola T, Sarret P & Vincent JP Structure, functional expression, and cerebral localization of the levocabastine-sensitive neurotensin/neuromedin N receptor from mouse brain. J Neurosci 16, 5613–20 (1996). [DOI] [PMC free article] [PubMed] [Google Scholar]
- 10.Mazella J, Zsurger N, Navarro V, Chabry J, Kaghad M, Caput D, Ferrara P, Vita N, Gully D, Maffrand JP & Vincent JP The 100-kDa neurotensin receptor is gp95/sortilin, a non-G-protein-coupled receptor. J Biol Chem 273, 26273–6 (1998). [DOI] [PubMed] [Google Scholar]
- 11.Kitabgi P Targeting neurotensin receptors with agonists and antagonists for therapeutic purposes. Curr Opin Drug Discov Devel 5, 764–76 (2002). [PubMed] [Google Scholar]
- 12.Besserer-Offroy E, Brouillette RL, Lavenus S, Froehlich U, Brumwell A, Murza A, Longpre JM, Marsault E, Grandbois M, Sarret P & Leduc R The signaling signature of the neurotensin type 1 receptor with endogenous ligands. Eur J Pharmacol 805, 1–13 (2017). [DOI] [PubMed] [Google Scholar]
- 13.White JF, Noinaj N, Shibata Y, Love J, Kloss B, Xu F, Gvozdenovic-Jeremic J, Shah P, Shiloach J, Tate CG & Grisshammer R Structure of the agonist-bound neurotensin receptor. Nature 490, 508–13 (2012). [DOI] [PMC free article] [PubMed] [Google Scholar]
- 14.Egloff P, Hillenbrand M, Klenk C, Batyuk A, Heine P, Balada S, Schlinkmann KM, Scott DJ, Schutz M & Pluckthun A Structure of signaling-competent neurotensin receptor 1 obtained by directed evolution in Escherichia coli. Proc Natl Acad Sci U S A 111, E655–62 (2014). [DOI] [PMC free article] [PubMed] [Google Scholar]
- 15.Krumm BE, White JF, Shah P & Grisshammer R Structural prerequisites for G-protein activation by the neurotensin receptor. Nat Commun 6, 7895 (2015). [DOI] [PMC free article] [PubMed] [Google Scholar]
- 16.Krumm BE, Lee S, Bhattacharya S, Botos I, White CF, Du H, Vaidehi N & Grisshammer R Structure and dynamics of a constitutively active neurotensin receptor. Sci Rep 6, 38564 (2016). [DOI] [PMC free article] [PubMed] [Google Scholar]
- 17.Ballesteros JA & Weinstein H Integrated methods for the construction of three dimensional models and computational probing of structure function relations in G protein-coupled receptors. Methods Neurosci 25, 366–428 (1995). [Google Scholar]
- 18.Dubuc I, Costentin J, Doulut S, Rodriguez M, Martinez J & Kitabgi P JMV 449: a pseudopeptide analogue of neurotensin-(8–13) with highly potent and long-lasting hypothermic and analgesic effects in the mouse. Eur J Pharmacol 219, 327–9 (1992). [DOI] [PubMed] [Google Scholar]
- 19.Koehl A, Hu H, Maeda S, Zhang Y, Qu Q, Paggi JM, Latorraca NR, Hilger D, Dawson R, Matile H, Schertler GFX, Granier S, Weis WI, Dror RO, Manglik A, Skiniotis G & Kobilka BK Structure of the micro-opioid receptor-Gi protein complex. Nature 558, 547–552 (2018). [DOI] [PMC free article] [PubMed] [Google Scholar]
- 20.Noble AJ, Wei H, Dandey VP, Zhang Z, Tan YZ, Potter CS & Carragher B Reducing effects of particle adsorption to the air-water interface in cryo-EM. Nat Methods 15, 793–795 (2018). [DOI] [PMC free article] [PubMed] [Google Scholar]
- 21.Rasmussen SG, Choi HJ, Fung JJ, Pardon E, Casarosa P, Chae PS, Devree BT, Rosenbaum DM, Thian FS, Kobilka TS, Schnapp A, Konetzki I, Sunahara RK, Gellman SH, Pautsch A, Steyaert J, Weis WI & Kobilka BK Structure of a nanobody-stabilized active state of the beta(2) adrenoceptor. Nature 469, 175–80 (2011). [DOI] [PMC free article] [PubMed] [Google Scholar]
- 22.Huang W, Manglik A, Venkatakrishnan AJ, Laeremans T, Feinberg EN, Sanborn AL, Kato HE, Livingston KE, Thorsen TS, Kling RC, Granier S, Gmeiner P, Husbands SM, Traynor JR, Weis WI, Steyaert J, Dror RO & Kobilka BK Structural insights into micro-opioid receptor activation. Nature 524, 315–21 (2015). [DOI] [PMC free article] [PubMed] [Google Scholar]
- 23.Rasmussen SG, DeVree BT, Zou Y, Kruse AC, Chung KY, Kobilka TS, Thian FS, Chae PS, Pardon E, Calinski D, Mathiesen JM, Shah ST, Lyons JA, Caffrey M, Gellman SH, Steyaert J, Skiniotis G, Weis WI, Sunahara RK & Kobilka BK Crystal structure of the beta2 adrenergic receptor-Gs protein complex. Nature 477, 549–55 (2011). [DOI] [PMC free article] [PubMed] [Google Scholar]
- 24.Capper MJ & Wacker D How the ubiquitous GPCR receptor family selectively activates signalling pathways. Nature 558, 529–530 (2018). [DOI] [PubMed] [Google Scholar]
- 25.Dror RO, Arlow DH, Maragakis P, Mildorf TJ, Pan AC, Xu H, Borhani DW & Shaw DE Activation mechanism of the beta2-adrenergic receptor. Proc Natl Acad Sci U S A 108, 18684–9 (2011). [DOI] [PMC free article] [PubMed] [Google Scholar]
- 26.Latorraca NR, Venkatakrishnan AJ & Dror RO GPCR Dynamics: Structures in Motion. Chem Rev 117, 139–155 (2017). [DOI] [PubMed] [Google Scholar]
- 27.Draper-Joyce CJ, Khoshouei M, Thal DM, Liang YL, Nguyen ATN, Furness SGB, Venugopal H, Baltos JA, Plitzko JM, Danev R, Baumeister W, May LT, Wootten D, Sexton PM, Glukhova A & Christopoulos A Structure of the adenosine-bound human adenosine A1 receptor-Gi complex. Nature 558, 559–563 (2018). [DOI] [PubMed] [Google Scholar]
- 28.Garcia-Nafria J, Nehme R, Edwards PC & Tate CG Cryo-EM structure of the serotonin 5-HT1B receptor coupled to heterotrimeric Go. Nature 558, 620–623 (2018). [DOI] [PMC free article] [PubMed] [Google Scholar]
- 29.Wall MA, Coleman DE, Lee E, Iniguez-Lluhi JA, Posner BA, Gilman AG & Sprang SR The structure of the G protein heterotrimer Gi alpha 1 beta 1 gamma 2. Cell 83, 1047–58 (1995). [DOI] [PubMed] [Google Scholar]
- 30.Sun D, Flock T, Deupi X, Maeda S, Matkovic M, Mendieta S, Mayer D, Dawson R, Schertler GFX, Madan Babu M & Veprintsev DB Probing Galphai1 protein activation at single-amino acid resolution. Nat Struct Mol Biol 22, 686–694 (2015). [DOI] [PMC free article] [PubMed] [Google Scholar]
- 31.Thomas TC, Schmidt CJ & Neer EJ G-protein alpha o subunit: mutation of conserved cysteines identifies a subunit contact surface and alters GDP affinity. Proc Natl Acad Sci U S A 90, 10295–9 (1993). [DOI] [PMC free article] [PubMed] [Google Scholar]
- 32.Iiri T, Herzmark P, Nakamoto JM, van Dop C & Bourne HR Rapid GDP release from Gs alpha in patients with gain and loss of endocrine function. Nature 371, 164–8 (1994). [DOI] [PubMed] [Google Scholar]
- 33.Posner BA, Mixon MB, Wall MA, Sprang SR & Gilman AG The A326S mutant of Gialpha1 as an approximation of the receptor-bound state. J Biol Chem 273, 21752–8 (1998). [DOI] [PubMed] [Google Scholar]
- 34.Moro O, Lameh J, Hogger P & Sadee W Hydrophobic amino acid in the i2 loop plays a key role in receptor-G protein coupling. J Biol Chem 268, 22273–6 (1993). [PubMed] [Google Scholar]
- 35.Grishina G & Berlot CH A surface-exposed region of G(salpha) in which substitutions decrease receptor-mediated activation and increase receptor affinity. Mol Pharmacol 57, 1081–92 (2000). [PubMed] [Google Scholar]
- 36.Hu J, Wang Y, Zhang X, Lloyd JR, Li JH, Karpiak J, Costanzi S & Wess J Structural basis of G protein-coupled receptor-G protein interactions. Nat Chem Biol 6, 541–8 (2010). [DOI] [PMC free article] [PubMed] [Google Scholar]
- 37.Hillenbrand M, Schori C, Schoppe J & Pluckthun A Comprehensive analysis of heterotrimeric G-protein complex diversity and their interactions with GPCRs in solution. Proc Natl Acad Sci U S A 112, E1181–90 (2015). [DOI] [PMC free article] [PubMed] [Google Scholar]
- 38.Inoue A Illuminating G protein coupling selectivity of GPCRs. submitted. [DOI] [PMC free article] [PubMed] [Google Scholar]
- 39.Sounier R, Mas C, Steyaert J, Laeremans T, Manglik A, Huang W, Kobilka BK, Demene H & Granier S Propagation of conformational changes during mu-opioid receptor activation. Nature 524, 375–8 (2015). [DOI] [PMC free article] [PubMed] [Google Scholar]
- 40.Gregorio GG, Masureel M, Hilger D, Terry DS, Juette M, Zhao H, Zhou Z, Perez-Aguilar JM, Hauge M, Mathiasen S, Javitch JA, Weinstein H, Kobilka BK & Blanchard SC Single-molecule analysis of ligand efficacy in beta2AR-G-protein activation. Nature 547, 68–73 (2017). [DOI] [PMC free article] [PubMed] [Google Scholar]
- 41.Van Eps N, Altenbach C, Caro LN, Latorraca NR, Hollingsworth SA, Dror RO, Ernst OP & Hubbell WL Gi- and Gs-coupled GPCRs show different modes of G-protein binding. Proc Natl Acad Sci U S A 115, 2383–2388 (2018). [DOI] [PMC free article] [PubMed] [Google Scholar]
Additional References.
- 42.Dror RO, Mildorf TJ, Hilger D, Manglik A, Borhani DW, Arlow DH, Philippsen A, Villanueva N, Yang Z, Lerch MT, Hubbell WL, Kobilka BK, Sunahara RK & Shaw DE SIGNAL TRANSDUCTION. Structural basis for nucleotide exchange in heterotrimeric G proteins. Science 348, 1361–5 (2015). [DOI] [PMC free article] [PubMed] [Google Scholar]
- 43.Zheng SQ, Palovcak E, Armache JP, Verba KA, Cheng Y & Agard DA MotionCor2: anisotropic correction of beam-induced motion for improved cryo-electron microscopy. Nat Methods 14, 331–332 (2017). [DOI] [PMC free article] [PubMed] [Google Scholar]
- 44.Zhang K Gctf: Real-time CTF determination and correction. J Struct Biol 193, 1–12 (2016). [DOI] [PMC free article] [PubMed] [Google Scholar]
- 45.Scheres SH Processing of Structurally Heterogeneous Cryo-EM Data in RELION. Methods Enzymol 579, 125–57 (2016). [DOI] [PubMed] [Google Scholar]
- 46.Heymann JB Single particle reconstruction and validation using Bsoft for the map challenge. J Struct Biol 204, 90–95 (2018). [DOI] [PMC free article] [PubMed] [Google Scholar]
- 47.Emsley P & Cowtan K Coot: model-building tools for molecular graphics. Acta Crystallogr D Biol Crystallogr 60, 2126–32 (2004). [DOI] [PubMed] [Google Scholar]
- 48.Adams PD, Afonine PV, Bunkoczi G, Chen VB, Davis IW, Echols N, Headd JJ, Hung LW, Kapral GJ, Grosse-Kunstleve RW, McCoy AJ, Moriarty NW, Oeffner R, Read RJ, Richardson DC, Richardson JS, Terwilliger TC & Zwart PH PHENIX: a comprehensive Python-based system for macromolecular structure solution. Acta Crystallogr D Biol Crystallogr 66, 213–21 (2010). [DOI] [PMC free article] [PubMed] [Google Scholar]
- 49.Williams CJ, Headd JJ, Moriarty NW, Prisant MG, Videau LL, Deis LN, Verma V, Keedy DA, Hintze BJ, Chen VB, Jain S, Lewis SM, Arendall WB 3rd, Snoeyink J, Adams PD, Lovell SC, Richardson JS & Richardson DC MolProbity: More and better reference data for improved all-atom structure validation. Protein Sci 27, 293–315 (2018). [DOI] [PMC free article] [PubMed] [Google Scholar]
- 50.Pettersen EF, Goddard TD, Huang CC, Couch GS, Greenblatt DM, Meng EC & Ferrin TE UCSF Chimera--a visualization system for exploratory research and analysis. J Comput Chem 25, 1605–12 (2004). [DOI] [PubMed] [Google Scholar]
- 51.Goddard TD, Huang CC, Meng EC, Pettersen EF, Couch GS, Morris JH & Ferrin TE UCSF ChimeraX: Meeting modern challenges in visualization and analysis. Protein Sci 27, 14–25 (2018). [DOI] [PMC free article] [PubMed] [Google Scholar]
- 52.Jacobson MP, Pincus DL, Rapp CS, Day TJ, Honig B, Shaw DE & Friesner RA A hierarchical approach to all-atom protein loop prediction. Proteins 55, 351–67 (2004). [DOI] [PubMed] [Google Scholar]
- 53.Jacobson MP, Friesner RA, Xiang Z & Honig B On the role of the crystal environment in determining protein side-chain conformations. J Mol Biol 320, 597–608 (2002). [DOI] [PubMed] [Google Scholar]
- 54.Eswar N, Webb B, Marti-Renom MA, Madhusudhan MS, Eramian D, Shen MY, Pieper U & Sali A Comparative protein structure modeling using MODELLER. Curr Protoc Protein Sci Chapter 2, Unit 2 9 (2007). [DOI] [PubMed] [Google Scholar]
- 55.Ghanouni P, Schambye H, Seifert R, Lee TW, Rasmussen SG, Gether U & Kobilka BK The effect of pH on beta(2) adrenoceptor function. Evidence for protonation-dependent activation. J Biol Chem 275, 3121–7 (2000). [DOI] [PubMed] [Google Scholar]
- 56.Ranganathan A, Dror RO & Carlsson J Insights into the role of Asp79(2.50) in beta2 adrenergic receptor activation from molecular dynamics simulations. Biochemistry 53, 7283–96 (2014). [DOI] [PubMed] [Google Scholar]
- 57.Lomize MA, Lomize AL, Pogozheva ID & Mosberg HI OPM: orientations of proteins in membranes database. Bioinformatics 22, 623–5 (2006). [DOI] [PubMed] [Google Scholar]
- 58.Betz RM Dabble. 10.5281/zenodo.836914 (2018). [DOI] [Google Scholar]
- 59.Vilardaga JP, Bunemann M, Krasel C, Castro M & Lohse MJ Measurement of the millisecond activation switch of G protein-coupled receptors in living cells. Nat Biotechnol 21, 807–12 (2003). [DOI] [PubMed] [Google Scholar]
- 60.Lewis GN A New Principle of Equilibrium. Proc Natl Acad Sci U S A 11, 179–83 (1925). [DOI] [PMC free article] [PubMed] [Google Scholar]
- 61.Astumian RD Microscopic reversibility as the organizing principle of molecular machines. Nat Nanotechnol 7, 684–8 (2012). [DOI] [PubMed] [Google Scholar]
- 62.Hopkins CW, Le Grand S, Walker RC & Roitberg AE Long-Time-Step Molecular Dynamics through Hydrogen Mass Repartitioning. J Chem Theory Comput 11, 1864–74 (2015). [DOI] [PubMed] [Google Scholar]
- 63.Ryckaert J-P, Ciccotti G & Berendsen HJ Numerical integration of the cartesian equations of motion of a system with constraints: molecular dynamics of n-alkanes. J Comput Phys 23, 327–341 (1977). [Google Scholar]
- 64.Huang J & MacKerell AD Jr. CHARMM36 all-atom additive protein force field: validation based on comparison to NMR data. J Comput Chem 34, 2135–45 (2013). [DOI] [PMC free article] [PubMed] [Google Scholar]
- 65.Klauda JB, Venable RM, Freites JA, O’Connor JW, Tobias DJ, Mondragon-Ramirez C, Vorobyov I, MacKerell AD Jr. & Pastor RW Update of the CHARMM all-atom additive force field for lipids: validation on six lipid types. J Phys Chem B 114, 7830–43 (2010). [DOI] [PMC free article] [PubMed] [Google Scholar]
- 66.MacKerell AD, Bashford D, Bellott M, Dunbrack RL, Evanseck JD, Field MJ, Fischer S, Gao J, Guo H, Ha S, Joseph-McCarthy D, Kuchnir L, Kuczera K, Lau FT, Mattos C, Michnick S, Ngo T, Nguyen DT, Prodhom B, Reiher WE, Roux B, Schlenkrich M, Smith JC, Stote R, Straub J, Watanabe M, Wiorkiewicz-Kuczera J, Yin D & Karplus M All-atom empirical potential for molecular modeling and dynamics studies of proteins. J Phys Chem B 102, 3586–616 (1998). [DOI] [PubMed] [Google Scholar]
- 67.Best RB, Mittal J, Feig M & MacKerell AD Jr. Inclusion of many-body effects in the additive CHARMM protein CMAP potential results in enhanced cooperativity of alpha-helix and beta-hairpin formation. Biophys J 103, 1045–51 (2012). [DOI] [PMC free article] [PubMed] [Google Scholar]
- 68.Best RB, Zhu X, Shim J, Lopes PE, Mittal J, Feig M & Mackerell AD Jr. Optimization of the additive CHARMM all-atom protein force field targeting improved sampling of the backbone phi, psi and side-chain chi(1) and chi(2) dihedral angles. J Chem Theory Comput 8, 3257–3273 (2012). [DOI] [PMC free article] [PubMed] [Google Scholar]
- 69.Salomon-Ferrer R, Gotz AW, Poole D, Le Grand S & Walker RC Routine Microsecond Molecular Dynamics Simulations with AMBER on GPUs. 2. Explicit Solvent Particle Mesh Ewald. J Chem Theory Comput 9, 3878–88 (2013). [DOI] [PubMed] [Google Scholar]
- 70.Pearlman DA, Case DA, Caldwell JW, Ross WS, Cheatham TE III, DeBolt S, Ferguson D, Seibel G & Kollman P AMBER, a package of computer programs for applying molecular mechanics, normal mode analysis, molecular dynamics and free energy calculations to simulate the structural and energetic properties of molecules. Comput Phys Commun 91, 1–41 (1995). [Google Scholar]
- 71.Humphrey W, Dalke A & Schulten K VMD: visual molecular dynamics. J Mol Graph 14, 33–8, 27–8 (1996). [DOI] [PubMed] [Google Scholar]
- 72.Coleman DE & Sprang SR Structure of Gialpha1.GppNHp, autoinhibition in a galpha protein-substrate complex. J Biol Chem 274, 16669–72 (1999). [DOI] [PubMed] [Google Scholar]
- 73.Grundmann M, Merten N, Malfacini D, Inoue A, Preis P, Simon K, Ruttiger N, Ziegler N, Benkel T, Schmitt NK, Ishida S, Muller I, Reher R, Kawakami K, Inoue A, Rick U, Kuhl T, Imhof D, Aoki J, Konig GM, Hoffmann C, Gomeza J, Wess J & Kostenis E Lack of beta-arrestin signaling in the absence of active G proteins. Nat Commun 9, 341 (2018). [DOI] [PMC free article] [PubMed] [Google Scholar]
- 74.Robert X & Gouet P Deciphering key features in protein structures with the new ENDscript server. Nucleic Acids Res 42, W320–4 (2014). [DOI] [PMC free article] [PubMed] [Google Scholar]
- 75.Hattori M, Hibbs RE & Gouaux E A fluorescence-detection size-exclusion chromatography-based thermostability assay for membrane protein precrystallization screening. Structure 20, 1293–9 (2012). [DOI] [PMC free article] [PubMed] [Google Scholar]
- 76.Oates J, Faust B, Attrill H, Harding P, Orwick M & Watts A The role of cholesterol on the activity and stability of neurotensin receptor 1. Biochim Biophys Acta 1818, 2228–33 (2012). [DOI] [PubMed] [Google Scholar]
- 77.Di Scala C, Baier CJ, Evans LS, Williamson PTF, Fantini J & Barrantes FJ Relevance of CARC and CRAC Cholesterol-Recognition Motifs in the Nicotinic Acetylcholine Receptor and Other Membrane-Bound Receptors. Curr Top Membr 80, 3–23 (2017). [DOI] [PubMed] [Google Scholar]
Associated Data
This section collects any data citations, data availability statements, or supplementary materials included in this article.
Supplementary Materials
Data Availability Statement
All data generated or analyzed during this study are included in this published article and its Supplementary Information. The cryo-EM density maps for the hNTSR1-Gi1 complex in C and NC states have been deposited in the Electron Microscopy Data Bank (EMDB) under accession codes EMD-20180 and EMD-20181, respectively. The coordinates for the models of hNTSR1-Gi1 in both states have been deposited in the Protein Data Bank (PDB) under accession numbers 6OS9 and 6OSA respectively. All other data are available upon request to the corresponding authors.


