

Abstract
Background/Objectives:
Although childhood attention deficit hyperactivity disorder (ADHD) has been previously associated with concurrent and later obesity in adulthood, the etiology of this association remains unclear. The objective of this study is to determine the shared genetic effects of ADHD symptoms and BMI in a large sample of sibling-pairs, consider how these shared effects may vary over time, and examine potential sex differences.
Subject/Methods:
Sibling-pair data was obtained from the National Longitudinal Study of Adolescent to Adult Health (Add Health); childhood ADHD symptoms were reported retrospectively during young adulthood, while three prospective measurements of BMI were available from young adulthood to later adulthood. Cholesky decomposition models were fit to this data using Mx using maximum-likelihood estimation. The twin and sibling sample for these analyses included: 221 monozygotic (MZ) pairs (92 male-male, 139 female-female), 228 dizygotic (DZ) pairs (123 male-male, 105 female-female), 471 full-sibling (FS) pairs (289 male-male, 182 female-female), 106 male-female DZ twin pairs, and 234 male-female FS pairs.
Results:
The magnitude of the association between childhood ADHD symptoms and BMI changed over time, and by sex. The etiological relationship between childhood ADHD symptoms and the three prospective measurements of BMI differed for males and females, such that unique or non-shared environmental influences contributed to the relationship within males, and genetic factors contributed to the relationship within females. Specifically, among females, genetic influences on childhood ADHD symptoms were partially shared with those effecting BMI and increased from adolescence to later adulthood (genetic correlation = 0.20 (95% CI: 0.07–0.36) in adolescence and 0.24 (95% CI: 0.10, 0.41) in adulthood).
Conclusion:
Genetic influences on ADHD symptoms in childhood are partially shared with those effecting obesity. However, future research is needed to determine why this association is limited to females.
Keywords: ADHD, Body Mass Index, Heritability, Add Health, Longitudinal
Introduction
The epidemic of obesity is a major public health concern, with worldwide reports of nearly 1.6 billion adults who are overweight, and 400 million obese1. Obesity is a complex and multifactorial chronic disease, which is influenced by both genes and environment2. Family, adoption, and twin studies demonstrate that 30–70% of the variation in obesity-related phenotypes are heritable3. Genome wide association studies have identified at least 75 obesity-susceptibility loci, with FTO being the first obesity-susceptibility gene identified which has been consistently replicated finding within studies of body mass index (BMI) and obesity risk4.
The obesity epidemic is often attributed to dietary and behavioral trends acting on individuals’ genetic makeup which influences obesity-related phenotypes, such as body mass and susceptibility to obesity-related disease. Thus, it is also important to consider the role that the environment plays in obesity risk. Previous research has focused on environmental exposures related to lifestyle (e.g. physical inactivity) and dietary intake. However, co-occurring, non-eating related psychological symptoms and disorders might also play an important role among some individuals. Identifying individual differences that relate to vulnerability to non-eating related psychological symptoms and disorders associated with overweight and obesity would help improve targeted prevention and intervention strategies.
One area of recent investigation has been the link between Attention Deficit Hyperactivity Disorder (ADHD) and obesity5. In clinical samples, childhood ADHD has been associated with concurrent and later obesity in adulthood6,7. Likewise, a recent study using data from electronic health records found that ADHD during childhood was associated with higher childhood BMI and that stimulant medication blunted early BMI growth; however, this was not protective over the longer term8. With some exceptions9,10, the positive association between ADHD and obesity has been extended to several population-based cohorts, which is useful since clinical samples tend to be overrepresented by individuals with multiple comorbid conditions11. For instance, an association between adult ADHD and overweight/obesity is found using data from the Collaborative Psychiatric Epidemiology Survey12. Using Add Health data, Fuemmeler et al. (2011) found that both inattention and hyperactive-impulsive symptoms have a dose-effect relationship with the prevalence of obesity in the population13. Using data from the National Epidemiologic Study on Alcohol and Related Conditions, Cortese et al. (2013) found a significant association between ADHD and obesity; however, this was among women only7. This gender specific finding was also reported by van Egmond-Frohlich et al. (2012) in an adolescent sample14. Finally, in a recent longitudinal study of the Northern Finland Birth Cohort, Khalife et al. (2014) were able to show a prospective unidirectional association between childhood ADHD and later adolescent obesity15.
Despite evidence from these studies that ADHD and obesity are associated, explanatory factors linking ADHD and obesity remain unclear. Individuals with ADHD symptoms are characterized by impulsive behaviors and cognitive deficits in attention which may confer risk on obesogenic behaviors, such as poor planning for dietary and physical activity goals or compulsive food intake. It has also been suggested that ADHD and obesity may share common biological underpinnings, as explained by “reward deficiency syndrome”, which suggests that the etiology of ADHD is due in part to the insufficiency of dopamine16, or common neuro-genetic vulnerabilities17–19. Impulsivity may contribute to obesity through disordered eating patterns (e.g. quantity and type of food being consumed). The dysregulation of dopamine may also mediate the consumption of high caloric, low nutrient foods and contribute to overweight obesity20. The robustness of these associations were assessed in a recently conducted meta-analysis21, which suggests that the association between ADHD and overweight and obese status is generally larger in adolescence relative to childhood, and more reliable in girls than in boys as demonstrated in other studies22.
Twin and family studies can provide knowledge about the sources of variance (e.g. additive genetic factors, shared environmental factors, and non-shared environmental factors) contributing to a phenotype, as well as shared genetic effects of two or more phenotypes. This knowledge can help guide research on the potential risk factors for a phenotype (e.g. upbringing, specific genetic variants) or the extent to which two comorbid phenotypes (e.g. ADHD symptoms and obesity) share similar etiologies. Twin studies of both ADHD and obesity have demonstrated that there is moderate to strong evidence of genetic effects on these phenotypes. Heritability estimates of BMI have ranged from 0.30 to over 0.90, varying as a function of study design and age23–30. Similarly, heritable contributions to ADHD have also varied as a function of rater (e.g., parent vs self-report), assessment modality (e.g. interview or questionnaire), and age with estimates ranging between 0.29 and 0.9431–34. However, to date, there have been no studies examining the shared genetic effects between ADHD symptoms and BMI using sibling samples.
Given the link between ADHD and obesity and possible shared variance between the phenotypes, we hypothesized that there may be evidence of shared heritability between childhood ADHD symptoms and BMI. Thus, the purpose of this study was to determine the shared genetic effects of ADHD symptoms and BMI in a large sibling pair sample. In addition, we aimed to determine the degree to which these shared effects varied over time. Since, gender differences have been reported in the association between ADHD and obesity22, models were formed to also examine gender differences.
Materials, Subjects, and Methods
Data Source and Study Sample
The National Longitudinal Study of Adolescent to Adult Health (Add Health) is a nationally representative, probability based survey of 20,745 adolescents in the United States, aged 12–19 years, when the study began in 1994–1995. Respondents completed in-home interviews and surveys on four separate occasions (Wave I: April to December 1995; Wave II: April to August 1996; Wave III: August 2001 to August 2002; and Wave IV: January 2008 to February 2009). Our sample was drawn from genetically informative sibling-pairs, and data were obtained from when participants were adolescents (Wave II), young adults (Wave III), and older adults (Wave IV). A detailed description of the study design and the sampling strategy utilized in the full Add Health and sibling-pairs sample is available elsewhere35,36. To be included in this study, participants had to be a part of a sibling-pair and provide information on ADHD symptoms and BMI. The sibling pair sample for these analyses included: 221 monozygotic (MZ) pairs (92 male-male, 139 female-female), 228 dizygotic (DZ) pairs (123 male-male, 105 female-female), 471 full-sibling (FS) pairs (289 male-male, 182 female-female), 106 male-female DZ twin pairs, and 234 male-female FS pairs. At Wave IV, the mean age was 29.0 (± 1.76) years old among males and 28.8 (± 1.71) years old females. The majority (68.9%) self-reported White race, 22.6% reported Black, and 8.3% either Asian or Native American. Participation rate was > 80%37. Add Health participants provided written informed consent for participation in all aspects of Add Health, in accordance with the University of North Carolina School of Public Health Institutional Review Board guidelines.
Measures
ADHD symptoms.
ADHD symptoms were retrospectively reported at Wave III using the ADHD Symptom Scale, Self-Report38. Specifically, adult participants reported on a total of 17 Diagnostic and Statistical Manual – IV (DSM-IV) ADHD symptoms experienced between the ages of 5 to 12 years old. One DSM-IV ADHD symptom was not assessed (often interrupts or intrudes on others). Instead respondents were asked to indicate how spiteful or vindictive they had been. Since this item is a measure of oppositional defiant disorder (ODD), it was not included in these analyses. Symptom frequency and severity were scored using a 4-point Likert scale that ranged between 0 (rarely or never), 1 (sometimes), 2 (often) and 3 (very often). Combined ADHD symptom scores were considered present if the symptoms was experienced “often” or “very often.” This approach to dichotomizing symptoms has been used in other community-based studies of ADHD symptomatology, is considered clinical convention39, and was also used in previous studies on the relation between ADHD and smoking outcomes40,41.
ADHD symptoms occurring prior to age 5 and whether levels of functioning differed across settings were not collected. The use of retrospective report is common in clinical practice when working with adults with ADHD and previous studies support the reliability and validity of these self-reports42–46. We have previously showed that parents of adolescents reporting six or more symptoms on either or both hyperactive-impulsive (HI) and inattention (IN) scales were more likely to indicate learning or behavioral problems in their adolescent children at Wave 1. These adolescents were also more likely to report taking medications for ADHD at Wave III41. Scores on the ADHD scale ranged between 0 and 18, were normally distributed (skewness = −0.09, kurtosis = −0.96), and had an internal reliability coefficient of 0.90. ADHD scores on the combined scale were higher (p < 0.0001) among males (10.70, +/− 4.68) than females (8.75, +/− 4.72) and tests of the homogeneity of variance identified no significant differences between the sexes or as a function of zygosity status31. Further, means and standard deviations did not differ as a function of sibling type. Thus, the differences observed, or lack thereof, likely represents true differences and not systematic differences in responding among participants in the groups.
Body Mass Index (BMI).
Measured height and weight were ascertained by Add Health study personnel at Waves II-IV (e.g. adolescence, young adulthood, and older adulthood) using a digital scale. BMI was calculated by dividing weight in kilograms by height in squared meters at each wave of data collection. Exclusions from the current analyses were based on whether 1) the participant was currently pregnant, 2) had been pregnant in the prior 12 months, or 3) reported a physical disability (e.g., missing limb or limited mobility).
Statistical Analyses.
Biometric genetic modeling was utilized to better understand the genetic and environmental influences on the covariation between childhood ADHD and BMI. Generally, biometric genetic models assume that the variance in a given phenotype is due to the influence of additive genetic effects (A), shared (family) environmental effects (C), and non-shared environmental effects (E), which are derived from the differing genetic relationship between monozygotic (MZ) and dizygotic (DZ) twin pairs. It is assumed that MZ pairs share 100% of their genes, while DZ pairs share, on average, 50% of their genes identical by descent47. Even more specifically, we examined the association between childhood ADHD and BMI across three developmental phases – adolescence, young adulthood, and later adulthood – by fitting a Cholesky decomposition model using the raw data option in Mx48.
In this model, the variance of ADHD symptoms during childhood were decomposed into genetic and environmental influences that were common with BMI measures, as well as genetic and environmental influences that were unique to childhood ADHD. Genetic correlations, which index the degree to which genetic influences on ADHD symptoms overlap with BMI during adolescence, young adulthood and adulthood were obtained from this model (see Figure 1). Latent genetic and environmental factors affecting BMI during adolescence are conceptualized to influence BMI at later ages, but not ADHD symptomology during childhood. Consistent with previous analyses age and gender were added as covariates in genetic models24,31.
Figure 1.
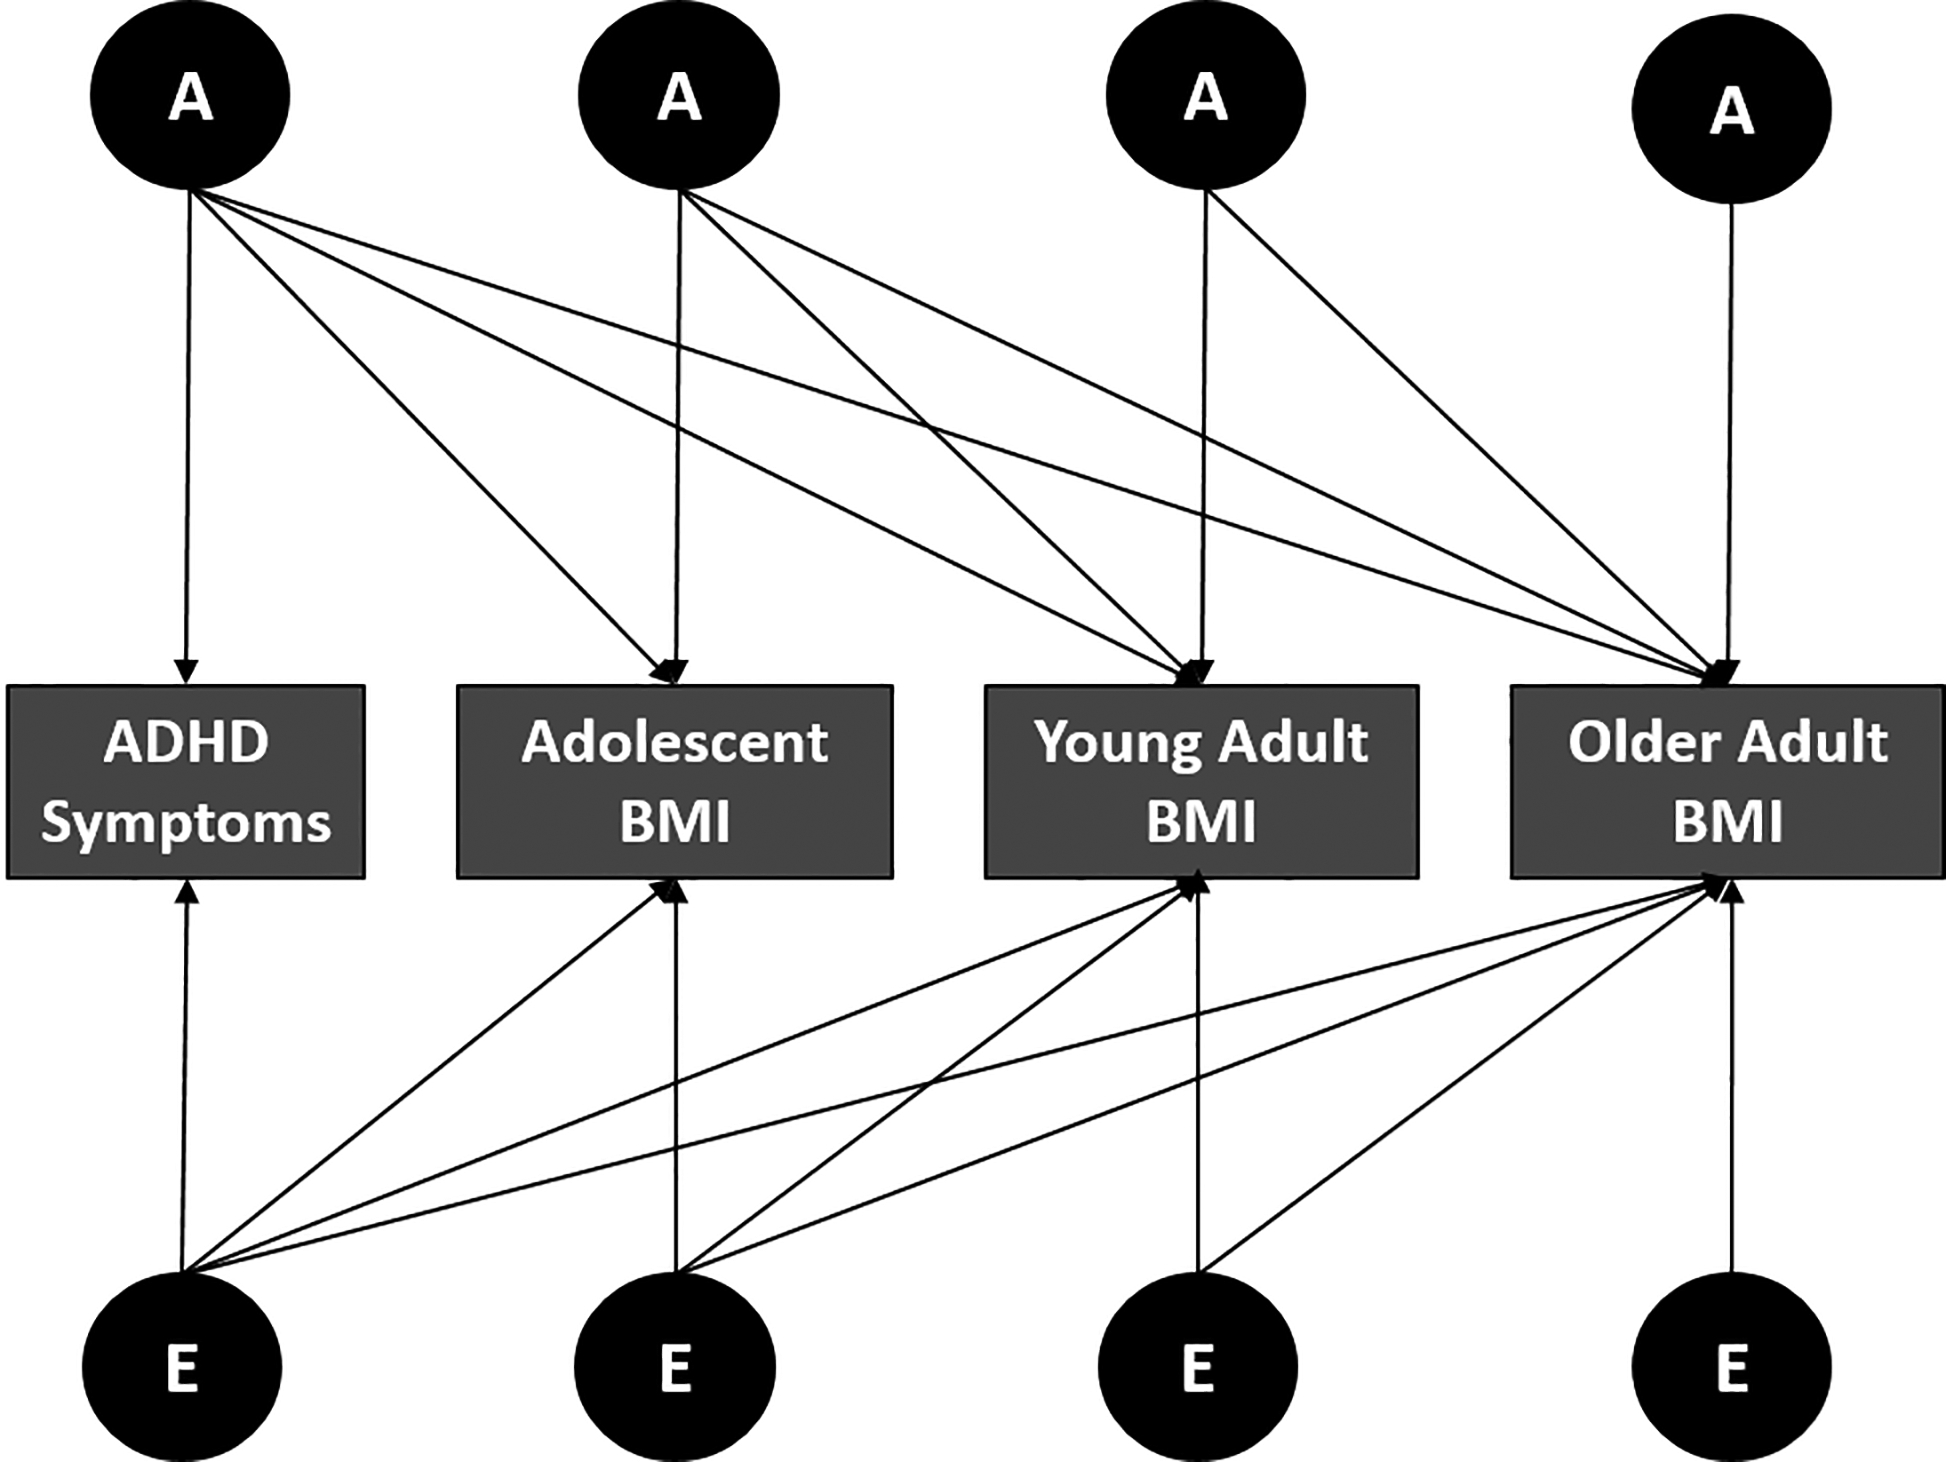
Multivariate Cholesky decomposition model for ADHD symptoms and BMI
Model fit for genetic models were evaluated using maximum-likelihood estimation. Similar to earlier work modeling independent genetic and environmental influences on ADHD symptoms31 and BMI24, the present analyses included additive genetic (A) and non-shared environmental (E) influences for each phenotype. Common environmental effects (C) were excluded, as previous studies have demonstrated that factors influencing BMI shared by family members present in childhood disappear by late adolescence49. The significance of model parameters was evaluated by a comparison of the twice log-likelihood (−2LL) for models with and without parameters, with the difference distributed as a chi-square distribution and the degrees of freedom being equal to the difference between the number of parameters estimated. A non-significant difference chi-square between two models indicates that the parameters dropped from the more parsimonious model were not significantly different from zero. Models were accepted on the basis of the Akaike Information Criteria (AIC) as calculated by subtracting twice the difference in the degrees of freedom from the difference chi-square between any particular model and the least parsimonious model considered. The AIC indexes the extent that a given model offers the most parsimonious, but adequate, explanation to the data50.
We also conducted post-hoc analyses to probe the relationship between ADHD symptoms and BMI further by investigating the relationship between symptoms for two ADHD subtypes (e.g. hyperactive-impulsive, HI and inattentive, IN) and BMI. First, we examined mean differences in ADHD symptomatology between males and females for symptoms of each ADHD subtype and calculating Cohen’s d to determine the magnitude of the difference in effect. Then, we used male-male and female-female twin pairs from the Add Health sample to conduct bivariate Cholesky decomposition models, with additive genetic (A) and non-shared environmental (E) factors.
Results
Sample characteristics.
Mean BMI and frequencies of underweight, average, overweight, and obesity during across adolescence (Wave II), young adulthood (Wave III), and adulthood (Wave IV) are provided in Table 1. Mean BMI values increased from 22.53 during adolescence to 28.65 during adulthood. Based on CDC growth rates during adolescence, 603 (15%) of participants were above the 85th percentile (the adolescent cut-point threshold of “overweight”) and 267 (6.8%) were above the 95th percentile (the adolescent cut-point threshold for “obese”). During young adulthood, n = 847 (26.2%) were overweight (BMI≥25) and n = 584 (18.1%) were obese (BMI ≥30). Both prevalence of overweight (n=1065, 31.6%) and obesity (n=1137, 33.7%) increased during adulthood.
Table 1.
Means (standard deviations) and frequency distributions of BMI during adolescence, young adulthood and adulthood.
| Underweight | Average | Overweight | Obese | ||
|---|---|---|---|---|---|
| Sex | Mean (SD)a | (N, %) | (N, %) | (N, %) | (N, %) |
| Adolescence (n = 3900) | |||||
| Males | 22.65 (4.08) | 188 (9.4) | 1352 (67.6) | 336 (16.8) | 125 (6.3) |
| Females | 22.40 (4.45) | 233 (12.3) | 1257 (66.2) | 267 (14.1) | 142 (7.5) |
| Young Adulthood (n = 3233) | |||||
| Males | 25.7 (5.08) | 34 (2.2) | 775 (49.3) | 492 (36.3) | 271 (17.2) |
| Females | 25.4 (6.16) | 71 (4.3) | 927 (55.6) | 355 (21.3) | 313 (18.8) |
| Adulthood (n = 3369) | |||||
| Males | 28.4 (6.54) | 15 (0.9) | 501 (30.9) | 591 (36.4) | 517 (31.8) |
| Females | 28.9 (7.83) | 27 (1.6) | 624 (35.8) | 474 (27.2) | 620 (35.5) |
Note: SD, standard deviation; N, sample size.
No significant differences between Males and Females during adolescence (t = −1.69, p = 0.092), young adulthood (t = −1.59, p = 0.11), and adulthood (t = −1.69, p = 0.09). For adolescence, weight categories are based on CDC age-gender adjusted percentile cut-points. For young adulthood and adulthood weight categories are based on CDC cut-points for BMI (kg/msq).
Latent genetic and environmental correlations for ADHD symptoms and BMI.
Male-male and female-female MZ and DZ twin pair correlations and male-female DZ and full-sibling (FS) correlations are shown in Table 2. In general, correlations for MZ male-male (MZM) and MZ female-female (MZF) twin pairs are greater than those for similar DZ male-male (DZM) and DZ female-female (DZF) twin pairs, indicating the importance of genetic influences contributing to ADHD symptoms present during childhood and BMI at adolescence, young adulthood and adulthood. For both ADHD symptoms and BMI, FS male-male (FSM) and FS female-female (FSF) correlations were slightly larger than half the MZM and FZF twin pair correlations, suggesting the possible importance of shared environmental factors contributing to both ADHD symptoms and BMI. The male-female DZ (OSDZ) and male-female FS (OSFS) correlations were smaller than those for the male-male and female-female twin pairs, suggesting the possibility that different heritable influences were impacting these phenotypes, for males and females.
Table 2.
Maximum likelihood correlations (95% Confidence Intervals) for childhood ADHD symptoms and BMI during adolescence, young adulthood, and adulthood by Zygosity.
| Zygosity | ADHD Symptoms | Adolescent BMI | Young Adult BMI | Adult BMI |
|---|---|---|---|---|
| Male-Male | ||||
| MZM | 0.42 (0.24 – 0.54) | 0.86 (0.80 – 0.91) | 0.80 (0.71 – 0.86) | 0.82 (0.76 – 0.88) |
| DZM | 0.32 (0.10 – 0.50) | 0.33 (0.10 – 0.53) | 0.33 (0.10 – 0.53) | 0.43 (0.09 – 0.62) |
| FSM | 0.24 (0.06 – 0.39) | 0.43 (0.28 – 0.55) | 0.42 (0.28 – 0.55) | 0.29 (0.15 – 0.42) |
| Female-Female | ||||
| MZF | 0.31 (0.11 – 0.48) | 0.82 (0.73 – 0.88) | 0.82 (0.73 – 0.88) | 0.89 (0.85 – 0.92) |
| DZF | 0.12 (−0.14 – 0.35) | 0.21 (−0.04 – 0.44) | 0.21 (−0.04 – 0.44) | 0.50 (0.33 – 0.63) |
| FSF | 0.13 (−0.02 – 0.27) | 0.45 (0.33 – 0.56) | 0.45 (0.33 – 0.56) | 0.44 (0.32 – 0.54) |
| Opposite Sibling (Male-Female) | ||||
| OSDZ | −0.04 (−0.22 −0.26) | 0.24 (0.05 – 0.42) | 0.24 (0.05 – 0.42) | 0.28 (0 08 – 0.44) |
| OSFS | −0.07 (−0.19 – 0.06) | 0.37 (0.26 – 0.48) | 0.37 (0.36 – 0.48) | 0.29 (0.17 – 0.40) |
Cholesky decomposition models.
Our baseline model included latent additive genetic (A) and non-shared environmental (E) factors. Quantitative sex differences in the genetic and environmental influences were tested by allowing A and E factors to be estimated separately for males and females. Qualitative sex differences were estimated by including a parameter that allowed a test of whether the same or different genes influenced ADHD symptoms and BMI. The fit of our baseline model was −2LL = 50671.81, df = 9046. Against our baseline model, results from sex-limited nested sub-models indicated that although the magnitude of genetic and environmental factors differed between males and females (−2LL = 52687, df = 9078, Δχ2 =2016.02, Δdf = 32, p > 0.001, AIC = 1952.02), the same genes were expressed in both sexes (−2LL = 50673.25, df = 9049, Δχ2 =1.43, Δdf = 3, p = 0.70, AIC = −4.57).
Models that tested the extent of overlap in A and E influences between ADHD symptoms and BMI revealed that, for males, all overlapping A influences could be dropped without a deterioration in model fit (−2LL = 50679.62, df = 9053, Δχ2 =7.81, Δdf = 6, p = 0.25, AIC = −4.19). For females, a model that dropped all overlapping A influences did result in a deterioration in model fit (−2LL = 50695.33, df = 9052, Δχ2 =13.52, Δdf = 6, p = 0.04, AIC = 1.52), but one that dropped overlapping E influences did not (−2LL = 50676.50, df = 9052, Δχ2 =4.68, Δdf = 6, p = 0.56, AIC = −7.32). A nested sub-model that dropped all overlapping genetic influences for males and females simultaneously resulted in a deterioration of model fit (−2LL = 50690, df = 9055, Δχ2 =18.32, Δdf = 9, p = 0.03, AIC = 0.321) where as one that dropped overlapping A influences for males but E influences for females did not (−2LL = 50683.21, df = 9055, Δχ2 =11.39, Δdf = 9, p = 0.25, AIC = −6.61). Judging by AIC, this final nested sub-model dropping overlapping A influences for males while retaining E influences for females was chosen as the best-fitting model of the data.
Estimates for additive genetic and non-shared environmental contributions to ADHD symptoms and BMI measures obtained from the best-fitting Cholesky decomposition models are shown on Table 3. Heritability estimates (a2) were greater for ADHD symptoms and BMI for males than they were for females, except for BMI in adulthood where females displayed a greater heritability estimate than males.
Table 3.
Parameter Estimates (95% Confidence Intervals) for the Additive Genetic and Non-Shared Environmental Contributions to ADHD symptoms and BMI during adolescence, young adulthood, and adulthood by Zygosity.
| Zygosity | ADHD Symptoms | Adolescent BMI | Young Adult BMI | Adult BMI |
|---|---|---|---|---|
| Males | ||||
| a2 | 0.40 (0.27 – 0.52) | 0.85 (0.79 – 0.89) | 0.82 (0.76 – 0.87) | 0.76 (0.67 – 0.82) |
| e2 | 0.60 (0.48 – 0.73) | 0.15 (0.11 – 0.21) | 0.18 (0.13 – 0.24) | 0.24 (0.18 – 0.33) |
| Females | ||||
| a2 | 0.21 (0.08 – 0.36) | 0.75 (0.68 – 0.80) | 0.78 (0.72 – 0.83) | 0.89 (0.84 – 0.91) |
| e2 | 0.79 (0.64 – 0.92) | 0.25 (0.20 – 0.32) | 0.22 (0.17 – 0.29) | 0.11 (0.09 – 0.16) |
Note: a2, total additive genetic influence; e2, total non-shared environmental influence.
When looking at genetic and environmental correlations for ADHD symptoms and BMI during adolescence, young adulthood, and later adulthood in Table 4, we find that non-shared environmental influences were notable for both sexes, suggesting a strong influence of the environment (plus measurement error) on ADHD symptoms. Additionally, genetic correlations for BMI within males and females were >0.80, demonstrating a strong continuity of heritable influences on BMI from adolescence (11–18 years old) through to adulthood (28–34 years old). However, the etiological relationship between childhood ADHD symptoms and BMI at three developmental periods appears to differ between males and females, whereby the relationship is influenced by non-shared environmental factors within males, and additive genetic factors within females.
Table 4.
Genetic and Environmental Correlations (95% Confidence Intervals) for ADHD Symptoms and BMI During Adolescence, Young Adulthood, and Adulthood for Males and Females
| ADHD Symptoms | Adolescent BMI | Young Adult BMI | Adult BMI | |
|---|---|---|---|---|
| MALES | ||||
| ADHD symptoms | -- | -- | -- | |
| BMI – Adolescence | 0.19 (0.06 – 0.32) | 0.87 (0.82 – 0.90) | 0.81 (0.74 – 0.87) | |
| BMI – Young Adulthood | 0.16 (0.03 – 0.29) | 0.40 (0.23 – 0.55) | 0.95 (0.91 – 0.99) | |
| BMI – Adulthood | 0.19 (0.07 – 0.30) | 0.23 (0.02 – 0.43) | 0.30 (0.13 – 0.47) | |
| FEMALES | ||||
| ADHD Symptoms | 0.20 (0.07 – 0.36) | 0.24 (0.10 – 0.41) | 0.24 (0.11 – 0.41) | |
| BMI – Adolescence | -- | 0.96 (0.93 – 0.99) | 0.88 (0.83 – 0.92) | |
| BMI – Young Adulthood | -- | 0.39 (0.26 – 0.51) | 0.91 (0.88 – 0.95) | |
| BMI – Adulthood | -- | 0.18 (−0.02 – 0.38) | 0.38 (0.21 – 0.54) | |
Note: Shown are genetic correlations in the upper shaded cells, and unique environmental correlations in the lower unshaded cells for both males and females. No genetic correlation between ADHD and BMI was found within males; as such, it was removed (e.g. set to 0) in the final model (demarcated by --). No unique environmental influences between ADHD and BMI were found within females; a such, it was removed (e.g. set to 0) in the final model (demarcated by --).
To probe the relationship between ADHD symptoms and BMI further, we examined mean differences in ADHD symptomatology between males and females, by symptoms ADHD subtypes (e.g. HI and IN). Significant mean differences in symptoms for IN and HI subtypes were found between males and females, such that males have a higher mean symptom count for both IN and HI subtypes (Inattentive symptoms: mean (SD) = 1.3 (1.9) for males, 0.9 (1.6) for females; Cohen’s d = 0.22; hyperactive symptoms: mean (SD) = 1.8 (1.8) for males, 1.4 (1.4) for females; Cohen’s d = 0.25). However, the effect is small according to Cohen’s d.
Post-hoc analyses using a bivariate Cholesky decomposition model with additive genetic and non-shared environmental components (e.g. AE model) applied to male-male and female-female twin pairs from the Add Health sample indicate that the relationship between IN symptoms and BMI may be more genetically influenced in females, relative to males, and that there might not be a difference in genetic influence over the relationship between HI symptoms and BMI by sex. Specifically, the genetic correlation between symptoms for IN and BMI ranged between 0.10 in adolescence to 0.25 in adulthood for females, and between 0.00 in adolescence and 0.07 in adulthood for males. Meanwhile, the genetic correlation between symptoms for HI and BMI ranged between 0.08 in adolescence and 0.25 in adulthood for both males and females.
Discussion
Clinical observations have suggested that childhood ADHD symptoms may share an etiological relationship with BMI at later ages. To investigate this possibility, we examined the extent that genetic and environmental influences on childhood ADHD symptoms and BMI during adolescence, young adulthood, and later adulthood overlapped or were distinct within a population-based sample. We also examined the possibility for sex differences in the overall magnitude of heritable and environmental influences, as well as whether the same or different genes influenced the association between ADHD symptoms and BMI.
Our results demonstrate that adult BMI is stable over time from adolescence through adulthood, and individual variance in BMI is largely accounted for by additive genetic influences. In the current study, genetic correlations between BMI in adolescence, young adulthood, and later adulthood are >0.80, consistent with estimates ranging from 61.7%−86.5% in a study conducted by Ortega-Alonso (2011)51. Genetic correlations between measures of BMI are also similar across males and females, suggesting that there are not sex differences in the overall magnitude of heritable influences on BMI within this sample.
Unfortunately, we are unable to determine if ADHD symptoms are also stable over time, since serial assessments were not conducted within the Add Health sample. For this reason, we only investigated the relationship between retrospective self-report of childhood ADHD symptoms and measures of BMI. We acknowledge that it is possible that contributions of genetic and environmental influences may differ across the lifespan; thus, genetic correlations between retrospective self-reported childhood ADHD symptoms and later measures of BMI must be interpreted within this particular limitation of the data.
To date, one longitudinal population-based study of patients with childhood ADHD and non-ADHD controls finds that childhood ADHD was associated with obesity during childhood and young adulthood, within females only22. The results of that study are in line with those of a birth cohort – based prospective study from the Netherlands, which also shows that the association between ADHD and obesity in girls is age-dependent, with the strongest association from age 10–12 years52. While other studies do find associations between ADHD and obesity in males6,53, mixed results related to sex differences in the association between ADHD and obesity could be attributed to study methodologies used by the different studies (e.g. population sample characteristics, diagnostic criteria, etc.)12. In line with these previously conducted studies, results from our study demonstrate that ADHD symptoms and BMI are associated in adolescence through adulthood.
It has been hypothesized that the association between ADHD symptoms and measures of obesity, such as BMI, may reflect shared underlying abnormalities in neural dopaminergic pathways mediating impulse control, reward sensitivity, appetite, and satiety22. For example, individuals with ADHD symptomatology may experience reward deficiency syndrome, as a consequence of low tonic dopamine levels in the prefrontal cortex. The prefrontal cortex is associated with working memory, and is thought to contribute to why individuals with ADHD have problems in sustaining attention during tasks54. Thus, food-related increases in dopamine among individuals with ADHD may be experienced as rewarding, and might be reinforcing, if it addresses relative dopamine deficiencies in the prefrontal cortex55,56. Additionally, those with poor inhibitory control or chronically low levels of dopamine in the pre-frontal cortex may be prone to overeating, which can then lead to obesity57. Other potential mechanisms that require testing include: poor planning associated with deficient inhibitory control and aversion to delay with the potential to lead to increased food consumption58.
Sex differences in associated comorbidities might explain why the etiology of the association between ADHD symptoms and BMI is different for males and females. For example, it has been found that higher food reinforcement is an important contributor to obesity among females and suggests that the reduction of food reinforcement through attention modification training or food cue extinction may be important for reducing obesity among females who are prone to food reinforcement59. Additionally, higher rates of comorbid conditions, such as depression, anxiety, and eating disorders, are found within females with ADHD and may contribute to habits predisposing girls to excess weight gain. Meanwhile, increased resting energy expenditure found within boys with HI symptoms of ADHD may be protective against obesity22. Further research is needed to explore sex differences in the association between ADHD and obesity, especially given the potential implications sex differences may have on the treatment of obesity among males and females with ADHD.
Our study builds upon this existing literature by focusing on how genetic factors might influence the association between ADHD symptoms and BMI. Specifically, we find that the same genetic factors (e.g. genes being expressed) are influencing ADHD symptoms and BMI in males and females, and that the etiological relationship between ADHD symptoms and BMI from adolescence through adulthood appear to differ for males and females. Specifically, within females, genetic factors influencing ADHD symptoms and BMI are partially shared (e.g. between 4–6%). Further, genetic correlations between ADHD symptoms and BMI at the various developmental ages ranged from 0.20 to 0.24, with stronger associations found in adulthood, compared to adolescence, within females. This is not the case for males, where the genetic correlations between ADHD symptoms and BMI were not significantly different from zero – suggesting that genetic factors predisposing individuals to ADHD symptoms and obesity are differentially expressed in males and females. In other words, some of the same genetic factors influencing ADHD symptoms and BMI in females, might be differentially expressed in males, possibly contributing to levels of hyperactivity. Thus, both the relationship between ADHD symptoms and BMI, and the influence of genetic factors contributing to ADHD symptoms and BMI, may differ according to sex.
Differences in the influence of genetic factors on the association between ADHD symptoms and BMI by sex could mean that either some genes predisposing individuals to ADHD are sex-linked, or that the expression of ADHD varies between the sexes. Since the statistical models used in this study could not be used to determine whether these genes were sex-linked, we sought to explore how the expression of ADHD might vary between the sexes according to differences in ADHD subtype. Results from our post-hoc analyses suggest that the genetic correlation between symptoms for inattention and BMI is stronger in females than in males, while the genetic correlation between symptoms for hyperactivity-impulsivity and BMI is the same for males and females. Thus, identifying specific genes contributing to symptoms of ADHD (and its subtypes) and BMI might be useful in the development of future intervention and prevention strategies.
Although we were unable to test the effects of specific genes on this association within the present study, one previously conducted study examining whether risk alleles for an increased BMI are associated with ADHD and related quantitative traits (e.g. inattention and hyperactivity/impulsivity), identifies two obesity risk alleles with ADHD [e.g. rs206936 in the NUDT3 gene (i.e. nudix; nucleoside diphosphate linked moiety X-type motif); rs6497416 in the intronic region of the GPRC5B gene]. Additionally, rs10938397 in the glucosamine-6-phosphate deaminase 2 gene (GNPDA2) are associated with inattention, while markers in mitogen-activated protein kinase 5 gene (MAP2K5) and the cell adhesion molecule 2 gene (CADM2) are associated with hyperactivity. This study suggests an overlap in the polygenic predisposition between obesity and ADHD that requires further research to elucidate the common genetic background of ADHD and obesity60.
Results of this study should be evaluated in light of certain study limitations. First, this data relies heavily on self-reported measures. This gives rise to potential self-report bias, as individuals with ADHD may not recall symptoms or choose to under-report symptoms, and brings into question the stability of symptom reporting across time. The use of a second reporter would have been helpful to validate individual responses. Additionally, self-report bias can lead to decreased heritability estimates (A) and increased contributions of unique environment, paired with measurement error (E)61. Given this limitation, it is possible that self-report bias contributing to ADHD symptoms might have affected our results in varying levels at different ages, when looking at the association between ADHD symptoms and BMI. Second, since we are utilizing a sibling/twin modeling design, we are unable to parameterize the effects of epigenetic, interactions between genetic and environmental factors, and assortative mating which can increase DZ twin phenotypic correlations and/or conceal the presence of dominant genetic effects, while increasing the possibility of observing additive genetic effects62. The extension of the twin model design is able to disentangle such effects, but requires information from other family members with varying degrees of relatedness (e.g. aunts/uncles, cousins, etc.). Third, despite utilizing a large national probability sample, we were unable to determine how associations between ADHD symptoms and BMI measures across adolescence and adulthood differed by race/ethnicity due to limitations in available sibling/twin pair sub-samples. However, it would be useful to know how generalizable results are; thus, future research requires larger, and more diverse samples. Further, although there is high overlap of ADHD symptoms with different psychological disorders, we did not account for this in our analyses. Future studies could be conducted to disentangle how this overlap affects the association between ADHD symptoms and BMI over time.
Despite these limitations, we were able to demonstrate evidence for shared heritability between ADHD symptoms and BMI at different developmental stages. Additionally, our findings support those previously published, suggesting that the etiological factors influencing the association between ADHD and BMI may differ by sex. Future research is needed to identify the potential mechanisms by which these sex differences can be explained – such as alterations in the dopaminergic system and its association with specific ADHD symptoms, such as inattention and hyperactive-impulsivity, and subsequent influences on dietary behavior, which influence BMI and risk for obesity.
Acknowledgements:
This research uses data from Add Health, a program project directed by Kathleen Mullan Harris and designed by J. Richard Udry, Peter S. Bearman, and Kathleen Mullan Harris at the University of North Carolina at Chapel Hill, and funded by grant P01-HD31921 from the Eunice Kennedy Shriver National Institute of Child Health and Human Development, with cooperative funding from 23 other federal agencies and foundations. Special acknowledgment is due Ronald R. Rindfuss and Barbara Entwisle for assistance in the original design. Information on how to obtain the Add Health data files is available on the Add Health website (http://www.cpc.unc.edu/addhealth). No direct support was received from grant P01-HD31921 for this analysis. Additional support was provided by P01-HL36587 and Duke Behavioral Medicine Research Center.
Footnotes
Conflict of Interest Statement: The authors declare no conflict of interest.
References
- 1.World Health Organization. Obesity and Overweight, Fact Sheet No. 311 (2006).
- 2.Qi L & Cho YA Gene-environment interaction and obesity. Nutr. Rev 66, 684–694 (2008). [DOI] [PMC free article] [PubMed] [Google Scholar]
- 3.Lyon HN & Hirschhorn JN Genetics of common forms of obesity: a brief overview. Am. J. Clin. Nutr 82, 215S–217S (2005). [DOI] [PubMed] [Google Scholar]
- 4.Frayling TM, Timpson NJ, Weedon MN, Zeggini E Freathy RM, Lindgren CM et al. A common variant in the FTO gene is associated with body mass index and predisposes to childhood and adult obesity. Science 316, 889–894 (2007). [DOI] [PMC free article] [PubMed] [Google Scholar]
- 5.Cortese S, Angriman M, Maffeis C, Isnard P, Konofal E, Lecendreux M et al. Attention-deficit/hyperactivity disorder (ADHD) and obesity: a systematic review of the literature. Crit. Rev. Food Sci. Nutr 48, 524–537 (2008). [DOI] [PubMed] [Google Scholar]
- 6.Cortese S, Olazagasti R, Klein RG, Castellanos FX, Proal E, & Mannuzza S Obesity in Men With Childhood ADHD: A 33-Year Controlled, Prospective, Follow-up Study. Pediatrics peds.2012-0540 (2013). doi: 10.1542/peds.2012-0540 [DOI] [PMC free article] [PubMed] [Google Scholar]
- 7.Cortese S, Faraone SV, Bernardi S, Wang S & Blanco C Adult attention-deficit hyperactivity disorder and obesity: epidemiological study. Br. J. Psychiatry J. Ment. Sci 203, 24–34 (2013). [DOI] [PMC free article] [PubMed] [Google Scholar]
- 8.Schwartz BS, Bailey-Davis L, Bandeen-Roche K, Pollak J, Hirsch AG, Nau C et al. Attention Deficit Disorder, Stimulant Use, and Childhood Body Mass Index Trajectory. Pediatrics peds.2013-3427 (2014). doi: 10.1542/peds.2013-3427 [DOI] [PMC free article] [PubMed] [Google Scholar]
- 9.Dubnov-Raz G, Perry A & Berger I Body mass index of children with attention-deficit/hyperactivity disorder. J. Child Neurol 26, 302–308 (2011). [DOI] [PubMed] [Google Scholar]
- 10.Hanć T, Slopien A, Wolanczyk T, Dmitrzak-Welgarz M, Szwed A, Czapala Z, Durda M et al. ADHD and overweight in boys: cross-sectional study with birth weight as a controlled factor. Eur. Child Adolesc. Psychiatry 24, 41–53 (2015). [DOI] [PMC free article] [PubMed] [Google Scholar]
- 11.Newman DL, Moffitt TE, Caspi A & Silva PA Comorbid mental disorders: implications for treatment and sample selection. J. Abnorm. Psychol 107, 305–311 (1998). [DOI] [PubMed] [Google Scholar]
- 12.Pagoto SL, Curtin C, Lemon SC, Bandini LG, Schneider KL, Bodenlos JS, & Ma Y Association Between Adult Attention Deficit/Hyperactivity Disorder and Obesity in the US Population. Obes. Silver Spring Md 17, 539–544 (2009). [DOI] [PMC free article] [PubMed] [Google Scholar]
- 13.Fuemmeler BF, Østbye T, Yang C, McClernon FJ & Kollins SH Association between attention-deficit/hyperactivity disorder symptoms and obesity and hypertension in early adulthood: a population-based study. Int. J. Obes 2005 35, 852–862 (2011). [DOI] [PMC free article] [PubMed] [Google Scholar]
- 14.van Egmond-Fröhlich AWA, Widhalm K & de Zwaan M Association of symptoms of attention-deficit/hyperactivity disorder with childhood overweight adjusted for confounding parental variables. Int. J. Obes 2005 36, 963–968 (2012). [DOI] [PubMed] [Google Scholar]
- 15.Khalife N, Kantomaa M, Glover V, Tammelin T, Laitinen J, Ebeling H et al. Childhood attention-deficit/hyperactivity disorder symptoms are risk factors for obesity and physical inactivity in adolescence. J. Am. Acad. Child Adolesc. Psychiatry 53, 425–436 (2014). [DOI] [PubMed] [Google Scholar]
- 16.Blum K, Braverman ER, Holder JM, Lubar JF, Monastra VJ Miller D et al. Reward deficiency syndrome: a biogenetic model for the diagnosis and treatment of impulsive, addictive, and compulsive behaviors. J. Psychoactive Drugs 32 Suppl, i–iv, 1–112 (2000). [DOI] [PubMed] [Google Scholar]
- 17.Cortese S, Isnard P, Frelut ML, Quantin L, Guedeney A, Falissard B et al. Association between symptoms of attention-deficit/hyperactivity disorder and bulimic behaviors in a clinical sample of severely obese adolescents. Int. J. Obes 2005 31, 340–346 (2007). [DOI] [PubMed] [Google Scholar]
- 18.Pauli-Pott U, Albayrak Ö, Hebebrand J & Pott W Association between Inhibitory Control Capacity and Body Weight in Overweight and Obese Children and Adolescents: Dependence on Age and Inhibitory Control Component. Child Neuropsychol 16, 592–603 (2010). [DOI] [PubMed] [Google Scholar]
- 19.Volkow ND, Wang G-J, Tomasi D & Baler RD Obesity and addiction: neurobiological overlaps. Obes. Rev 14, 2–18 (2013). [DOI] [PMC free article] [PubMed] [Google Scholar]
- 20.Davis C, Levitan RD, Smith M, Tweed S & Curtis C Associations among overeating, overweight, and attention deficit/hyperactivity disorder: a structural equation modelling approach. Eat. Behav 7, 266–274 (2006). [DOI] [PubMed] [Google Scholar]
- 21.Nigg JT, Johnstone JM, Musser ED, Long HG, Wiloughby MT, & Shannon J Attention-Deficit/Hyperactivity Disorder (ADHD) and Overweight/Obesity: New Data and Meta-Analysis. Clin. Psychol. Rev 43, 67 (2016). [DOI] [PMC free article] [PubMed] [Google Scholar]
- 22.Castaneda RLA, Kumar S, Voight RG, Leibson CL, Barbaresi WJ, Weaver AL et al. Childhood ADHD, Sex and Obesity: a Longitudinal Population-based Study. Mayo Clin. Proc 91, 352–361 (2016). [DOI] [PMC free article] [PubMed] [Google Scholar]
- 23.Cornes BK, Zhu G & Martin NG Sex differences in genetic variation in weight: a longitudinal study of body mass index in adolescent twins. Behav. Genet 37, 648–660 (2007). [DOI] [PubMed] [Google Scholar]
- 24.Haberstick BC, Leseem JM, McQueen MB, Boardman JD, Hopfer CJ, Smolen A et al. Stable Genes and Changing Environments: Body Mass Index Across Adolescence And Young Adulthood. Behav. Genet 40, 495–504 (2010). [DOI] [PMC free article] [PubMed] [Google Scholar]
- 25.Schousboe K, Willemsen G, Kyvik KO, Mortensen J, Boomsma DI, Cornes BK et al. Sex differences in heritability of BMI: a comparative study of results from twin studies in eight countries. Twin Res. Off. J. Int. Soc. Twin Stud 6, 409–421 (2003). [DOI] [PubMed] [Google Scholar]
- 26.Maes HH, Neale MC & Eaves LJ Genetic and environmental factors in relative body weight and human adiposity. Behav. Genet 27, 325–351 (1997). [DOI] [PubMed] [Google Scholar]
- 27.Pietiläinen KH, Kaprio J, Räsänen M, Rissanen A & Rose RJ Genetic and Environmental Influences on the Tracking of Body Size from Birth to Early Adulthood. Obes. Res 10, 875–884 (2002). [DOI] [PubMed] [Google Scholar]
- 28.Pietiläinen KH, Kaprio J, Rissanen A, Winter T, Rimpela A, Viken RJ et al. Distribution and heritability of BMI in Finnish adolescents aged 16y and 17y: a study of 4884 twins and 2509 singletons. Int. J. Obes. Relat. Metab. Disord. J. Int. Assoc. Study Obes 23, 107–115 (1999). [DOI] [PubMed] [Google Scholar]
- 29.Wardle J, Carnell S, Haworth CM & Plomin R Evidence for a strong genetic influence on childhood adiposity despite the force of the obesogenic environment. Am. J. Clin. Nutr 87, 398–404 (2008). [DOI] [PubMed] [Google Scholar]
- 30.Franz CE, Grant MD, Jacobson KC, Kremen WS, Eisen SA, Xian H et al. Genetics of body mass stability and risk for chronic disease: a 28-year longitudinal study. Twin Res. Hum. Genet. Off. J. Int. Soc. Twin Stud 10, 537–545 (2007). [DOI] [PubMed] [Google Scholar]
- 31.Haberstick BC, Timberlake D, Hopfer CJ, Lessem JM, Ehringer MA, & Hewitt JK Genetic and environmental contributions to retrospectively reported DSM-IV childhood attention deficit hyperactivity disorder. Psychol. Med 38, 1057–1066 (2008). [DOI] [PubMed] [Google Scholar]
- 32.Rhee SH, Waldman ID, Hay DA & Levy F Sex differences in genetic and environmental influences on DSM–III–R attention-deficit/hyperactivity disorder. J. Abnorm. Psychol 108, 24–41 (1999). [DOI] [PubMed] [Google Scholar]
- 33.Rietveld MJH, Hudziak JJ, Bartels M, van Beijsterveldt CEM & Boomsma DI Heritability of attention problems in children: longitudinal results from a study of twins, age 3 to 12. J. Child Psychol. Psychiatry 45, 577–588 (2004). [DOI] [PubMed] [Google Scholar]
- 34.Ehringer MA, Rhee SH, Young S, Corley R & Hewitt JK Genetic and environmental contributions to common psychopathologies of childhood and adolescence: a study of twins and their siblings. J. Abnorm. Child Psychol 34, 1–17 (2006). [DOI] [PubMed] [Google Scholar]
- 35.Harris KM, Halpern CT, Haberstick BC & Smolen A The National Longitudinal Study of Adolescent Health (Add Health) Sibling Pairs Data. Twin Res. Hum. Genet. Off. J. Int. Soc. Twin Stud 16, 391–398 (2013). [DOI] [PMC free article] [PubMed] [Google Scholar]
- 36.Harris KM, Halpern CT, Smolen A & Haberstick BC The National Longitudinal Study of Adolescent Health (Add Health) Twin Data. Twin Res. Hum. Genet 989–997 (2006). [DOI] [PubMed] [Google Scholar]
- 37.Harris KM Design features of Add Health (Carolina Population Center, University of North Carolina at Chapel Hill; ). [Google Scholar]
- 38.Barkley RA & Murphy KR Attention-deficit hyperactivity disorder: A clinical workbook (Guilford Press; ). [Google Scholar]
- 39.Murphy K & Barkley RA Attention deficit hyperactivity disorder adults: comorbidities and adaptive impairments. Compr. Psychiatry 37, 393–401 (1996). [DOI] [PubMed] [Google Scholar]
- 40.Fuemmeler BF, Kollins SH & McClernon FJ Attention deficit hyperactivity disorder symptoms predict nicotine dependence and progression to regular smoking from adolescence to young adulthood. J. Pediatr. Psychol 32, 1203–1213 (2007). [DOI] [PubMed] [Google Scholar]
- 41.Kollins SH, McClernon FJ & Fuemmeler BF Association between smoking and attention-deficit/hyperactivity disorder symptoms in a population-based sample of young adults. Arch. Gen. Psychiatry 62, 1142–1147 (2005). [DOI] [PubMed] [Google Scholar]
- 42.Epstein JN & Kollins SH Psychometric properties of an adult ADHD diagnostic interview. J. Atten. Disord 9, 504–514 (2006). [DOI] [PubMed] [Google Scholar]
- 43.Murphy P & Schachar R Use of Self-Ratings in the Assessment of Symptoms of Attention Deficit Hyperactivity Disorder in Adults. Am. J. Psychiatry 157, 1156–1159 (2000). [DOI] [PubMed] [Google Scholar]
- 44.Stein MA, Sandoval R, Szumowski E, Roizen N, Reinecke MA, Blondis TA et al. Psychometric characteristics of the Wender Utah Rating Scale (WURS): reliability and factor structure for men and women. Psychopharmacol. Bull 31, 425–433 (1995). [PubMed] [Google Scholar]
- 45.Ward MF, Wender PH & Reimherr FW The Wender Utah Rating Scale: an aid in the retrospective diagnosis of childhood attention deficit hyperactivity disorder. Am. J. Psychiatry 150, 885–890 (1993). [DOI] [PubMed] [Google Scholar]
- 46.Zucker M, Morris MK, Ingram SM, Morris RD & Bakeman R Concordance of self- and informant ratings of adults’ current and childhood attention-deficit/hyperactivity disorder symptoms. Psychol. Assess 14, 379–389 (2002). [DOI] [PubMed] [Google Scholar]
- 47.Neale MC & Cardon LR Methodology for the genetic study of twins and families (Kluwer; ). [Google Scholar]
- 48.Neale MC, Boker SM, Xie G & Maes H Mx: Statistical Modeling (Department of Psychiatry, VCU, 1999). [Google Scholar]
- 49.Lajunen H-R et al. GENETIC AND ENVIRONMENTAL EFFECTS ON BODY MASS INDEX DURING ADOLESCENCE: A PROSPECTIVE STUDY AMONG FINNISH TWINS. Int. J. Obes 2005 33, 559–567 (2009). [DOI] [PMC free article] [PubMed] [Google Scholar]
- 50.Akaike H Factor analysis and AIC. Psychometrika 52, 317–332 (1987). [Google Scholar]
- 51.Ortega-Alonso A, Pietiläinen KH, Silventoinen K, Saarni SE & Kaprio J Genetic and Environmental Factors Influencing BMI Development from Adolescence to Young Adulthood. Behav. Genet 42, 73–85 (2012). [DOI] [PubMed] [Google Scholar]
- 52.Fliers EA, Buitelaar JK, Maras A, Bul K, Hohle E, Faraone SV et al. ADHD is a risk factor for overweight and obesity in children. J Dev Behav Pediatr 34, 566–574 (2013). [DOI] [PMC free article] [PubMed] [Google Scholar]
- 53.Kim J, Mutyala B, Agiovlasitis S & Fernhall B Health behaviors and obesity among US children with attention deficit hyperactivity disorder by gender and medication use. Prev. Med 52, 218–222 (2011). [DOI] [PubMed] [Google Scholar]
- 54.Comings DE & Blum K Reward deficiency syndrome: genetic aspects of behavioral disorders. Prog. Brain Res 126, 325–341 (2000). [DOI] [PubMed] [Google Scholar]
- 55.Volkow ND, Wang GJ, Fowler JS, Logan J, Jayne M Franceschi D et al. ‘Nonhedonic’ food motivation in humans involves dopamine in the dorsal striatum and methylphenidate amplifies this effect. Synap. N. Y. N 44, 175–180 (2002). [DOI] [PubMed] [Google Scholar]
- 56.Volkow ND, Wang GJ, Maynard L, Jayne M, Fowler JS, Zhu W et al. Brain dopamine is associated with eating behaviors in humans. Int. J. Eat. Disord 33, 136–142 (2003). [DOI] [PubMed] [Google Scholar]
- 57.Campbell BC & Eisenberg D Obesity, Attention Deficit-Hyperactivity Disorder, and the Dopaminergic Reward System. Coll Antropol 31, 315–319 (2007). [PubMed] [Google Scholar]
- 58.Baird J, Stevenson JC & Williams DC The evolution of ADHD: a disorder of communication? Q. Rev. Biol 75, 17–35 (2000). [DOI] [PubMed] [Google Scholar]
- 59.Gearhardt AN, Miller AL, Sturza J, Epstein LH, Kaciroti N & Lumeng JC Behavioral Associations with Overweight in Low-Income Children. Pediatr. Obes 25, 2123–2127 [DOI] [PMC free article] [PubMed] [Google Scholar]
- 60.Albayrak Ö, Putter C, Volckmar AL, Chichon S, Hoffmann P, Nothen MM et al. Common obesity risk alleles in childhood attention-deficit/hyperactivity disorder. Am. J. Med. Genet. B Neuropsychiatr. Genet 162, 295–305 (2013). [DOI] [PubMed] [Google Scholar]
- 61.Macgregor S, Cornes BK, Martin NG & Visscher PM Bias, precision and heritability of self-reported and clinically measured height in Australian twins. Hum. Genet 120, 571–580 (2006). [DOI] [PubMed] [Google Scholar]
- 62.Posthuma D, Beem AL, de Geus EJ, van Baal GC, von Hjelmborg JB, Iachine I et al. Theory and practice in quantitative genetics. Twin Res. Off. J. Int. Soc. Twin Stud 6, 361–376 (2003). [DOI] [PubMed] [Google Scholar]