Abstract
Photoacoustic endoscopy (PAE) is an emerging imaging modality, which offers a high imaging penetration and a high optical contrast in soft tissue. Most of the developed endoscopic photoacoustic sensing systems use miniaturized contact ultrasound transducers or complex optical approaches. In this work, a new fiber‐based detection technique using speckle analysis for contact‐free signal detection is presented. Phantom and ex vivo experiments are performed in transmission and reflection mode for proof of concept. In summary, the potential of the technique for endoscopic photoacoustic signal detection is demonstrated. The new technique might help in future to broaden the applications of PAE in imaging or guiding minimally invasive laser procedures.
Keywords: laser surgery, photoacoustic endoscopy, remote sensing, speckle
A new fiber based detection technique for photoacoustic endoscopy using speckle‐analysis for contact‐free signal detection is presented. The new technique might help in future to broaden photoacoustic applications in imaging or guiding minimally invasive laserprocedures.
1. INTRODUCTION
The emerging hybrid imaging modality photoacoustic endoscopy (PAE) offers several advantages compared to other endoscopic tomographic modalities which makes it attractive for minimally invasive applications. Based on the absorption of a short light pulse, the acoustic signal generation of PAE enables an enhanced imaging contrast in soft tissue compared to ultrasound (US) depending purely on the absorption properties of the biological matter 1. This fact together with the speckle‐noise‐free nature of photoacoustic images result in a higher image quality compared to US. In addition, PAE is also advantageous compared to miniature, purely optical imaging methods regarding penetration depth. Since ballistic and also multiply scattered photons generate an acoustic signal, PAE can overcome the quasi‐ballistic regime for imaging 2. Together with the fact that acoustic scattering in soft tissue is about two to three orders of magnitude lower than optical scattering, high imaging depths can be achieved using PAE 3. Thus, it is possible to achieve penetration depths of about several centimeters using photoacoustic imaging 4. In comparison, purely optical modalities like multiphoton microscopy and optical coherence tomography (OCT) are limited to a penetration depth below 2 mm 5, 6. The speckle‐free, optical modality Diffuse Optical Tomography is also capable of achieving penetration depths in the centimeter range. However, it provides only a low resolution and it is difficult to establish the modality in an endoscopic system 7, 8. In contrast to that, PAE has an excellent spatial image resolution which can be scaled by changing the ultrasonic detection bandwidth 9.
At the moment miniaturized piezoelectric contact transducers are used for acoustic signal detection for most of the PAE systems. Several research groups place this miniaturized transducer together with the optical fiber which delivers the photoacoustic excitation light pulse at the distal tip. Yang et al. developed a transducer with a hole in the center for excitation light delivery 10, 11. A special coating of silver epoxy and a liquid deposit in the endoscopic tip ensures good acoustic coupling. Yuan et al. use a similar solution with a ring transducer for rotational acoustic signal detection which demands again an acoustic coupling medium 12. Other groups combined the light delivery fiber and the transducer by placing them next to each other in one system 13, 14, 15. Furthermore, it is also possible to place the transducer on top of the optical fiber 16, 17. Ji et al. symmetrically placed two transducers next to the delivered light pulse 18.
These examples prove that the transducer usage complicates the design of the endoscopic tip due to its size and opaque nature. Furthermore, the imaging capabilities are limited since the endoscopic probes based on miniaturized transducers only allow rotational scanning and thus side‐views. As a consequence, forward‐view which might be beneficial for guiding minimally invasive surgical procedures or special imaging applications is not possible. In addition, these transducers require contact or good impedance matching which results in a view obstruction. One more disadvantage is also the limited bandwidth of US transducers leading to a loss in signal quality.
There are also purely optical detection methods which can overcome the mentioned problems of the contact transducers partly. There are two methods for optical US detection: refractometry and interferometry 19. Refractometric approaches however require an interacting medium in order to measure refractive index changes due to the acoustic signal and are thus difficult to implement in an endoscopic system. Interferometry is capable of detecting an US signal by measuring changes of interference patterns. Blatter et al. demonstrated noncontact optical photoacoustic detection using intrasweep phase‐sensitive OCT 20. Since this system allows remote photoacoustic sensing, it does not require impedance coupling. However, the setup is complicated and speckle‐noise might influence the signal quality. Hochreiner et al. successfully detected the photoacoustic signal remotely using a fiber‐based Mach Zehnder interferometer 21. However, the photoacoustic detection system was not completely integrated into one probe and the interferometric detection is complicated and noise‐sensitive. Dong et al. placed a fiber‐based microring resonator directly at the exit window of the excitation beam for acoustic detection 22. For this setup, a high detection bandwidth (250 MHz) can be achieved which is only dependent on the electronics. However, no forward‐viewing possibilities are provided by this probe design. Zhang et al. designed a side‐viewing miniature all‐optical photoacoustic imaging probe based on a Fabry Perot US sensor at the distal endoscope tip 23. By using a fiber bundle, they also succeeded in the development of a forward‐viewing endoscopic tip without mechanical scanning components at the tip 24. Nevertheless, sample contact or good impedance matching is still needed for image acquisition which might be a problem for in vivo applications. In summary, most of the interferometric approaches offer remote endoscopic acoustic detection with high sensitivity and bandwidth. However, these systems are susceptible to temperature‐drifts or vibrations and require precise calibration 19.
At the moment, there is no easy, robust, interferometer‐free and purely optical endoscopic sensing modality which can detect the photoacoustic signal remotely. In this work, a new miniature detection modality using fiber‐based speckle analysis is presented which could help to improve the current state of the art for endoscopic photoacoustic signal detection. Phantom and ex vivo experiments are performed in transmission and reflection mode for proof of concept. The new technique might help in future to broaden the applications of PAE in imaging or guiding minimally invasive laser procedures.
2. MATERIALS AND METHODS
2.1. Signal generation and speckle analysis
In photoacoustics, laser pulse absorption leads to a thermo‐elastic expansion and thus acoustic signal generation 25. This acoustic signal leads to mechanical deformation when reaching the sample surface generating a tilting with the angle α respective to the original undistorted surface. The speckle‐sensing technique allows the detection of α as explained in detail in 26. By CW‐illumination of a rough surface, a speckle pattern can be generated. If the illuminated surface area tilts, then the primary speckle pattern movement in the far field x p is linear to α. By imaging the primary speckle pattern using a camera a secondary speckle pattern is created on the camera sensor whose movement x s is linearly proportional to the surface tilt 27. Equation (1) explains the relation between the speckle movements x p, x s, the camera magnification M and the imaging distance Z which needs to fulfill the far‐field condition.
| (1) |
By using a high‐speed video imaging system, the pattern can be temporally captured. This allows the reconstruction of the speckle shift in x‐direction x 0 and in y‐direction y 0 between two successive frames (a, b) using Equation (2) 28.
| (2) |
A and B are the Fourier transformations of the two images under investigation. The variables ɛ and η are the spatial image frequencies and x 0 and y 0 represent the shift of the secondary speckle pattern in horizontal and vertical image direction. By inverse Fourier transformation and interpolation, it is possible to reconstruct x 0 and y 0 with subpixel resolution. This allows the calculation of x s between the two images a, b according to Equation (3).
| (3) |
By analyzing the captured speckle video, the temporal secondary speckle shift x s(t) can be calculated which is defined as the temporal surface vibration profile. Considering the speed of sound c, it is then possible to reconstruct the location of the initial pressure source in the object volume relative to the laser‐illuminated area.
2.2. Sample preparation
Figure 1 shows details of the experimental samples that include three tissue phantoms and one ex vivo sample prepared from porcine fat tissue obtained from a local supermarket. For this work, Polyvinylchloride plastisol (PVCP, Standard Lure flex [medium], Lure Factors, Great Britain) is used as phantom material since it offers long‐term stability and similar mechanical properties to soft tissue 29. The speed of sound c in the phantoms is measured using an US thickness measurement device (Mini Test 430, Elektro Physik, Germany) connected to a piezoelectric sensor head with a resonance frequency at 2 MHz at 1334 m/s. The density ρ is measured by volume displacement of ethanol at 1200 kg/m2s. The resulting acoustic impedance (Z = ρc) of the used phantoms in this work is 1.60 × 10⁶ kg/m2s which is in good agreement with the values of soft tissue: The impedance of fat tissue is 1.4 × 10⁶ kg/m2s and for muscle 1.62 × 10⁶ kg/m2 s 30.
Figure 1.
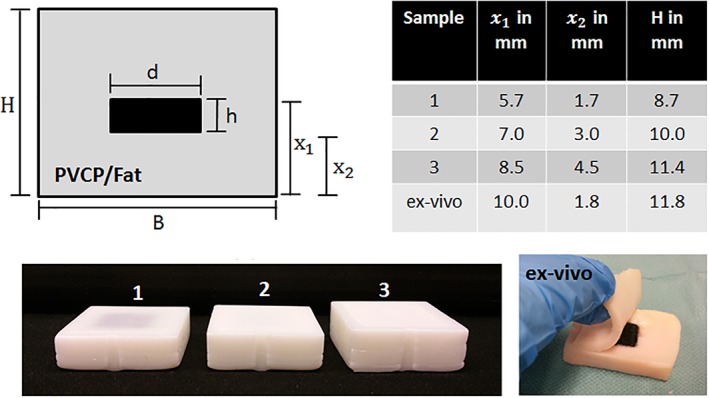
The PVCP phantoms used in this work consist of an absorbing black part with a surrounding scattering matrix. The distance x 1/x 2 between the excitation area at the absorbing part and the detection location at the phantom surface is varied. The ex vivo sample consists of an absorbing part made of PVCP surrounded with fat tissue
In order to adjust the optical properties, additives are added during the plastisol preparation process. A black plastic color changes the absorption coefficient μ a and TiO2‐particles (titanium(IV)‐oxide, Sigma Aldrich, Germany) adjust the reduced scattering coefficient . In this work, a color‐concentration of 7 vol% and a TiO2‐concentration of 4 mg/ml(PVCP) is used for the absorbing and scattering phantom parts, respectively. The optical properties for these concentrations were determined at the excitation wavelength 1064 nm using spectrophotometric measurements and inverse adding doubling. The absorption coefficient for the absorbing phantom part is 106 cm−1 and the reduced scattering coefficient for the scattering part is 21 cm−1. The scattering coefficient for the absorbing part and the absorbing coefficient for the scattering part can be neglected.
Three rectangular PVCP phantoms with a side length B of 30 mm are manufactured using a scattering matrix and an absorbing core. The phantoms are produced in a three‐step process. First, the bottom layer is manufactured and second, the rectangular absorbing part is produced with a side length d = 15 mm and a height h = 4 mm. Third, the absorber is put on the bottom layer and the cast is filled until the final phantom height is reached. The ex vivo sample consists of an absorber placed inside porcine fat. A hole is cut out of the fat tissue and the absorber is placed inside this hole. A thin coating of US gel on the absorber ensures good acoustic coupling. The speed of sound for the fat tissue is measured at 1448 m/s using the US thickness measurement device. The distances x 1/x 2 of the absorbing part to the detection location at the surface are varied for the samples.
It needs to be mentioned that the absorber sizes used in this work are not found in real tissue for endoscopic applications. However, the big absorbers are selected in order to ensure a high photoacoustic surface deformation and tilt for a proof of concept of detecting a photoacoustic signal using endoscopic speckle analysis.
2.3. Optical and experimental setup
Figure 2 illustrates the fiber‐based high‐speed optical imaging system used for this work. An imaging fiber bundle (30 000 fibers, imaging resolution 1 μm, working distance 30 μm, field of view diameter 240 μm) captures the generated speckle pattern. At the proximal end of the fiber bundle a high‐speed microscope setup captures the speckle pattern image. This setup consists of a high‐speed video camera (Phantom v1210, pixel size 28 μm, Vision Research) and its objective is composed of an infinity corrected microscope objective (Mitutoyo Plan Apochromat Objective, M = 10, NA = 0.28, working distance 34 mm), a bandpass for 532 nm, a mechanical aperture (diameter adjustable from 0.8 to 12 mm) and a biconcave lens (f = 200 mm). The aperture diameter was adapted for each measurement in order to achieve a high speckle contrast. The resolution of the optical system is measured about 2.76 μm by a microscope test target (1951 USAF test target, Figure 2).
Figure 2.
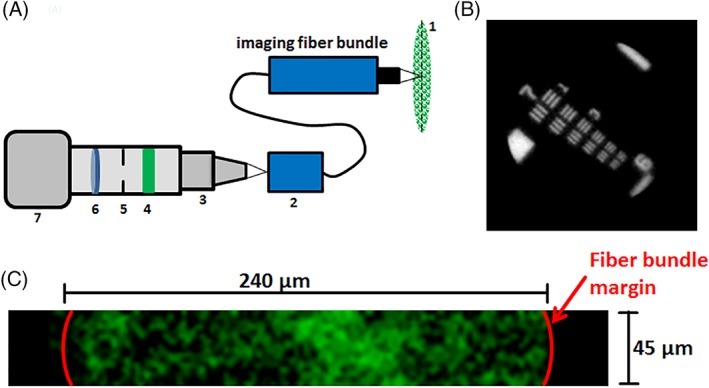
A, The endoscopic, high‐speed imaging system is shown. The image of the speckle pattern (1) at the proximal end of the fiber bundle (2) is captured by a high‐speed microscope system. This microscope system consists of an objective (3), bandpass‐filter (4), aperture (5), lens (6) and a high‐speed camera (7). B, The resolution of the imaging system was measured at 2.76 μm (group 7, element 4) using a USAF 1951 test target. C, Example of a speckle pattern captured with the setup (128 × 16 pixel which enable the sampling of the speckle pattern at a field of view of 45 μm × 240 μm). The width is restricted by the fiber bundle diameter (240 μm), whereas the height (45 μm) is defined by the available pixel amount
Figure 3 shows the experimental setups for endoscopic remote photoacoustic sensing in this work. The samples are measured in transmission mode (excitation and detection on opposite surfaces) and reflection mode (excitation and detection on same surface) using speckle analysis.
Figure 3.
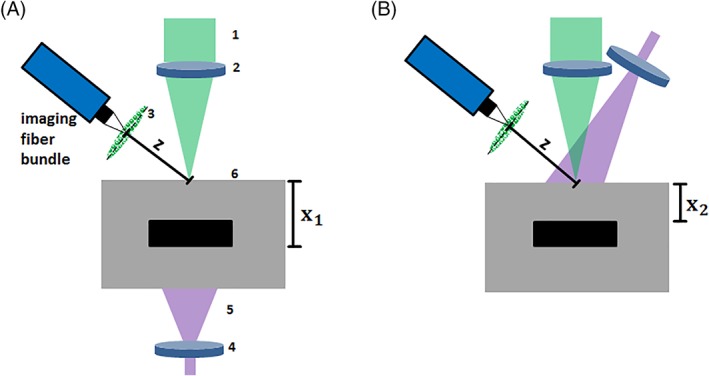
A, Optical setup for remote endoscopic photoacoustic sensing in transmission mode using speckle analysis. The distal tip of the imaging fiber bundle images the speckle pattern at the distance Z to the sample surface. The speckle pattern (3) is generated by CW‐laser beam (1) which is focused on the phantom surface (6) using a lens (2). The sample is excited with a short laser pulse (5) which is expanded by a lens (4) and which triggers the acquisition with the high‐speed camera. B, Optical setup for remote photoacoustic sensing in reflection mode. Excitation and sensing take place on the same object side
Photoacoustic excitation of the phantom is conducted with a single short laser pulse (Quantel Laser, Les Ulis (France), Q‐Smart 450) with a wavelength of 1064 nm and a pulse duration of 5 ns. This laser pulse triggers the acquisition start with the high‐speed camera. The initial beam radius of 3 mm is expanded using a biconcave lens (f = 50 mm) which results in a beam radius at the sample surface of bigger than 6 mm for all experiments. The pulse energy is 105 mJ, resulting in a maximum energy exposure of 93 mJ/cm2. This exposure is lower than the maximum permissible exposure for photoacoustic excitation on soft tissue for short laser pulses at 1064 nm (100 mJ/cm2, 31), when the exposure due to the CW‐laser is neglected. A CW‐laser (532 nm, 100 mW) illuminates the detection side of the sample surface for speckle generation. The illuminated diameter on the sample surface is approximately 300 μm. This results in a high exposure which is above the maximum allowed value for soft tissue. However, this exposure is selected in order to create a bright speckle pattern which can be detected at an imaging distance Z = 7 mm by the high‐speed optical imaging system for the demonstrated proof of concept study. After photoacoustic excitation, a video is captured with a sampling rate of 823 500 frames per second and a resolution of 128 × 16 pixels. This sampling rate is too low for precise photoacoustic sensing. However, it is sufficient for the proof of concept demonstration in this work. The sampling rate leads to a time window of 1.2 μs between the frames. The captured video is analyzed with Matlab R2015b (The MathWorks, Inc., Narick, MA). By calculating the correlation between the video frames, the temporal vibration profile of the sample surface is acquired. The time points of this vibration profile represent the time difference between trigger income (short laser pulse excitation) and the end of an exposure interval of the high‐speed camera.
For this work photoacoustic measurements in transmission mode and reflection mode, using the phantoms and the ex vivo sample, are carried out. For the phantom measurement, 15 single measurements per phantom are carried out and analyzed in order to ensure statistical relevance. For the ex vivo measurements, 10 measurements per sample were done. The reduced amount of measurements for the ex vivo sample reduces the influence of tissue deformation or drying during the experiment. For each sample, the mean arrival time of the photoacoustic signal and its SD is computed using the absolute temporal vibration profile. This photoacoustic peak is found automatically for each measurement by comparison to its noise level nl which is defined as the mean of the absolute temporal vibration profile before photoacoustic excitation. The photoacoustic arrival time is automatically defined as the time of the first signal peak with an amplitude higher than two times nl.
Furthermore, for verification of the remote photoacoustic measurements in transmission mode, a broadband contact US transducer (V111‐RM, Olympus Corporation, Japan) with a resonance frequency of 10 MHz is used. Contact transducers are at the moment the state of the art for photoacoustic signal detection and this modality is considered as precise compared to the remote speckle‐sensing approach. For verification of the transmission mode and the reflection mode measurements, the theoretical arrival time t t for the acoustic signal at the surface is calculated using x 1 or x 2 and c of the sample material.
3. RESULTS AND DISCUSSION
3.1. Sensing in transmission mode
The first experiments are performed on the samples in transmission mode: Photoacoustic excitation and remote endoscopic detection take place on opposite sample sides. Figure 4 shows the measurement results for the three phantoms and the ex vivo sample.
Figure 4.
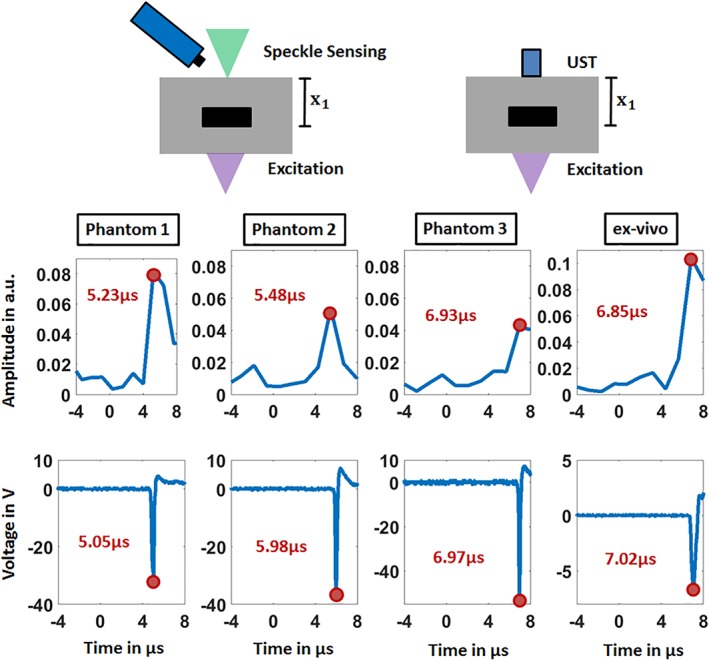
The temporal vibration profiles of the sample surfaces measured in transmission mode using speckle sensing are shown in the upper row. The lower row displays the verification measurements using the ultrasound transducer (UST). Negative time points are related to measurements before the photoacoustic excitation. For the four samples, the detection times of the initial generated photoacoustic signal are noted and the corresponding signal peaks are marked
The detection time of the first peak in the temporal vibration profile of the surface and in the verification measurements using the US transducer is marked with a red circle. The initial surface expansion after the photoacoustic excitation results in a positive pressure on the piezo‐element of the transducer which is related to a negative voltage signal as seen in Figure 4. The first minimum of the US transducer data is used for comparison since it corresponds to a positive surface deformation resulting in a detectable tilt α by the speckle analysis.
For each phantom, the acquisition time of the photoacoustic signal by speckle analysis corresponds to the verification measurements taking into account the measurement uncertainty. This uncertainty can be explained by the low sampling rate of 823 500 frames per second for photoacoustic measurements. This sampling rate leads to a time of 1.2 μs between the video images which is too high for precise photoacoustic sampling and which results in an approximate error of ±0.6 μs. However, this sampling rate is high enough for the feasibility study of the new photoacoustic detection modality shown in this work. For the phantoms 1–3 the acquisition times increase as expected with increasing acoustic travel distance x 1 as follows: 5.23, 5.48 and 6.93 μs. In addition, the signal amplitude decreases for increasing x 1: 0.081, 0.054 and 0.042. A higher acoustic distance leads to a stronger attenuation for the generated acoustic signal. As a result, the sound pressure amplitude reaching the sample surface is lower for a higher amount of x 1, resulting in less surface deformation, or surface tilt. A lower tilt finally results in a lower amplitude for the temporal vibration profile measured by speckle analysis.
Figure 5 shows the mean value for all photoacoustic acquisition times using speckle analysis, its SD, the theoretical detection time and the times for the corresponding ultrasonic transducer detection. It is clearly visible that the detection times of the transducer (see Figure 4) and the theoretical times match the time intervals defined by the speckle‐sensing technique. The outlier for t t of phantom 1 can be explained with a manufacturing or measurement error resulting in a too low value for x 1. For phantom 1 through 3, the speckle‐sensing values are as follows: 5.29 μs ±0.53 μs, 5.61 μs ±0.62 μs, 6.66 μs ±0.78 μs, respectively. For the ex vivo tissue sample, the signal is detected at 6.84 μs ±0.84 μs. The small differences between the acquisition times for the two modalities can be explained with a slight misalignment of the CW‐illumination spot or the transducer from the central phantom axis. This leads to different distances between the location of the initially generated acoustic signal and the illumination point or transducer on the surface. This in turn results in slightly different detection times. The SD for the speckle analysis detection is as previously explained in the expected range of ±0.6 μs. The SD for the ex vivo sample might be higher due to tissue deformation during the experiment.
Figure 5.
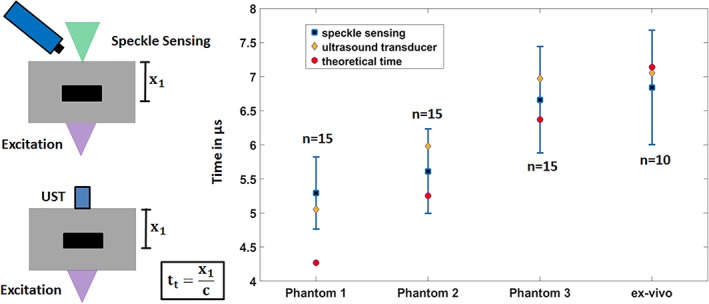
Statistical analysis for the transmission‐mode measurements: mean and SD for the photoacoustic detection times using speckle analysis. The corresponding photoacoustic detection times with the ultrasound transducer are marked with a red circle. These state‐of‐the‐art measurements match the time intervals for speckle sensing
3.2. Sensing in reflection mode
The optical phantoms and the ex vivo sample are also measured in reflection mode. The upper row of Figure 6 shows the acquired temporal vibration profiles for the speckle analysis with marked photoacoustic peak and detection time. With increasing acoustic distance x 2, the detection time increases and the amplitude decreases as expected. It should be emphasized that there is no significant signal rise before the marked peak. Thus, the influence of a laser‐induced signal which can be generated directly at the sample surface by the laser pulse excitation, is excluded for the reflection‐measurements. The bottom row in Figure 6 shows the mean acquisition times, their SD and the theoretical arrival time t t of the acoustic signal at the sample surface. For phantom 1 to 3 the acquisition times are as follows: 1.7 μs ±0.49 μs, 2.74 μs ±0.69 μs, and 3.72 μs ±0.5 μs. For the ex vivo sample the signal is detected at 2.73 μs ±0.66 μs. The calculated recognition times t t are for phantom 1 to 3 and the ex vivo sample as follows: 1.27, 2.25, 3.37 and 1.24 μs. It can be clearly seen that the calculated detection times correspond to the time intervals defined by the speckle‐sensing technique for all samples. However, there is a trend that the mean value for the detection time of the speckle‐sensing technique is greater than the estimated detection time. This can be explained by the fact that the estimated detection time is calculated using x 2, which is the shortest distance between the sample surface and the absorber. In reality, light scattering leads to photoacoustic signal generation at positions inside the sample that have a greater distance to the detection spot of the sample surface than x 2. This effect could be further enhanced by excitation from the side at an angle to the center axis of the sample. In general, the described effect should lead to a later detection time using the speckle‐sensing technique.
Figure 6.
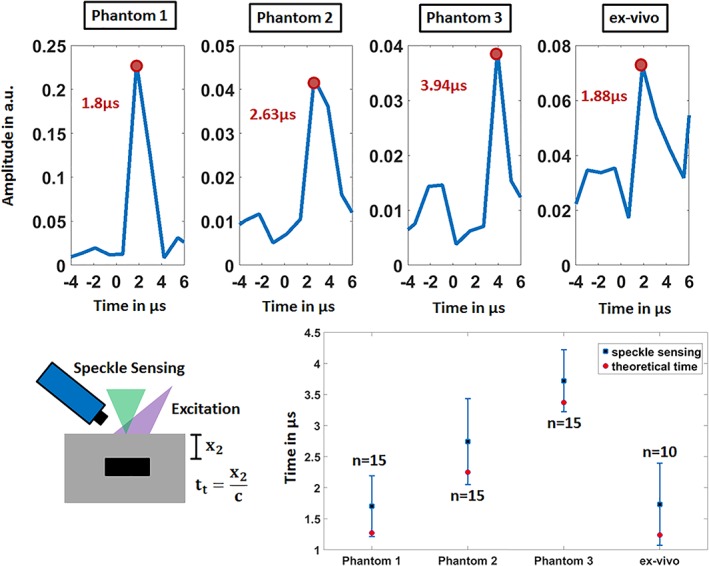
The temporal vibration profiles of the sample surfaces measured in reflection‐mode using speckle sensing are shown in the upper row. For each sample, the time of the first peak is noted which corresponds to the photoacoustic signal. The lower row displays the verification by comparison to the theoretical photoacoustic arrival time t t
3.3. Imaging system and sensitivity
The fiber bundle and the high‐speed video microscope system are selected and constructed according to the resulting speckle diameter S d, the optical resolution, the minimum detectable tilt and the recording speed. The speckle size at a distance Z to the illuminated surface (imaging plane) depends on the illumination diameter D and the wavelength 32: S d = (λZ/D). The following parameters are used in this work: D = 300 μm, Z = 7 mm, λ = 532 nm which lead to S d = 12.4 μm. This size can be resolved by multiple cores of the imaging fiber bundle and also by multiple pixels with the high‐speed microscope system (resolution of 2.76 μm).
The setup is also designed based on the minimal detectable surface tilt α min. The algorithm is able to detect shifts of 1/20 of the imaging resolution. This value defines the minimal detectable shift for the secondary speckle pattern. With this value and Equation (1), α min is calculated at 1.13 × 10⁻⁴degree (Z = 7 mm, x s = (2.76/20) μm, M = 10). Horstmann et al. measured a maximum axial photoacoustic surface displacement of 50 nm for a silicone phantom with a cubic absorber with a diameter of 1 mm and a radiant exposure of 32 mJ/cm2 33. For the study shown in this article, even larger absorber sizes and higher excitation exposures are used which should lead to larger deformation amplitudes than 50 nm with a surface tilt bigger than 1.13 × 10⁻⁴degree. Based on this comparison, the noise equivalent detection tilt (1.13 × 10⁻⁴degree) is considered sufficient small for the detection of the photoacoustic signal in this work. In general, the magnitude for the tilt is dependent on the mechanical properties of the surface and on the generated acoustic wavefront shape by the absorbing geometry.
In general, the sampling rate for photoacoustic signal detection is several megahertz (MHz). However, there is no camera available that can provide this high acquisition rate for remote photoacoustic detection using speckle sensing. The camera used in this work (Vision Research, Phantom v1210) is one of the fastest high‐speed cameras available at the moment and offers 823 500 frames per second at a resolution of 128 × 16 pixels. This sampling rate is high enough for the proof of concept of remote endoscopic photoacoustic signal acquisition by speckle analysis. However, a faster optical detection system will be required in future for more precise signal acquisition.
It is also worth to discuss the main differences of the setup described in this work and the setup of Horstmann et al. who established full‐field speckle interferometry for noncontact photoacoustic tomography 33. They show an interferometric system which measures the axial photoacoustic surface deformation with the phase shift of a probe laser. By repetitive acoustic excitation and measurements, they are capable to detect the temporal surface deformations of a complete surface region. However, the interferometric approach holds several disadvantages. It is for example more complicated since it needs precise calibration. Furthermore it is more sensitive to noise than the robust, interferometric‐free approach shown in this work. In addition, their demonstrated system is not fiber based and thus not yet suitable for endoscopic sensing.
4. SUMMARY AND OUTLOOK
Lengenfelder et al. already demonstrated the feasibility of remote photoacoustic sensing by speckle analysis 26. However, the detection system used in this work is not fiber based and thus not suitable for endoscopic applications. This manuscript, on the other hand, reports on a new, purely optical, noninterferometric, endoscopic modality for photoacoustic signal acquisition. Based on the repeatability and successful verification of the transmission mode and reflection mode measurements, it can be concluded that endoscopic speckle sensing is a reliable technique for the photoacoustic detection on phantoms which mimic optical and mechanical properties of tissue and ex vivo samples. In particular, the proof of concept for the reflection‐mode setup on biological tissue is an essential step toward the future application of the technique in an endoscopic imaging device or as a smart feedback system for minimally invasive laser procedures. For these possible applications, the excitation and remote sensing must also be performed on the same tissue side.
Furthermore, it needs to be mentioned that there are two advantages of the new modality compared to state‐of‐the‐art contact transducers for the implementation in an endoscopic system. First, there is no frequency dependent sensitivity for speckle sensing compared to transducers, which show a resonant behavior. Due to this fact, the acoustic detection bandwidth is equals the acquisition rate of the sensing system. Second, its miniaturization is easier since there is no bulky transducer or impedance matching needed at the endoscope tip. In the future, one closed, miniature system that contains excitation and sensing could be developed by placing a thin imaging fiber bundle parallel to an excitation fiber.
It is necessary to reduce the CW‐irradiance for speckle formation, because the resulting CW‐exposure is above the allowed limit. This could be achieved by temporally gating the CW‐laser. Since only a measurement window of approximately 10 μs after photoacoustic excitation is considered, the CW‐laser can be switched off for the time not falling into this time window. Furthermore, a more sensitive detector system than the high‐speed camera used in this work needs to be established. An avalanche photodiode array which is designed for low‐level light applications will be considered here. These two measures will decrease the needed exposure for speckle detection significantly and will allow the use of low power CW‐lasers which have already been successfully applied for remote speckle sensing 34, 35, 36. In addition, they will also enable remote photoacoustic detection on absorbing surfaces. This represents an important step, as only‐scattering surfaces like PVCP and fat were used in this work.
Precise image reconstruction would not be possible with the used setup due to the used sampling rate of 823 500 Hz and due to the fixed CW‐illumination. Consequently, a faster microscope‐system based on diodes together with a flexible, scannable illumination could be developed in future. For precise data reconstruction a sampling rate of 30 MHz which could be achieved with the mentioned avalanche photodiode system will be targeted. This sampling rate would result in a reconstruction precision in tissue of below 100 μm. By scanning the CW‐illumination over the field of interest on the object, point by point signal acquisition could be performed with repeated photoacoustic excitation. For each measurement point, the speckle pattern can be captured and temporally tracked with the diode array and the temporal oscillation profile can be computed. After data acquisition, it would be possible to reconstruct the initial pressure distribution of the excited volume using back projection algorithms. Alternatively, mechanical scanning‐free photoacoustic image acquisition techniques as suggested by Meiri et al. 37 or implemented by Horstmann et al. 33 can be followed for volumetric data reconstruction. In this case, the scanning‐free nature would be an advantage for system miniaturization for endoscopic applications.
These future work packages might lead to more realistic experiments with smaller phantoms, ex vivo samples and later to in vivo trials. If successful, the new technique might help in future to broaden the applications of PAE in imaging or guiding minimally invasive laser procedures.
CONFLICT OF INTEREST
The authors declare no potential conflict of interests.
AUTHOR CONTRIBUTIONS
B.L. as the first author, implemented the new endoscopic sensing system. He also guided the manufacturing of the phantoms and the preparation of the ex vivo samples. Experiments were also done by him, he performed the relevant data analysis and drafted the manuscript. F.M. and M.H. helped to establish the new sensing system and the experimental procedure. C.L. prepared ex vivo samples and carried out measurements. M.S., M.J.W., Z.Z. and F.K. guided the general research strategy and gave a critical revision of this manuscript. All authors read and approved this manuscript.
ACKNOWLEDGMENTS
This work was funded by the Deutsche Forschungsgemeinschaft (DFG, German Research Foundation)—project number 397972545. Also funding of the Erlangen Graduate School in Advanced Optical Technologies (SAOT) by the DFG in the framework of the German excellence initiative is gratefully acknowledged.
Lengenfelder B, Mehari F, Hohmann M, et al. Contact‐free endoscopic photoacoustic sensing using speckle analysis. J. Biophotonics. 2019;12:e201900130 10.1002/jbio.201900130
Funding information Erlangen Graduate School in Advanced Optical Technologies (SAOT); Deutsche Forschungsgemeinschaft
REFERENCES
- 1. Wang L. V., Hu S., Science 2012, 335, 1458. [DOI] [PMC free article] [PubMed] [Google Scholar]
- 2. Wang L. V., Yao J., Nat. Methods 2016, 13(8), 627. [DOI] [PMC free article] [PubMed] [Google Scholar]
- 3. Song H., Wang L. V., J. Biomed. Opt. 2010, 15, 011101. [DOI] [PMC free article] [PubMed] [Google Scholar]
- 4. Zackrisson S., Van De Ven S. M. W. Y., Gambhir S. S., Cancer Res. 2014, 74, 979. [DOI] [PMC free article] [PubMed] [Google Scholar]
- 5. Ducourthial G., Leclerc P., Mansuryan T., Fabert M., Brevier J., Habert R., Braud F., Batrin R., Vever‐Bizet C., Bourg‐Heckly G., Thiberville L., Druilhe A., Kudlinski A., Louradour F., Sci. Rep. 2015, 5, 18303. [DOI] [PMC free article] [PubMed] [Google Scholar]
- 6. Vakoc B. J., Fukumura D., Jain R. K., Bouma B. E., Nat. Rev. Cancer 2012, 12(5), 363. [DOI] [PMC free article] [PubMed] [Google Scholar]
- 7. Piao D., Xie H., Zhang W., Krasinski J. S., Zhang G., Dehghani H., Pogue B. W., Opt. Lett. 2006, 31, 2876. [DOI] [PubMed] [Google Scholar]
- 8. Yang H., Xi L., Samuelson S., Xie H., Yang L., Jiang H., Biomed. Opt. Express 2013, 4(3), 427. [DOI] [PMC free article] [PubMed] [Google Scholar]
- 9. Kim C., Favazza C., Wang L. V., Chem. Rev. 2010, 110, 2756. [DOI] [PMC free article] [PubMed] [Google Scholar]
- 10. Yang J.‐M., Chen R., Favazza C., Yao J., Li C., Hu Z., Zhou Q., Shung K. K., Wang L. V., Opt. Express 2012, 20, 23944. [DOI] [PMC free article] [PubMed] [Google Scholar]
- 11. Yang J.‐M., Li C., Chen R., Rao B., Yao J., Yeh C.‐H., Danielli A., Maslov K., Zhou Q., Shung K., Wang L. V., Biomed. Opt. Express 2015, 6(3), 918. [DOI] [PMC free article] [PubMed] [Google Scholar]
- 12. Yuan Y., Yang S., Xing D., Opt. Lett. 2010, 35, 2266. [DOI] [PubMed] [Google Scholar]
- 13. Karpiouk A. B., Wang B., Emelianov S. Y., Amirian J. H., Smalling R. W., J. Biomed. Opt. 2012, 17, 096008. [DOI] [PMC free article] [PubMed] [Google Scholar]
- 14. Xi L., Duan C., Xie H., Jiang H., Appl. Opt. 2013, 52, 1928. [DOI] [PubMed] [Google Scholar]
- 15. Yang Y., Li X., Wang T., Kumavor P. D., Aguirre A., Shung K. K., Zhou Q., Sanders M., Brewer M., Zhu Q., Biomed. Opt. Express 2011, 2, 2551. [DOI] [PMC free article] [PubMed] [Google Scholar]
- 16. Miranda C., Barkley J., Smith B. S., J. Biomed. Opt. 2018, 23, 046008. [DOI] [PubMed] [Google Scholar]
- 17. Jansen K., Van Der Steen A. F. W., van Beusekom H. M. M., Wolter Oosterhuis J., van Soest G., Opt. Lett. 2011, 36(5), 597. [DOI] [PubMed] [Google Scholar]
- 18. Ji X., Xiong K., Yang S., Xing D., Opt. Express 2015, 23, 9130. [DOI] [PubMed] [Google Scholar]
- 19. Wissmeyer G., Pleitez M. A., Rosenthal A., Ntziachristos V., Light Sci. Appl. 2018, 7(1), 53. [DOI] [PMC free article] [PubMed] [Google Scholar]
- 20. Blatter C., Grajciar B., Zou P., Wieser W., Verhoef A.‐J., Huber R., Leitgeb R. A., Opt. Lett. 2012, 37, 4368. [DOI] [PubMed] [Google Scholar]
- 21. Hochreiner A., Bauer‐Marschallinger J., Burgholzer P., Berer T., Photons Plus Ultrasound: Imaging and Sensing 2014, International Society for Optics and Photonics, San Francisco: 2014, p. 89436B. [Google Scholar]
- 22. Dong B., Chen S., Zhang Z., Sun C., Zhang H. F., Opt. Lett. 2014, 39, 4372. [DOI] [PMC free article] [PubMed] [Google Scholar]
- 23. Zhang E. Z., Beard P. C., Photons Plus Ultrasound: Imaging and Sensing 2011, International Society for Optics and Photonics, San Francisco: 2011, p. 78991F. [Google Scholar]
- 24. Ansari R., Zhang E. Z., Desjardins A. E., Beard P. C., Light Sci. Appl. 2018, 7(1), 75. [DOI] [PMC free article] [PubMed] [Google Scholar]
- 25. Xia J., Wang L. V., IEEE Trans. Biomed. Eng. 2014, 61, 1380. [DOI] [PMC free article] [PubMed] [Google Scholar]
- 26. Lengenfelder B., Mehari F., Hohmann M., Heinlein M., Chelales E., Waldner M. J., Klämpfl F., Zalevsky Z., Schmidt M., Sci. Rep. 2019, 9(1057), 1. [DOI] [PMC free article] [PubMed] [Google Scholar]
- 27. Zalevsky Z., Beiderman Y., Margalit I., Gingold S., Teicher M., Mico V., Garcia J., Opt. Express 2009, 17, 21566. [DOI] [PubMed] [Google Scholar]
- 28. Srinivasa Reddy B., Chatterji B. N., IEEE Trans. Image Process. 1996, 5, 1266. [DOI] [PubMed] [Google Scholar]
- 29. Fonseca M., Zeqiri B., Beard P., Cox B., European Conference on Biomedical Optics, Optical Society of America, Munich, Germany: 2015, p. 953911. [Google Scholar]
- 30. Culjat M. O., Goldenberg D., Tewari P., Singh R. S., Ultrasound Med. Biol. 2010, 36(6), 861. [DOI] [PubMed] [Google Scholar]
- 31. Xu M., Wang L. V., Rev. Sci. Instrum. 2006, 77, 041101. [Google Scholar]
- 32. Golberg M., Fixler D., Shainberg A., Zlochiver S., Micó V., Garcia J., Beiderman Y., Zalevsky Z., J. Biomed. Opt. 2013, 18, 101310. [DOI] [PubMed] [Google Scholar]
- 33. Horstmann J., Spahr H., Buj C., Münter M., Brinkmann R., Phys. Med. Biol. 2015, 60, 4045. [DOI] [PubMed] [Google Scholar]
- 34. Sirkis T., Beiderman Y., Agdarov S., Beiderman Y., Zalevsky Z., Opt. Express 2016, 24, 27899. [DOI] [PubMed] [Google Scholar]
- 35. Tenner F., Regensburger M., Schramm A., Söhle M., Schwarzkopf K., Zalevsky Z., Schmidt M., Engineering in Medicine and Biology Society (EMBC), 2017 39th Annual International Conference of the IEEE, IEEE, Jeju Island, South Korea: 2017, p. 4231. [DOI] [PubMed] [Google Scholar]
- 36. Bishitz Y., Ozana N., Schwarz A., Beiderman Y., Garcia J., Zalevsky Z., Biomed. Opt. Express 2016, 7, 1003. [DOI] [PMC free article] [PubMed] [Google Scholar]
- 37. Meiri A., Strohm E. M., Kolios M. C., Zalevsky Z., Opt. Commun. 2017, 401, 23. [Google Scholar]


