Abstract
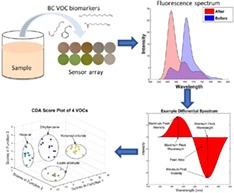
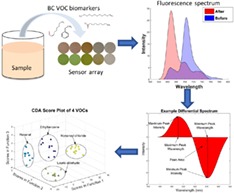
Non‐invasive detection of urinary bladder cancer remains a significant challenge. Urinary volatile organic compounds (VOCs) are a promising alternative to cell‐based biomarkers. Herein, we demonstrate a novel diagnosis system based on an optic fluorescence sensor array for detecting urinary bladder cancer VOCs biomarkers. This study describes a fluorescence‐based VOCs sensor array detecting system in detail. The choice of VOCs for the initial part was based on an extensive systematic search of the literature and then followed up using urinary samples from patients with urinary bladder transitional cell carcinoma. Canonical discriminant analysis and partial least squares discriminant analysis (PLS‐DA) were employed and correctly detected 31/48 urinary bladder cancer VOC biomarkers and achieved an overall 77.75% sensitivity and 93.25% specificity by PLS‐DA modelling. All five urine samples from bladder cancer patients, and five healthy controls were successfully identified with the same sensor arrays. Overall, the experiments in this study describe a real‐time platform for non‐invasive bladder cancer diagnosis using fluorescence‐based gas‐sensor arrays. Pure VOCs and urine samples from the patients proved such a system to be promising; however, further research is required using a larger population sample.
Keywords: bladder cancer, fluorescence gas‐sensory arrays, urinary volatile organic compounds
This study establishes a low‐cost real‐time platform for non‐invasive bladder cancer diagnosis using fluorescence gas‐sensor array. The system generates a unique responding pattern for each testing sample based on the responds of sensor arrays with bladder cancer volatile organic compounds urinary biomarkers. The system successfully identifies the different bladder cancer urinary biomarker vapours as well as urine sample from bladder cancer patients and healthy controls by canonical discriminant analysis and partial least squares discriminant analysis.
1. INTRODUCTION
Non‐invasive detection of urinary bladder cancer remains the focus of ongoing research in urologic oncology. Besides early detection, urinary‐based biomarkers have huge potential in predicting recurrence of non‐muscle invasive disease which incur a high cost to healthcare organisations during invasive follow‐up cystoscopy management 1. Cystoscopy‐aided biopsy and histopathological confirmation remain the gold‐standard against which several biomarkers have been tested in the past 2. Disease‐specific volatile organic compounds (VOCs) in the form of cancer biomarkers provide a new exciting perspective for early cancer detection in urinary bladder and other site cancers 3, 4.
VOCs are organic chemicals (eg, alcohols, alkanes, aromatics) that have vapour pressure greater than 100 Pa at ambient temperature. They are commonly released from the human body in exhaled breath and are present in blood, skin, saliva, faeces and urine 5. They are produced through cellular activities entering the blood stream and contain a wealth of information about cellular behaviour and their metabolic changes. Such cellular activity products are then concentrated through kidney and finally excreted through urine 6. Different VOCs are produced both by cancerous and healthy cells during various metabolic and nutritional activities 4, 7, 8. However, certain VOCs are not produced during normal physiological processes, but their production is related to pathological conditions. Correlation with the presence of cancer is plausible as a number of VOCs are exclusively produced during carcinogenesis and become candidate biomarkers for cancer detection 9. The emission of VOCs by cancerous cells could be the result of peroxidation of the cell membrane species owing to genetic‐changes causing oxidative stress 10, 11, 12.
The discernment of VOCs in exhaled breath as an early‐stage lung cancer diagnostic and for monitoring the response to treatment in advance lung cancer has already been reported 13, 14. Similarly and in parallel, diagnosis of bladder and prostate cancer based on the sense of smell of trained dogs is also based on the presence of specific VOCs in the urine of patients with the disease has been observed 15, 16, 17.
The most common techniques utilised for the detection of VOCs in urinary bladder cancer are gas chromatography‐mass spectrometry (GC‐MS 18), selected ion flow tube‐mass spectrometry (SIFT‐MS 19) and gas responsive sensors (e‐noses 20). The high reliability in identification of analytes and robust sensitivity (less than parts‐per‐billion [ppb] to parts‐per‐trillion [ppt] 21, 22) makes GC‐MS the most commonly used analytical technique. Jobu et al. applied GC‐MS analysis to urine samples from bladder cancer patients and healthy controls, finding found five characteristic peaks within GC‐MS signals of bladder cancer patients not present in healthy controls. They suggested that those peaks were because of ethylbenzene, nonanoyl chloride, dodecanal, (Z)‐2‐nonenal and 5‐dimethyl‐3(2H)‐isoxazolone, and these can be used as biomarkers for urinary bladder cancer 18.
A disadvantage of GC‐MS is that it cannot be used in real time. On the other hand, proton‐transfer‐reaction mass spectrometry, which has a higher sensitivity than GC‐MS (low ppb‐low ppt 23, 24), can be employed in real time; however, this does not discriminate between compounds with the same molecular weight. SIFT‐MS allows the detection in real time, is quite sensitive (sub‐ppb to low ppb 25) and is reliable in identification of VOCs. A study involving the use of SIFT‐MS proved that patients with bladder cancer have a significantly higher concentration of formaldehyde in their urine headspace than health controls 19.
In recent years, attention has moved towards deploying e‐noses for the detection of VOCs in different cancers, but there are only a limited number of reports regarding diagnosis of urinary bladder cancer 4, 26, 27. e‐nose technology is based on chemical sensors array and pattern recognition through sensor‐specific responses to VOC molecules. The technique can detect and analyse VOCs with a sensitivity of low ppb 28. Different types of detection methods have been developed for e‐nose sensors, such as metal‐oxide semiconductors sensors, conducting polymer sensors, piezoelectric sensors, optical sensors, surface acoustic wave sensors, and quartz microbalance (QMB) sensors 29. They are particularly appealing, because they can be miniaturised and are much cheaper and less time‐consuming than mass spectrometry techniques 30. Among the different sensing technologies, optical gas sensors based on optically active organic materials, such as porphyrins and metalloporphyrins, have been successfully employed to develop an e‐nose prototype for the detection and quantification of VOCs in exhaled breath 7. Gasparri et al. recently reported employing porphyrin‐coated QMB sensor array e‐nose to diagnosis lung cancer in 146 breath samples from 70 lung cancer patients and 76 healthy controls reaching 81% sensitivity and 91% specificity 13. A recent study involved 60 urine samples from 30 bladder cancer patients and 30 healthy controls using commercially available e‐nose Cyranose 320 (Sensigent, Baldwin Park, California) and achieved 93.3% sensitivity and 86.7% specificity; however, the sample size of this study was relatively small, and it lacked external validation in its prediction model 31.
In the present study, we propose that changes in fluorescence properties of sensitive materials such as porphyrins and metalloporphyrins when exposed to urinary VOCs could provide essential information for the detection of urinary bladder cancer. Based on our previous experience, we believed that change in fluorescence constituted an important diagnostic marker of bladder cancer 32, 33.
The optical sensitivities of porphyrins and metalloporphyrins to VOCs are bases on π‐π interactions and the n‐π interactions that reflect changes in porphyrins' absorption, fluorescence and reflectance spectrums. Before the reaction with VOCs, the energy difference between the highest occupied molecular orbital and the lowest unoccupied molecular orbital (HOMO‐LUMO gap) determines the absorbance peak. The interactions between porphyrins and VOCs lead to a change of the electron dipole moment, causing a change in the energy gap between the two orbitals, therefore resulting in a change of the absorbance and fluorescence emission spectrums of porphyrins.
With the background, we sought to construct an optical sensory‐based method for the detection of bladder cancer with significant potential of miniaturisation and point‐of‐care test.
2. MATERIALS AND METHODS
Based on extensive literature research 18, 34, 35, four bladder cancer urinary biomarker VOCs were chosen in this study: ethylbenzene, hexanal, laurie aldehyde and nonanoyl chloride, and all chemicals were purchased from Sigma‐Aldrich and used without further purification.
2.1. Manufacture of fluorescence gas‐sensor arrays
The 8‐element sensor arrays were developed by spotting the sensitive materials on polyvinylidene fluoride (PVDF) film. The sensitive materials contained three porphyrins, two fluorescence dyes, two solvatochromic dyes and one pH indicator 7, 36, 37, 38. All sensitive materials were prepared to 5% tetrahydrofuran solution and each spotting point featured 1.5 μL of the solution (75 ng solute). For the single chamber test, the sensor array films were cut into small pieces featuring one sensory point on each piece to fit it within the single chamber. For the multi‐element test, all eight sensitive materials were spotted on one film, and the arrangement of each points was precisely controlled to permit the excitation laser beam to focus on the exact position of each sensory point.
2.2. Single‐element chamber test: Proof‐of‐concept
To validate the performance of the sensitive material, the single‐element reaction chamber was made and tested with saturated bladder cancer‐specific biomarker VOCs vapours. The three‐dimensional (3D) printed reaction chamber (Figure 1) has two parts: the upper part has a hole to let the detection probe of the LAKK‐M laser device to fit in, and the lower part has a stand to support the sensor film and be able to allow the VOCs vapours spread into the chamber. The two parts were screwed together to ensure a tightly sealed environment. First, the reaction chamber with a single‐element sensor film was mounted on the empty flask, and the fluorescence spectrum under ultraviolet (UV; 365 nm), blue (450 nm), and green (532 nm) excitation light was detected by the LAKK‐M device. An accumulation of 15 spectra was recorded using an acquisition time of 150 ms per exposure at an excitation power of 4.2 mW. Second, 5 mL of VOC liquid was added into a flask and warmed to 37°C, and the VOC gas was released and spread into the chamber to be reacted with the sensitive materials on the sensor film. After 2 minutes wait for the reaction to take place, the fluorescence spectra for the same excitation lights were recorded. Through the single‐element test chamber, the distance between the light fibre tips to the film was fixed at 6 mm, permitting the light source to illuminate a 4‐mm diameter circle area. After repeatedly experiments, current distance and illuminate area were determined. Fluorescence intensity of the sensitive materials can be maintained for 30s under exposure of UV light and 1 minute under blue light. The films were discarded after each test.
Figure 1.
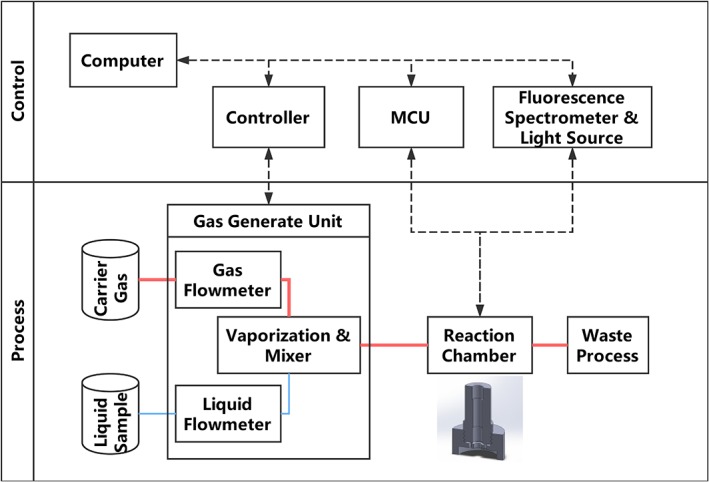
Sketch and work flow of the system and the 3D sketch of single‐element reaction chamber. The multi‐element chamber using the same gas delivery and optic system with an extra mechanical device for switching the sensory elements. MCU, Multipoint Control Unit
To reduce errors, the background signal of the device was measured, and the data showed that the materials of the 3D print device and substrate can cause background fluorescence. The main reason is that the polymer materials will emit fluorescence, especially under UV and blue light excitation. Finally, we chose black PVA (Polyvinyl alcohol) as 3D printing material and low‐fluorescence PVDF as a substrate. The background of the substrates and chamber material was measured before each test as the reference.
2.3. Multi‐elements array tests: Automatic real‐time system
The experimental design and system workflow are portrayed in Figure 1. The system has two parts: a control unit and process unit. The control unit has a host computer connected with multiple input and output devices—the gas generation unit controller that controls and records the temperature as well as flow speed of the liquid sample and carrier gas; an Arduino Uno (Arduino, Turin, Italy) microcontroller unit that controls and receives data from the mechanic parts and environmental sensors (temperature, pressure and humidity) built‐in reaction chamber; fluoresce spectrometer and its light source (LAKK‐M, LAZMA, Moscow, Russia) for fluorescence excitation and receiving. The process unit functions according to the following steps: the liquid samples and carrier gas flows into the vaporisation mixer, the flow speed is regulated by the corresponding liquid flowmeter and gas flowmeter. The mixture gas is then passed through the reaction chamber and reacted with the sensitive materials on the film plate for 2 min. After the reaction, the valve is opened, and the gas is released to the waste cylinder.
The reaction chamber was re‐designed to allow multiple elements to be exposed and measured together. At each end of the reaction chamber, a pre‐mixture chamber was attached to the main chamber, the pre‐mixture chamber has many small diversion channels built‐in that allows the VOC vapour mixture to distribute within the chamber evenly. The sensory array utilised in this system was based on a 5 × 5 layout, which means each film has three 8‐element arrays and one blank reference point.
2.4. Patient recruitment
Five patients with cystoscopically confirmed bladder cancer were recruited from the endoscopy unit at Ninewells Hospital, Dundee, on the day of scheduled treatment. Five age and gender matched controls with other urological diseases were recruited from the Urology Outpatient Department from the same hospital as well. All the participants were free from urinary tract infections as assessed by dipstick testing prior to sample collection. All participants first void morning urine was collected and stored in a sterilised urine beaker for freezing within 1 hour of collection in a − 20°C freezer.
Ethic approval for this study was obtained through the East of Scotland Research Ethics Service (REC: 17/ES/0003). All participants were given an information sheet regarding this study, and written consent was obtained on the day of recruitment. The demographic details of the participants are presented in Table 1. As a proof‐of‐principle study, we sought to test our device on patient samples. The study is ongoing, and the results from a larger cohort will be reported subsequently.
Table 1.
Participant demographic of urine test
| Bladder cancer | Control | |
|---|---|---|
| Number of individuals | 5 | 5 |
| Mean age (years] | 61.8 | 60.8 |
| Age range (years) | 33‐79 | 32‐70 |
| Gender (Male: female) | 4:1 | 4:1 |
2.5. Urine test
The system for the urine test was modified based on the multi‐element array system mentioned earlier, the gas generation unit was replaced by a diaphragm pump (RS‐Components, Corby, UK) controlled by an Arduino microcontroller, and another setup including the reaction chamber, sensory film, and ambient sensors was kept the same as described previously.
Before starting the experiments, the frozen urine was thawed and pre‐warmed to 37°C in a water bath and transferred to 15‐mL flasks connected to the reaction chamber by close‐loop recycling tubing. During the first step, the “before” spectrum was measured without exposure to the vapours of urine. Then, the diaphragm pump was switched on and it began pumping the air into the urine, and VOC molecules were released into the headspace through the bubbling process. During the whole test, the pump was cycling the air within the system and helping shorten the time required for VOC vapour to reach the gas‐liquid phase dynamic balance. After 5 minute, the “after” spectrum of the sensory film was evaluated and the whole system was purged with clean air.
2.6. Software and analysis methods
2.6.1. Differential spectrum and signal processing
The responses of the sensory point to the presence of VOCs are based on differential spectrums. It was calculated by subtraction of final spectrums with the initial spectrums of each sensory points. In general, the data file contained 2100 pairs of data, and each pair had a wavelength reading and corresponding intensity reading.
First, the differential spectrums were normalised with the area under curve by the following equation:
where λ is the wavelength, λ 1 and λ 2 are the two wavelength boundaries of the observing spectrum and I λ and are the corresponding original intensity and normalised intensity on wavelength λ. The normalisation process can reduce the effect of output power fluctuation of the excitation light, thus improving reproducibility. Second, the normalised spectrums were applied with a de‐noising filter to remove the background noise. Savitzky‐Golay filtering 39 has been widely applied in signal processing for de‐noising, and it can remove high‐frequency noise efficiently without shift the fluorescence peaks, which is important for this study. Finally, the backscattering of the excitation light was removed from the spectrum and only remained the emissions.
2.6.2. Signal characteristic extraction
For each differential spectrum, five spectrum characteristics were extracted: maximum peak value and wavelength, minimum peak value and wavelength and peak area, as shown in Figure 2 7. MATLAB 2016b (MathWorks, Natick, Massachusetts) was used for both spectrum characteristics extraction and smoothing process. To evaluate the responses of the sensitive materials to the VOCs, Canonical discriminant analysis (CDA) was calculated using SPSS Statistics v22 (IBM, Chicago, Illinois). Compared to principal component analysis (PCA), the CDA is concentrated on distinguishing the differences between samples and was more suitable for evaluating the performance of the sensor arrays. To build the prediction model, partial least squares discriminant analysis (PLS‐DA 40) was used for this purpose with MATLAB 2016b, while leave‐one‐out cross‐validation and individual external validation were applied to evaluate the performance of the prediction model.
Figure 2.
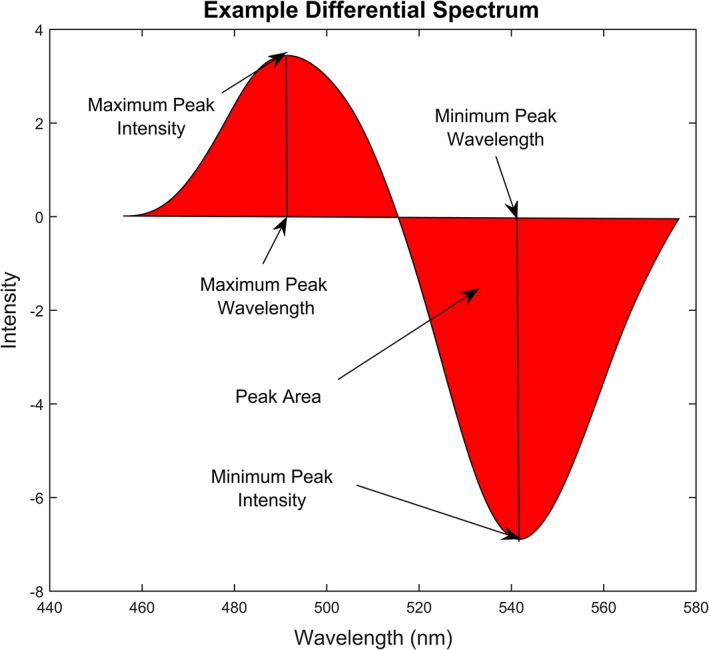
Example of differential spectrum calculated from the fluorescence spectra before and after exposure to bladder cancer urinary VOC vapour, the spectrum characteristics: maximum peak value and wavelength, minimum peak value and wavelength, and peak area were used for describing the characters of the differential spectrum and to be used as input for CDA
3. RESULTS AND DISCUSSION
3.1. Sensory point and film
All the porphyrins family sensitivity materials used in this study share similar main structure namely tetraphenyl porphyrin (TPP), but the different central metal ions and the substituents on the peripheral benzene rings determined their different visual colours, as well as fluorescence spectra. The differences of the central metal ions also reflected in their responses to the VOCs, and, in general, the fluorescence spectra exhibited a fluorescence peak red‐shift, while on visible zones the colour changes could be of a shorter wavelength. Apart from TPP and their derivatives, other fluorescence dyes were also employed in this study, including pH indicators and solvatochromic dyes.
Comparing to commercially widely used e‐nose based on MOS or polymer sensors, the optical VOC sensor array are relative newer and only few clinical studies being carried out. Compared to purpose‐built polymer sensors, the long‐term costs of the optical sensory film are extremely low, and such films are easy to upgrade and expand to suit different applications without changing the design of the main device. The optical changes are also very intuitional and easy to accept by clinical staff because it can be very similar to clinically widely used urine dipstick tests.
As depicted in Figure 3, the visible colour of the sensory film changed after exposure to VOC vapours, and such changes could be used as sensory responses to the presence of the VOC. In fact, various first‐generation colorimetric e‐nose or artificial tongues were developed based on this phenomenon 38, 41, 42. Those devices were composed of chemical responsive material sensory arrays and scanner or cameras, by taking pictures of the sensory arrays before and after exposure to test substances, and the colorimetric changes could be quantized as changes in RGB value of the picture region. The colorimetric methods have advantages in cost and ease of use, but the colour changes sometimes may not be significant enough for RGB differences calculations, thereby limiting the sensitive material choices. For example, the sensory point 5 in Figure 3 has minor visible colour changes (5.b vs. 5.a) when exposed to VOC vapours but in the near‐infrared region, there is a fluorescence peak intensity changes, meaning that this material is usable for fluorescence sensors but not colorimetric sensors. Figure 4 shows the differential spectrum of fluorescence elements as the responds to the VOCs vapours under different excitation light. Figure S1A‐C showed a decay in the fluorescence over a week starting 5 minutes after exposure to VOCs.
Figure 3.
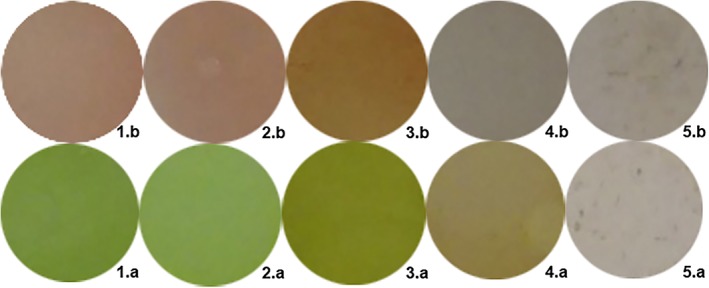
Visible colour changes of sensitive elements on the PVDF film before and after exposure to 1.9 ppm Nonanoyl chloride vapour to demonstrate the visual changes only, not the composition of the actual sensor array
Figure 4.
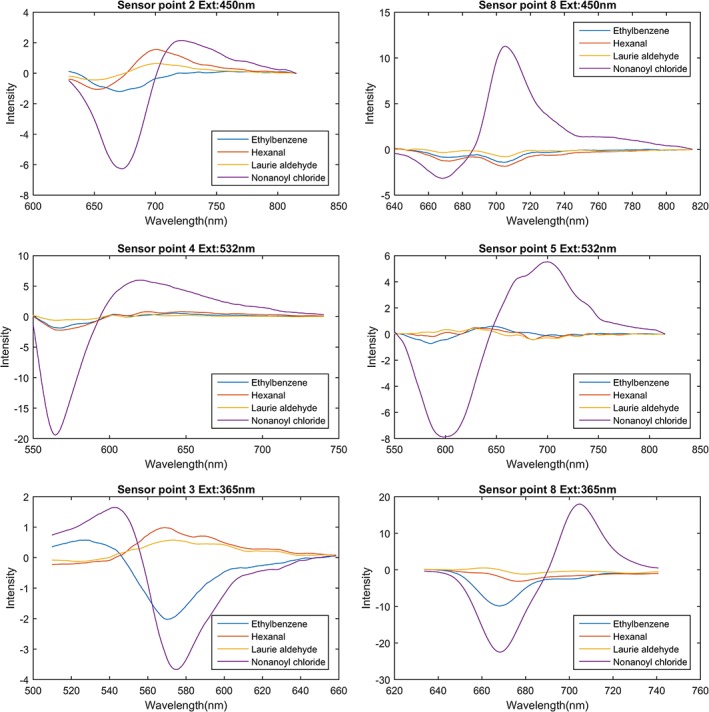
Sensor point responses to VOCs under excitation by 450‐, 532‐, and 365‐nm laser. The differential spectrum has been denoised using Savitzky‐Golay filtering
When discussing fluorescence changes, the effect of water is an unavoidable question, especially when the humidity of the environment is changing rapidly and unpredictably. Based on this, the substrate and sensitive materials were carefully selected hydrophobic materials, which can reduce the effect of water greatly and satisfy the basic requirement for urine vapour testing. To further verify the minimal effects of water to the sensitive material, a clean saturated water steam was passed through a fresh prepared sensory film under the room temperature, no detectable fluorescence shifts, or intensity changes being observed. Both the VOC biomarker tests and the urine test were carried out under the room temperature, no further heating was applied since the testing compounds are all volatility enough in the room temperature. The pH value of solution will affect the volatilisation of the VOC molecules; in other way, the pH value of the urine vapour is also an indicator of human's metabolism activities. The normal level of pH of human urine is ranged from 5.5 to 8, many studies have found that low urinary pH has positive correlation to cancer incidence and recurrence; therefore, we put a fluorescence pH indicator in our sensory film to include this important factor into analysis 43, 44, 45.
As mentioned previously, the concentrations of VOCs in human urine vapour are varied from low‐ppb to ppt level; therefore a dedicated test with similar concentration of those VOC biomarkers is necessary. Four different levels of nonanoyl chloride vapours were tested with the device and the results are shown in Figure 5. Figure 5A shows a clear discrimination grouping of 200 ppb, 100 ppb, 5 ppb, and 200 ppt of nonanoyl chloride by PLS‐DA, the degree of sample points dispersion within the group shows that at ppb level the variation between each measurements is acceptable, while down to the sub‐ppt level the variation becomes bigger and that also reflected in the spectrum Figure 5B, C, both elements 1 and 5 have weaker respond to 200 ppt of nonanoyl chloride; therefore, the PLS‐DA has more difficult to distinguish the signal from the noise, resulting in larger dispersion within the 200 ppt group.
Figure 5.
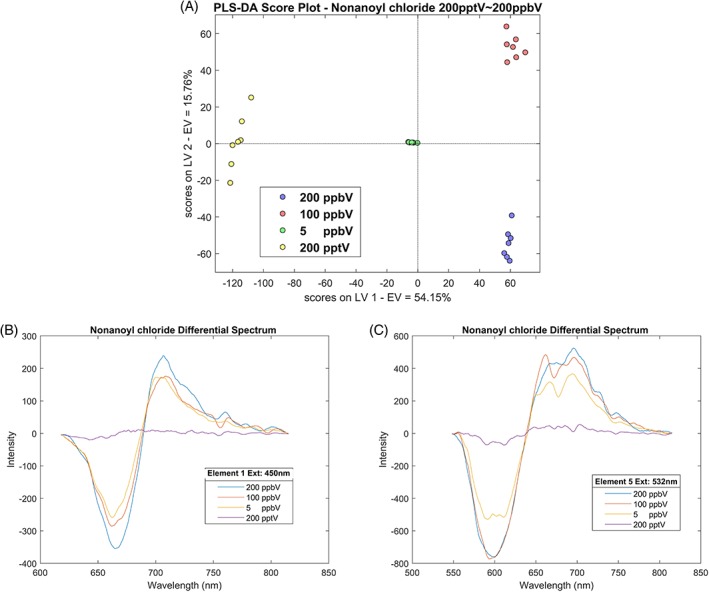
A, PLS‐DA score plot of various concentration test of nonanoyl chloride, vapour concentration: 200 ppt ~ 200 ppb, reaction time: 120 seconds, carrier gas: nitrogen. B, Differential spectrum of element 1 under 450 nm laser excitation when exposed to various concentration of nonanoyl chloride. C, Differential spectrum of element 5 under 532‐nm laser excitation when exposed to various concentration of nonanoyl chloride
3.2. Assessments of VOC biomarker detection
For preliminary assessments of VOC biomarker detection, five spectrum characteristics were extracted from each differential spectrum: maximum peak value and wavelength, minimum peak value and wavelength and peak area. For each VOC, there are 8 elements × 3 excitation lights × 5 signal characteristics = 120 characters' value for each single test. Such character extraction processes can reduce the dimensions of the data vector as well as the process time for later discrimination.
As seen in Figure 6, which revealed three discriminant functions from CDA, the first function explained 96.2% of the variance, canonical correlation is 0.998, whereas the second explained 2.1%, canonical correlation is 0.932 and the third 1.7%, canonical correlation is 0.915. In combination, these discriminant functions significantly differentiated all VOC groups, the index for describing discrete between groups, Wilk's Lambda Λ < 0.01, the χ 2 test significance under 123 degrees of freedom: χ 2 (123) = 233.71, P < 0.01, by removing the first function indicating that the second and third functions can still differentiate the four VOC groups but not significantly, Λ = 0.02, χ2 (80) = 94.07, P = 0.14. The discriminant function plot showed that the first function discriminated the nonanoyl chloride group from the other groups, and the second function differentiated the hexanal group from the remaining two groups and the third function differentiated the ethylbenzene group from the Laurie aldehyde group.
Figure 6.
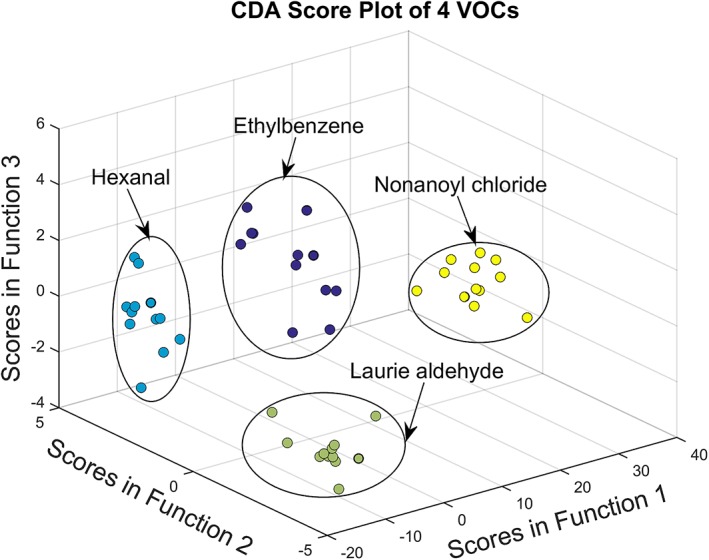
CDA score plot of VOCs test, vapour concentration: 1 ppm, reaction time: 120 seconds, carrier gas: nitrogen
The biggest advantages of CDA over the frequently used PCA are that it makes the classification under the pre‐set groups, and it focuses discrimination of the different groups by its discriminant functions rather than similarity within the groups. The discrimination function, in short, was decided based on the principle that keeping the sample variance within the group as small as possible and maintaining the variance between groups as large as possible. Such a feature makes it useful in judging the performance of the detection methods using known dataset. Successfully discriminating VOCs groups by CDA proves the fluorescence gas‐sensor array has the ability to respond to the presence of different bladder cancer‐related VOCs specifically.
3.3. Prediction model and urine test
PLS‐DA has been widely used in building prediction model in medical applications, and the properties of this discrimination method made it suitable for small sample sizes, thus it can reduce the effect of collinearity between variances.
As seen in Figure 7, the fluorescence differential spectra were employed as input datasets without the need for spectrum character extraction. This step kept more signal details but may also introduce the interference of noise and cause overfitting. Therefore, leave‐one‐out cross‐validation for all PLS‐DA model training is necessary. As found in Table 2, the overall sensitivity for VOCs testing was 77.75% with a specificity of 93.25%. The test passed the leave‐one‐out cross‐validation by satisfying the condition of both percentages of explained variances in training (R 2) and cross‐validating (Q 2) datasets being larger than 0.4. To increase the accuracy of the prediction model, one straightforward method is to increase the number of different sensory elements on the film, by doing that, more specific responding pattern can be achieved without changing the main structure of the device.
Figure 7.
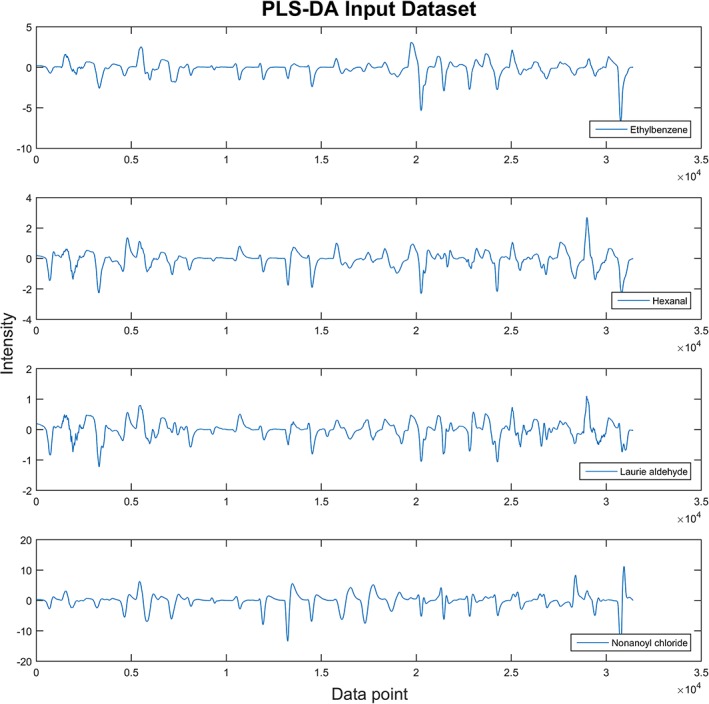
Example of input dataset for PLS‐DA prediction model, the differential spectrum of each sensory point was connected head‐to‐head and formed a consequence dataset
Table 2.
Leave‐one‐out cross‐validation results of the VOCs test prediction model made by PLS‐DA, latent variables = 3, R 2 = 0.97, Q 2 = 0.83
| VOC | Test | Specificity (%) | Sensitivity (%) |
|---|---|---|---|
| Ethylbenzene | 12 | 89 | 73 |
| Hexanal | 12 | 94 | 38 |
| Laurie aldehyde | 12 | 90 | 100 |
| Nonanoyl chloride | 12 | 100 | 100 |
For the urine tests, all five samples from bladder cancer patients group were successfully identified using CDA, although the sample size was not large enough to build the statistically significant prediction model for PLS‐DA, and the positive response of the fluorescence sensor array to the bladder cancer patients urine along with the results of VOCs test demonstrated this method has potential in clinical diagnosis application. Further research with larger numbers of participants is in progress and will be reported subsequently. Other influential factors, such as smoking, urinary tract infection, and cancer staging, are worth taking note of and will be included in our future work.
4. CONCLUSION
In conclusion, we built a novel platform for the detection of urinary bladder cancer‐related urine VOCs, and the experiments have shown that the sensitive material spotting on PVDF film can respond to the presence of bladder cancer‐related VOCs and to reflect changes in their fluorescence spectra. Further statistical analysis revealed that the prediction model can reach a high sensitivity (77.75%) and specificity (93.25%). A comprehensive system was built to perform the test automatically, through a combination of a fluorescence sensor array, computer‐controlled gas generates and process system. This was successfully evaluated employing urinary samples from patients with urinary bladder cancer. With suitable statistical tools, the system has the potential to become a cost‐effective point‐of‐care non‐invasive diagnostic method for urinary bladder cancer.
AUTHOR BIOGRAPHIES
Please see Supporting Information online.
Supporting information
Figure S1. Decay of fluorescence over time
Author Biographies
ACKNOWLEDGMENTS
The authors would like to acknowledge the support of Cheng Wei in the process of 3D printing and Limin Zhu in the process of sample handling and measurements. University of Dundee School of Medicine Urology Research Funds supported this work.
Zhu S, Corsetti S, Wang Q, Li C, Huang Z, Nabi G. Optical sensory arrays for the detection of urinary bladder cancer‐related volatile organic compounds. J. Biophotonics. 2019;12:e201800165 10.1002/jbio.201800165
REFERENCES
- 1. Darwiche F., Parekh D. J., Gonzalgo M. L., Indian J. Urol. 2015, 31, 273. [DOI] [PMC free article] [PubMed] [Google Scholar]
- 2. Chou R., Gore J. L., Buckley D., Fu R., Gustafson K., Griffin J. C., Grusing S., Selph S., Ann. Intern. Med. 2015, 163, 922. [DOI] [PubMed] [Google Scholar]
- 3. Li W., Liu H. Y., Jia Z. R., Qiao P. P., Pi X. T., Chen J., Deng L. H., Asian Pac. J. Cancer Prev. 2014, 15, 4377. [DOI] [PubMed] [Google Scholar]
- 4. Weber C. M., Cauchi M., Patel M., Bessant C., Turner C., Britton L. E., Willis C. M., Analyst 2011, 136, 359. [DOI] [PubMed] [Google Scholar]
- 5. Amann A., Costello Bde L., Miekisch W., Schubert J., Buszewski B., Pleil J., Ratcliffe N., Risby T., J. Breath Res. 2014, 8, 034001. [DOI] [PubMed] [Google Scholar]
- 6. Mills G. A., Walker V., J. Chromatogr. A 2000, 902, 267. [DOI] [PubMed] [Google Scholar]
- 7. Lei J.‐C., Hou C.‐J., Huo D.‐Q., Luo X.‐G., Bao M.‐Z., Li X., Yang M., Fa H.‐B., Rev. Sci. Instrum. 2015, 86, 025106. [DOI] [PubMed] [Google Scholar]
- 8. Wagenstaller M., Buettner A., Metabolomics 2013, 9, 9. [Google Scholar]
- 9. Schmidt K., Podmore I., J. Biomark. 2015, 2015, 16. [DOI] [PMC free article] [PubMed] [Google Scholar]
- 10. Kneepkens C. M., Lepage G., Roy C. C., Free Radic Biol Med. 1994, 17, 127. [DOI] [PubMed] [Google Scholar]
- 11. Vousden K. H., Ryan K. M., Nat. Rev. Cancer 2009, 9, 691. [DOI] [PubMed] [Google Scholar]
- 12. Okunieff P., Fenton B., Chen Y., Adv. Exp. Med. Biol. 2005, 566, 213. [DOI] [PubMed] [Google Scholar]
- 13. Gasparri R., Santonico M., Valentini C., Sedda G., Borri A., Petrella F., Maisonneuve P., Pennazza G., D'Amico A., Di Natale C., Paolesse R., Spaggiari L., J. Breath Res. 2016, 10, 016007. [DOI] [PubMed] [Google Scholar]
- 14. Nardi‐Agmon I., Abud‐Hawa M., Liran O., Gai‐Mor N., Ilouze M., Onn A., Bar J., Shlomi D., Haick H., Peled N., J. Thorac. Oncol. 2016, 11, 827. [DOI] [PubMed] [Google Scholar]
- 15. Willis C. M., Church S. M., Guest C. M., Cook W. A., McCarthy N., Bransbury A. J., Church M. R., Church J. C., BMJ (Clinical research ed.) 2004, 329, 712. [DOI] [PMC free article] [PubMed] [Google Scholar]
- 16. Cornu J.‐N., Cancel‐Tassin G., Ondet V., Girardet C., Cussenot O., Eur. Urol. 2011, 59, 197. [DOI] [PubMed] [Google Scholar]
- 17. Taverna G., Tidu L., Grizzi F., Torri V., Mandressi A., Sardella P., La Torre G., Cocciolone G., Seveso M., Giusti G., Hurle R., Santoro A., Graziotti P., J. Urol. 2015, 193, 1382. [DOI] [PubMed] [Google Scholar]
- 18. Jobu K., Sun C., Yoshioka S., Yokota J., Onogawa M., Kawada C., Inoue K., Shuin T., Sendo T., Miyamura M., Biol. Pharm. Bull. 2012, 35, 639. [DOI] [PubMed] [Google Scholar]
- 19. Španěl P., Smith D., Holland T. A., Singary W. A., Elder J. B., Rapid Commun. Mass Spectrom. 1999, 13, 1354. [DOI] [PubMed] [Google Scholar]
- 20. Khalid T., White P., De Lacy Costello B., Persad R., Ewen R., Johnson E., Probert C. S., Ratcliffe N., PLoS One 2013, 8, e69602. [DOI] [PMC free article] [PubMed] [Google Scholar]
- 21. Fuchs P., Loeseken C., Schubert J. K., Miekisch W., Int. J. Cancer 2010, 126, 2663. [DOI] [PubMed] [Google Scholar]
- 22. Ligor T., Ligor M., Amann A., Ager C., Bachler M., Dzien A., Buszewski B., J. Breath Res. 2008, 2, 046006. [DOI] [PubMed] [Google Scholar]
- 23. Kushch I., Schwarz K., Schwentner L., Baumann B., Dzien A., Schmid A., Unterkofler K., Gastl G., Spanel P., Smith D., Amann A., J. Breath Res. 2008, 2, 026002. [DOI] [PubMed] [Google Scholar]
- 24. Lindinger W., Hansel A., Jordan A., Int. J. Mass Spectrom. Ion Process. 1998, 173, 191. [Google Scholar]
- 25. Smith D., Spanel P., Mass Spectrom. Rev. 2005, 24, 661. [DOI] [PubMed] [Google Scholar]
- 26. Bernabei M., Pennazza G., Santonico M., Corsi C., Roscioni C., Paolesse R., Di Natale C., D'Amico A., Sens. Actuators B 2008, 131, 1. [DOI] [PubMed] [Google Scholar]
- 27. Horstmann M., Steinbach D., Fischer C., Enkelmann A., Grimm M.‐O., Voss A., J. Urol. 2015, 193, e560. [Google Scholar]
- 28. Oh E. H., Song H. S., Park T. H., Enzyme Microb. Technol. 2011, 48, 427. [DOI] [PubMed] [Google Scholar]
- 29. Chen S., Wang Y., Choi S., Open J. Appl. Biosensor 2013, 2, 39. [Google Scholar]
- 30. Fitzgerald J. E., Bui E. T. H., Simon N. M., Fenniri H., Trends Biotechnol. 2017, 35, 33. [DOI] [PubMed] [Google Scholar]
- 31. Heers H., Gut J. M., Hegele A., Hofmann R., Boeselt T., Hattesohl A., Koczulla A. R., Anticancer Res. 2018, 38, 833. [DOI] [PubMed] [Google Scholar]
- 32. Palmer S., Litvinova K., Rafailov E. U., Nabi G., Biomed. Opt. Express 2015, 6, 977. [DOI] [PMC free article] [PubMed] [Google Scholar]
- 33. Palmer S., Litvinova K., Dunaev A., Fleming S., McGloin D., Nabi G., Biomed. Opt. Express 2016, 7, 1193. [DOI] [PMC free article] [PubMed] [Google Scholar]
- 34. Cauchi M., Weber C. M., Bolt B. J., Spratt P. B., Bessant C., Turner D. C., Willis C. M., Britton L. E., Turner C., Morgan G., Anal. Methods 2016, 8, 4037. [Google Scholar]
- 35. Rodrigues D., Jerónimo C., Henrique R., Belo L., Bastos M. D. L., Pinho P. G. D., Carvalho M., Int. J. Cancer 2016, 139, 256. [DOI] [PubMed] [Google Scholar]
- 36. Janzen M. C., Ponder J. B., Bailey D. P., Ingison C. K., Suslick K. S., Anal. Chem. 2006, 78, 3591. [DOI] [PubMed] [Google Scholar]
- 37. Di Natale C., Salimbeni D., Paolesse R., Macagnano A., D'Amico A., Sens. Actuators B 2000, 65, 220. [Google Scholar]
- 38. Mazzone P. J., Wang X.‐F., Lim S., Choi H., Jett J., Vachani A., Zhang Q., Beukemann M., Seeley M., Martino R., Rhodes P., BMC Cancer 2015, 15, 1001. [DOI] [PMC free article] [PubMed] [Google Scholar]
- 39. Savitzky A., Golay M. J. E., Anal. Chem. 1964, 36, 1627. [Google Scholar]
- 40. Ballabio D., Consonni V., Anal Methods. 2013, 5, 3790. [Google Scholar]
- 41. Hou C., Dong J., Zhang G., Lei Y., Yang M., Zhang Y., Liu Z., Zhang S., Huo D., Biosens. Bioelectron. 2011, 26, 3981. [DOI] [PubMed] [Google Scholar]
- 42. Suslick K. S., MRS Bulletin 2004, 29, 720. [DOI] [PubMed] [Google Scholar]
- 43. Alguacil J., Kogevinas M., Silverman D. T., Malats N., Real F. X., García‐Closas M., Tardón A., Rivas M., Torà M., García‐Closas R., Serra C., Carrato A., Pfeiffer R. M., Fortuny J., Samanic C., Rothman N., Carcinogenesis 2011, 32, 843. [DOI] [PMC free article] [PubMed] [Google Scholar]
- 44. Wright M. E., Michaud D. S., Pietinen P., Taylor P. R., Virtamo J., Albanes D., Cancer Causes Control 2005, 16, 1117. [DOI] [PubMed] [Google Scholar]
- 45. Ide H., Kikuchi E., Hagiwara M., Hayakawa N., Hongo H., Miyajima A., Oya M., Ann. Surg. Oncol. 2016, 23, 1029. [DOI] [PubMed] [Google Scholar]
Associated Data
This section collects any data citations, data availability statements, or supplementary materials included in this article.
Supplementary Materials
Figure S1. Decay of fluorescence over time
Author Biographies


