

Abstract
Purpose:
Numerous “small N” studies of language ability in children who stutter have produced differing conclusions. We combined test and spontaneous language data from a large cohort of children who stutter (CWS) and typically fluent peers, gathered from independent laboratories across the US, to appraise a variety of lexical measures.
Method:
Standardized receptive and expressive vocabulary test data and spontaneous language samples from 99 pairs of CWS (ages 25 – 100 months), and age-, gender-, and SES-matched children who do not stutter (CWNS) were compared. Language sample transcripts were analyzed with four measures of lexical diversity. Correlations between lexical diversity measures and expressive vocabulary scores were also calculated.
Results:
On standardized tests of both receptive and expressive vocabulary, there were significant differences between CWS and CWNS. In contrast, on spontaneous language measures of lexical diversity, CWS did not differ in their lexical diversity, across analyses, compared to CWNS. Three of the four lexical diversity analyses, MATTR, VocD, and NDW, were significantly correlated with each other.
Conclusions:
We were able to confirm prior findings of relative disadvantage on standardized vocabulary tests for a very large sample of well-matched CWS. However, spontaneous language measures of lexical diversity did not distinguish the groups. This relative weakness may emerge from task differences: CWS are free to encode their own spontaneous utterances but must comply with explicit lexical prompts in standardized testing situations.
Keywords: Fluency, Lexical diversity, language, Stuttering
1. Introduction
1.1. Language abilities in children who stutter
A number of models that attempt to explain the underlying deficit or weakness in speech production that gives rise to stuttering hypothesize that difficulty in retrieving linguistic features of the intended utterance might play a role (Bloodstein & Bernstein Ratner, 2008). For example, the Demands and Capacities Model (Adams, 1990), the Dual Diathesis-Stressor Model (Walden et al., 2012), the Vicious Circle Model (Bernstein Ratner & Wijnan, 2006), and the Dynamic Multifactorial Model (Smith & Weber, 2017) represent but a few such proposals. Empirical support for aspects of such models has been sought in studies of the language skills of children who stutter (CWS), using a variety of measures, including standardized testing, experimental tasks, and analysis of spontaneous language characteristics of CWS.
There has been active controversy regarding whether CWS achieve lower scores than do their typically-fluent peers on tasks that measure language skills. For example, Ntourou, Conture, and Lipsey’s (2011) statistical meta-analysis of a large number of published studies concludes that they do, while Nippold’s critical review of the literature and follow-up (Nippold, 1990, 2011, 2018) conclude that they do not. Although poorer language skills are not generally argued to be a proximal cause of stuttering, various language-related factors have been proposed to influence children’s stuttering profiles. For typically fluent speakers, as well, language and fluency are intertwined; for example, it is clear to anyone who has tried to navigate a second language that fluency breakdown is but one consequence of less skilled lexical retrieval and sentence construction. Relevant to models that posit some area of linguistic difficulty within the genesis of stuttered events is the well-documented and unique feature of stuttering that, unlike other communication disorders, it has an onset after previously successful speech production has been documented. Onset of stuttering typically begins between ages 2-5 years, during a period of rapid language growth (Hall, Wagovich, & Bernstein Ratner, 2007). Stuttering typically appears after the child has demonstrated typical speech fluency, and coincides with advances in children’s language development (Watkins & Yairi, 1997).
However, both the direction and magnitude of the relationship between children’s fluency and language skills in CWS remain unclear. Some studies report depressed language abilities on a variety of measures that span standardized tests as well as spontaneous language profiles (Williams, Melrose, & Woods, 1969; Westby, 1979; Ryan, 1992; Anderson & Conture, 2000; Silverman & Bernstein Ratner, 2002; Anderson, Pellowski, & Conture, 2005; Ntourou et al., 2011; Choo, Burnham, Hicks, & Chang, 2016), while others report no differences in language abilities (Watkins & Yairi, 1997; Watts, Eadie, Block, Mensah, Reilly; 2017) and some report advanced language abilities (Watkins, Yairi, & Ambrose, 1999; Bonelli, Dixon, Bernstein Ratner, & Onslow, 2000; Watts, Eadie, Block, Mensah, & Reilly, 2015). Notably, some studies by the same research group have reached differing conclusions about language skills of the same CWS across different points in the children’s development. Even in research finding subtle differences in language abilities between CWS and fluent peers, most CWS in these published studies still score within normal limits on a variety of measures and would not be classified as having a clinically-relevant language disorder (Ntourou et al., 2011). Nippold (1990, 2010, 2012) has interpreted the body of experimental literature to suggest that language skills are not notably different in CWS and appropriately-matched typical peers; in contrast, we would argue that group findings of subtle weaknesses in language among CWS, while not in the clinical range, appear to be robust across multiple studies, groups, and language tests/tasks.
As Nippold (1990, 2010, 2012) has noted, matching of participants between groups is key; not all studies comparing the language skills of CWS and CWNS have sought to match participants on potentially important variables such as age, gender, and socioeconomic status (SES). Age and vocabulary skill are clearly related (i.e., vocabulary skills develop with age), requiring age-matching between experimental and control groups. With regard to gender and SES, a somewhat more recent literature has shown marked differences for these variables, across multiple methods of vocabulary assessment. For example, advantages in vocabulary development are seen early in girls, across as many as ten language communities that include English (Eriksson et al., 2012), and these advantages grow more pronounced with age (Frank, Braginsky, Yurovsky, & Marchman, 2017). More critically, SES impacts vocabulary learning and use, as assessed by all the types of instruments or sampling measures we discuss; valid measurement of vocabulary use and word learning across SES groups is now considered so critical (see comprehensive review by Schwab & Lew-Williams, 2016) that there are calls to replace traditional vocabulary testing in education and speech-language pathology with novel word learning tasks in order to avoid classifying some groups of socioeconomically-disadvantaged children as clinically language-impaired (e.g., Levine et al., 2018; Golinkoff, Hoff, Rowe, Tamis- LeMonda, & Hirsh- Pasek, 2019), and staving off what is now viewed as the public health hazard of “the word gap.”
1.2. Vocabulary skills of CWS on standardized tests
This study focuses on the lexical performance of CWS, as measured in a number of ways, including vocabulary performance on standardized tests. Table 1 provides details of some prior studies of this type. As noted earlier, Ntourou et al. (2011) performed a statistical meta-analysis of 22 studies conducted after 1990 with participants between 2 and 8 years of age who had all been assessed using norm-referenced language tests or language sampling tasks. As pertains to this study, they found that CWS obtained significantly lower scores on norm-referenced tests of both receptive and expressive vocabulary.
Table 1.
Lexical skills of CWS: Standardized vocabulary tests
| Authors | Participants | Methods | Results |
|---|---|---|---|
| Westby (1979) | 10 CWS 10 disfluent CWNS 10 CWNS |
PPVT | CWS had lower scores |
| Williams et al. (1969) | 100 CWS 300 CWNS |
Iowa Tests of Basic Skills | CWS had lower scores, but wide variability |
| Ryan (1992) | 20 CWS 20 CWNS |
PPVT | No difference |
| Anderson and Conture (2000) | 20 CWS 20 CWNS |
PPVT | CWS had lower scores |
| Silverman and Bernstein Ratner (2002) | 15 CWS 15 CWNS |
PPVT, EVT | No difference on PPVT CWS had lower scores on EVT |
| Anderson et al. (2005) | 45 CWS 45 CWNS |
PPVT | No difference |
| Coulter et al. (2009) | 85 CWS 85 CWNS |
PPVT, EVT | CWS had lower scores |
| Ntourou et al. (2011) | 22 studies Ages 2-8 |
PPVT, EVT | CWS had lower scores |
| Richels et al. (2013) | 159 CWS 138 CWNS |
PPVT, EVT, TELD | No difference |
| Millager (2014) | 40 CWS 46 CWNS |
PPVT, EVT | No difference |
| Choo et al. (2016) | 66 CWS 53 CWNS |
PPVT, EVT | CWS had lower scores |
Studies of vocabulary test performance have employed a range of standardized, norm-referenced instruments, including various editions of the Peabody Picture Vocabidary Test (e.g., PPVT-R; Dunn & Dunn, 1981), Expressive Vocabidary Test (EVT; Williams, 1997), Receptive One-Word Picture Vocabidary Test (Brownell, 2000a), and Expressive One-Word Picture Vocabidary Test (Brownell, 2000b). In addition, a study by Reilly et al. (2009) employed a parental report instrument of vocabulary, the MacArthur-Bates Communicative Development Inventories (MCDI; Fenson, Dale, & Reznick, 1993). As can be readily observed from Table 1, studies have differed in their outcomes. Despite these differences, when CWS performed worse on vocabulary measures than did CWNS, they still scored within the normal range on all measures. This suggests that, even when differences are reported, CWS do not present as having language impairment, but rather as having relatively subtle differences in their ability to recognize lexical items or retrieve specific lexical terms.
One potential reason for the differences in outcomes across studies that compare vocabulary skills of CWS and CWNS is that different standardized assessments operationally define and measure vocabulary knowledge differently. Parental report measures, such as the MCDI, are used in relatively fewer studies, because such measures lose both practicality and validity past a relatively young age, such as 2-3 years. However, these measures require parents to, in essence, report the totality of words that they believe the child knows and uses in everyday communication. Such an estimate of total vocabulary knowledge is not feasible for more mature speakers, thus requiring us to sample either specific lexical items or richness of lexical diversity, as proxies for lexical retrieval/comprehension skills. Thus, the more commonly-employed standardized tests (e.g., EVT, PPVT, or vocabulary subtests of overall language batteries) either elicit naming of items/concepts (confrontation naming), or measure comprehension of lexical labels. In either case, the specific vocabulary items used as prompts are meant to sample the number and types of words children use or recognize at given ages.
A second reason for differences observed across studies is that some studies have employed control groups of CWNS (e.g., Anderson et al., 2005), whereas others made comparative statements in the absence of matched controls. As noted in the section above, studies varied in the extent to which participants were matched (e.g., matching on SES). In addition, some studies had inclusion requirements that participants score within normal limits on language screening tests (e.g., Coulter et al., 2009), while others had no such criteria.
Scores among commonly used vocabulary tests such as the EVT and PPVT are known to correlate closely (Gray, Plante, Vance & Henrichsen, 1999), as well as differ significantly (with reasonably large effect sizes) between groups of children believed to have typical versus impaired language skills. Of the two, the EVT is, thought to disadvantage child test-takers less on the basis of the child’s family income, educational experience and dialect community (Restrepo et al., 2006). On the other hand, Rice and Hoffman (2015) tracked PPVT performance between ages 2;6 and 21 years and found performance to be extremely stable over time, suggesting that it taps a valid feature of language knowledge. Thus, in spite of their respective weaknesses, standardized vocabulary tests do seem to tap a larger construct that maps to ease of children’s learning and use of the lexicon of their language.
1.3. Measuring lexical diversity in spontaneous language
In contrast to vocabulary tests, which estimate one’s knowledge of vocabulary, language sample analyses of lexical diversity are designed to show the variety or mix of vocabulary items that a speaker uses in typical conversation (e.g., analyzing the number of different words within a speech sample); lexical diversity measures presume that more mature and sophisticated users can pull from a larger variety of words within the language, while less mature or restricted speakers need to “recycle” or reuse more words in conversation.
Lexical diversity is calculated in a number of different ways, and it is currently unclear whether any one of them has superior psychometric properties or is most valid for purposes of research or clinical assessment. The oldest measure, at one time the gold standard in lexical diversity measurement, is type-token ratio (TTR; Templin, 1957). TTR ranges from 0 – 1, with higher values representing greater lexical diversity, or more advanced lexical skill. Most current researchers do not find TTR to be a reliable or valid measure of lexical skills in children (Hess, Haug, & Landry, 1989; Hess, Ritchie, & Landry, 1984; Richards, 1987; Malvern & Richards, 1997; Malvern, Richards, Chipere, & Duran, 2004; Koizumi & In’nami, 2012; Bernstein Ratner & MacWhinney, 2016). First, it may not align with the same children’s performance on standardized vocabulary comprehension or production measures (Hess et al., 1984). Second, TTR does not appear to show the expected developmental trajectory of higher values across development and maturation (Bernstein Ratner and MacWhinney, 2016). Sample length also influences TTR values (Hess et al., 1989; Tommerdahl & Kilpatrick, 2013; Tommerdahl & Kilpatrick, 2014).
To avoid such effects, number of different words (NDW) in a 100-word sample (Miller, 1991; Klee, 1992) can be used. Klee (1992) found that NDW was able to discriminate between typically-developing children and those with specific language impairment and found that children demonstrate growth in NDW over childhood. Ukrainetz and Blomquist (2002) found reasonable correlation between 28 preschoolers’ EVT scores and NDW. NDW has been used in at least three studies of CWS and peers, with differing results (Watkins & Yairi, 1997; Watkins et al., 1999; Bonelli et al., 2000).
However, Malvern et al. (2004) noted several additional problems with NDW. As with TTR, the number of different words in a sample depends on the size of the sample. Therefore, sample length standardization is important (i.e., truncating samples so that all contain the same total number of words). A disadvantage of this approach is that it is difficult to ascertain when exactly to cut the sample to maximize the informativeness of the measure. Moreover, these procedures require that language sample data be discarded in order to truncate all samples to a prescribed length. Removing language sample data from consideration is inherently problematic; Malvern and colleagues found, in computing NDW at different points within a sample, that results differed significantly, depending on the part of the sample in which NDW was computed.
In order to overcome these problems with TTR and NDW, McKee, Malvern and Richards (2000) developed VocD, a program that measures vocabulary diversity while taking language sample size into account. Specifically, VocD, part of the open-access CLAN software utilities (MacWhinney, 2000), uses a mathematical algorithm to calculate vocabulary diversity. It first samples random groups of words from a transcript 100 times to produce a curve of the TTR against tokens. Then, it finds a best fit between this curve and theoretical curves calculated by the model, by computing the probability of new vocabulary being introduced into progressively longer samples. Final values range from 10 to 100, with higher values indicating greater diversity. VocD has been used in only one published comparative study of CWS and CWNS to date, where it correlated with standardized measures of expressive vocabulary in matched samples of CWS and CWNS, while TTR values did not (Silverman & Bernstein Ratner, 2002).
Some have found, however, that VocD is not reliable on very small (Owen & Leonard, 2002; Koizumi & In’nami, 2012) or very large (McCarthy & Jarvis, 2010; Fergadiotis, Wright, & Green, 2015) samples. Most lexical diversity measures caution against use on samples under 200 tokens. Used with more moderate samples that exceed 200 tokens, VocD has revealed a clear growth trajectory over childhood (Bernstein Ratner & MacWhinney, 2016), and general utility across varying SES groups (Lai & Schwanenflugel, 2016).
A new alternative to VocD, MATTR (Moving-Average Type-Token Ratio), has been shown to be valid and reliable, even on large samples (Covington & McFall, 2010; Fergadiotis, Wright, & West, 2013; Fergadiotis et al., 2015). MATTR calculates the lexical diversity of a sample using a moving window that estimates TTRs for each successive window of fixed length. MATTR has been demonstrated to be even less influenced by sample size than VocD and appears to be more reliable than most other measures (Fergadiotis et al., 2013, 2015). However, with clinical populations, this measure has been used mainly to explore lexical diversity in individuals with aphasia. To date, we know of no published MATTR computations on child data or with data of speakers who stutter.
1.4. Conversational lexical diversity in CWS
All of the lexical diversity measures we have reviewed have been employed to study CWS, with the exception of MATTR. Table 2 provides details of these studies. To highlight some key findings within this body of work, Watkins and Yairi (1997) examined spontaneous language of 32 CWS. CWS were found to use an average or slightly higher number of different words (NDW) than the normative data (Leadholm & Miller, 1992) to which the children were compared, with more lexical variability among the CWS who persisted in their stuttering, rather than recovered. However, after adding 84 more CWS to later analyses, Watkins et al. (1999) found no significant difference in NDW between the CWS and Leadholm and Miller norms; a matched comparison group was not employed for these studies. Also using NDW, Bonelli, Dixon, Bernstein Ratner, and Onslow (2000) examined 9 Australian CWS and found that all NDW values in spoken language were within expected range according to Templin’s (1957) norms. In contrast, Silverman and Bernstein Ratner (2002) found that American CWS did not differ from age-, gender-, and SES-matched peers on TTR, but obtained lower scores using VocD computations derived from their spontaneous language samples. More recently, Leech, Bernstein Ratner, Brown, and Weber (2017) found that, while growth in conversational syntax (as indexed by IPSYN) predicted recovery from childhood stuttering, vocabulary growth (as measured by VocD), did not.
Table 2.
Lexical Diversity (LD) of CWS: Spontaneous Conversation
| Authors | Participants | Methods | Results |
|---|---|---|---|
| Watkins and Yairi (1997) | 32 CWS | NDW | CWS had higher LD |
| Watkins et al. (1999) | 84 CWS | NDW | No difference |
| Bonelli et al. (2000) | 18 CWS | NDW | No difference |
| Silverman and Bernstein Ratner (2002) | 15 CWS, 15 CWNS | TTR, VocD | No difference on TTR; CWS had lower LD on VocD |
As is the case with studies of standardized vocabulary measures, studies of vocabulary use within the context of language samples have revealed varied findings, likely due to differences in method and the type of lexical analysis employed. Decisions related to between-group matching variables and participant inclusion criteria impact findings, as well as the decision to have a matched comparison group, versus comparing CWS to available normative data. Of importance, however, the differences observed in findings across studies are likely also due to the different types of lexical measures employed across studies. Therefore, we take the approach in this study of conducting each of the aforementioned lexical analyses, to enable a richer understanding of the ways in which each analysis measures the construct of lexical diversity.
1.5. Purpose of the study
The primary goal of this study was to compare lexical profiles of CWS using a large cohort close to stuttering onset and typically-fluent peers matched on age, gender, and SES. Of importance, our sample consists of data from children across 6 labs within the US, arguably increasing the generalizability of findings relative to studies of children drawn from a single community. Such a data-sharing approach is fairly unique in the field of stuttering research. We hypothesized that CWS would demonstrate lower scores on standardized tests of vocabulary and on measures of lexical diversity derived from their conversational speech samples, than their peers. A secondary goal of the study was to explore children’s profiles across lexical diversity measures, while also evaluating the concurrent validity of a new measure, MATTR, in relation to other, more established measures of the construct. Virtually no studies exist that have reported on multiple analyses of lexical skill in the same cohort of CWS. Finally, we examine the relationships between lexical diversity measures and expressive vocabulary test scores, to evaluate the extent to which lexical diversity in spontaneous language corresponds to children’s ability to demonstrate vocabulary knowledge through formal testing. Beyond offering more power than previous studies, this approach is also relatively rare in prior work examining language skills of CWS.
2. Methods
2.1. Participants
The total number of participants was 198 (99 CWS and 99 CWNS), derived by pooling data from several previous investigations, all of which were carried out by separate laboratories in multiple locations across the United States (Silverman & Bernstein Ratner, 2002; Leech et al., 2017; Choo et al., 2016; Wagovich, Hall, & Clifford, 2009; Wagovich & Hall, 2018; Hall, Higgins, et al., 2007; Johnson, Karrass, Conture, & Walden, 2009; Hakim & Bernstein Ratner, 2004). Data were gathered using conventional consent procedures at each primary site, but de-identified scores and language sample transcripts were pooled for the analyses reported here.
Participants from Silverman and Bernstein Ratner (2002) were recruited by flyers in pediatricians’ offices in the greater Washington D.C. area. Those from Leech et al. (2017) were recruited from Purdue University and University of Iowa as part of the Purdue Stuttering Project. Those from Choo et al. (2016) were recruited through the Speech Neurophysiology Lab at Michigan State University as part of a longitudinal study examining neurodevelopmental correlates of stuttering. Those from Wagovich et al. (2009; Wagovich & Hall, 2018) were recruited through a University of Missouri community e-mail bulletin and from community daycares. Those from Hall, Higgins, et al. (2007) were recruited, in part, for a Master’s student’s thesis project, and by using flyers posted in area child care centers. Participants from Johnson et al. (2009) were recruited through the Vanderbilt University Developmental Stuttering Research Project. Finally, participants from Hakim and Bernstein Ratner (2004) were recruited from the greater Washington, D.C. area using flyers and other advertisements.
While most studies had pair-matched samples, not all studies had equally matched cohorts, leading to a “surplus” of 20 CWS without individual matched pairs. Twenty CWNS were identified from the CHILDES archive (Ellis Weismer, Venker, Evans, & Moyle, 2013; Warren-Leubecker & Bohannon, 1984; Dickinson & Tabors, 2001) in order to pair-wise match a small proportion of unmatched CWS to fluent peers similar in gender, age, and SES (middle-income). These CHILDES corpora were chosen because they contained typically-developing children engaged in toy play, similar to elicitation procedures for all of the CWS samples. All data were de-identified and demographic features (e.g., group, SES) were anonymous to the first author.
As noted, all pairs were matched by age (within 3 months), gender, and SES (mother’s level of education). CWS had an average age of 51 months, with a range of 25 to 100 months. CWNS had an average age of 50 months, with a range of 28 to 100 months. There were 70 male pairs and 29 female pairs. All pairs were matched on maternal education, such that there was no significant difference between groups in years of maternal education, a major determinant of lexical outcomes for children (Vernon-Feagans, Bratsch-Hines, Reynolds & Willoughby, 2019). For all children examined in this study, there was no history of speech or language disorders other than stuttering. All CWS across studies met a criterion of at least 3% stutter-like disfluencies in their spontaneous language samples and ranged from very mild to very severe, as calculated by percent stuttered syllables (Silverman & Bernstein Ratner, 2002; Choo et al., 2016), parent and speech-language pathologist report (Leech et al., 2017; Leech, Bernstein Ratner, Brown, & Weber, 2019), or SSI-3 (Wagovich et al., 2009; Wagovich & Hall, 2018; Johnson et al., 2009; Hakim & Bernstein Ratner, 2004).
Some of these studies originally only examined lexical diversity in spontaneous language, others only examined lexical skills on standardized vocabulary tests, and others examined both. One hundred and fifty-two participants (76 pairs of CWS and CWNS) were eligible to be included in the lexical diversity analysis: 22 pairs of females and 54 pairs of males with an average age of 53 months (range of 25 to 79 months). One hundred participants (50 pairs of CWS and CWNS) could be included in the statistical analysis of vocabulary test scores: 14 pairs of females and 36 pairs of males, with an average age of 48 months (range of 29 to 100 months). Fifty-four participants (27 pairs of CWS and CWNS) could be included in the correlational analyses of lexical diversity and standardized vocabulary tests: 7 pairs of females and 20 pairs of males with an average age of 48 months (range of 29 to 68 months). Participant characteristics are summarized in Table 3.
Table 3.
Participant Data
| Corpus | Total # of pairs | # of female pairs | # of male pairs | # of pairs with CWNS from CHILDES archive | Age range (months) | # of pairs used in spont. lang analysis | # of pairs used in stand. test analysis | # of pairs used in correl. analysis |
|---|---|---|---|---|---|---|---|---|
| Bernstein Ratner (Silverman & Bernstein Ratner, 2002) | 20 | 2 | 18 | 8 | 28 – 46 | 20 | 7 | 7 |
| Purdue (Leech et al., 2017) | 27 | 8 | 19 | 8 | 44 – 79 | 27 | 0 | 0 |
| Michigan (Choo et al., 2016) | 24 | 9 | 15 | 4 | 36 – 68 | 24 | 20 | 20 |
| Wagovich & Hall (Wagovich et al., 2009; Hall, Higgins, et al., 2007) | 5 | 3 | 2 | 0 | 25 – 44 | 5 | 0 | 0 |
| Vanderbilt (Johnson et al., 2009) | 15 | 6 | 9 | 0 | 39 – 65 | 0 | 15 | 0 |
| Hakim (Hakim & Bernstein Ratner, 2004) | 8 | 1 | 7 | 0 | 49 – 100 | 0 | 8 | 0 |
| Total | 99 | 29 | 70 | 20 | 25 – 100 | 76 | 50 | 27 |
2.2. Language samples
Language samples of clinician-child interactions (Choo et al., 2016; Wagovich et al., 2009; Wagovich & Hall, 2018; Hall, Higgins, et al., 2007), parent-child interactions (Warren-Leubecker & Bohannon, 1984; Ellis Weismer et al., 2013; Dickinson & Tabors, 2001) or clinician-child and parent-child interactions (Silverman & Bernstein Ratner, 2002; Leech et al., 2017) were obtained while participants were engaged in toy play. Original conversations were recorded on videotape and audiotape; language samples were then transcribed using CHAT (MacWhinney, 2000).
2.3. Language testing
Participants from Silverman and Bernstein Ratner (2002) completed the Peabody Picture Vocabulary Test – Revised (PPVT-R; Dunn & Dunn, 1981) and Expressive One-Word Picture Vocabulary Test – Revised (EOWPVT-R; Gardner, 1990). Participants from Choo et al. (2016) completed the Peabody Picture Vocabulary Test (PPVT-4; Dunn & Dunn, 2007) and Expressive Vocabidary Test-Second Edition (EVT-2; Williams, 2007). Participants from Johnson et al. (2009) completed the Expressive Vocabulary Test (EVT; Williams, 1997) and Peabody Picture Vocabulary Test (PPVT-3; Dunn & Dunn, 1997). Participants from Hakim and Bernstein Ratner (2004) completed the picture vocabulary subtest and oral vocabulary subtest of the Test of Language Development-Primary (TOLD P-3) (Newcomer & Hammill, 1997). Wagovich et al. (2009; also see Wagovich & Hall, 2018) used the Receptive One-Word Picture Vocabulary Test (ROWPVT; Brownell, 2000a) and the Expressive One-Word Picture Vocabulary Test (EOWPVT; Brownell, 2000b).
2.4. Analysis
2.4.1. Vocabulary tests
Standardized test scores were collected from original researchers’ data records. Since studies used different standardized tests, scores were grouped by receptive vocabulary (PPVT and ROWPVT, picture vocabulary subtest of the TOLD P-3), and expressive vocabulary (EVT, EOWPVT, oral vocabulary subtest of the TOLD P-3). All scores were converted into standard scores and z-scores. Expressive and receptive vocabulary standard scores were compared between the two groups using an independent samples t test with group membership as the independent variable and standard scores as the dependent variable. Additionally, summed expressive and receptive vocabulary z-scores were compared between the two groups using an independent samples t test with group membership as the independent variable and z-scores as the dependent variable.
2.4.2. Lexical diversity in spontaneous language
Lexical diversity was computed by morphological root (e.g., “cats” and “cat” are considered the same word). NDW, TTR/TTR50, VocD, and MATTR of the 76 pairs were analyzed using CLAN utilities (MacWhinney, 2000). NDW was calculated from the first 100 words in each sample. TTR50 was calculated on roughly the middle 50 utterances of each sample, as advised (Miller, 1981; Retherford, 2000; Silverman & Bernstein Ratner, 2002). Analysis of TTR50 was started at the 50th utterance for all transcripts, with the exception of 3 transcripts that were started at the 5th utterance (because they had only 58 utterances), 4 transcripts that were started at the 10th utterance (because they were between 62 and 68 utterances long), 4 transcripts that were started at the 15th utterance (because they were between 71 and 78 utterances), 11 transcripts that were started at the 25th utterance (because they were between 80 and 99 utterances), and 4 transcripts that included the entire sample in the analysis (because they were less than 50 utterances in length). Thus, a total of 26 samples were analyzed starting at points other than the 50th utterance.
TTR of the entire sample was also calculated in comparison to TTR50, which locks the sample window at 50 utterances. VocD was calculated on the entire sample, as results tend to be similar to those obtained with smaller subsets (McKee et al., 2000; Silverman & Bernstein Ratner, 2002). MATTR was calculated using a successive window of 50 words, because this moving window has been shown to be the most reliable and valid indicator of lexical diversity in adults with aphasia (Fergadiotis, 2011). There were 2 CWNS who were not included in the NDW analysis due to samples containing fewer than 100 words.
2.4.3. Analysis of lexical diversity between groups
For NDW and VocD, an independent samples t test was applied, with group membership as the independent variable and NDW/VocD as the dependent variable. Because three of the five lexical measures (TTR, TTR50, and MATTR) violated numerous assumptions of normality (Shapiro-Wilk), homogeneity of variance (Skewness, Kurtosis, Omnibus testing, including within-group distributions), those comparisons were conducted using the Mann-Whitney U test.
2.4.4. Relationships among lexical diversity measures and expressive vocabulary test scores
Correlations among the lexical diversity measures (NDW, TTR, TTR50, VocD, MATTR) and standardized measures of expressive vocabulary were computed to determine the strength of the relationships between lexical diversity analyses and expressive vocabulary knowledge. Spearman rank order correlations were obtained, as the various scores were spread among diverging value scales. Both sets of correlational analyses were intended to explore aspects of concurrent validity across the lexical analyses.
3. Results
We discuss results in order of the study goals: (a) to compare lexical profiles of CWS and peers on standardized tests of receptive and expressive vocabulary and on measures of lexical diversity derived from their conversational speech samples; and (b) to evaluate the extent to which lexical diversity analyses relate to expressive vocabulary test scores, exploring concurrent validity of a newer measure of lexical diversity in relation to other measures of the same construct.
3.1. Standardized vocabulary test performance of CWS and CWNS
Independent samples t tests with group membership as the independent variable and standard scores and z-scores as the dependent variables were conducted for the 50 pairs of CWS and CWNS who had formal test results. As Figure 1 displays, scores of CWS were significantly lower than CWNS on both receptive and expressive vocabulary tests. For expressive standard scores, the CWS achieved a mean score of 108.16, while the CWNS had a mean score of 117.42, t(98) = −3.56, p = 0.00057; d = .712 (medium-to-large effect). Expressive z-scores yielded an average of 0.576 for CWS and an average of 1.21 for CWNS, t(98) = −3.68, p = 0.00039; d = .397 (small effect), a difference of almost one standard deviation.
Figure 1:
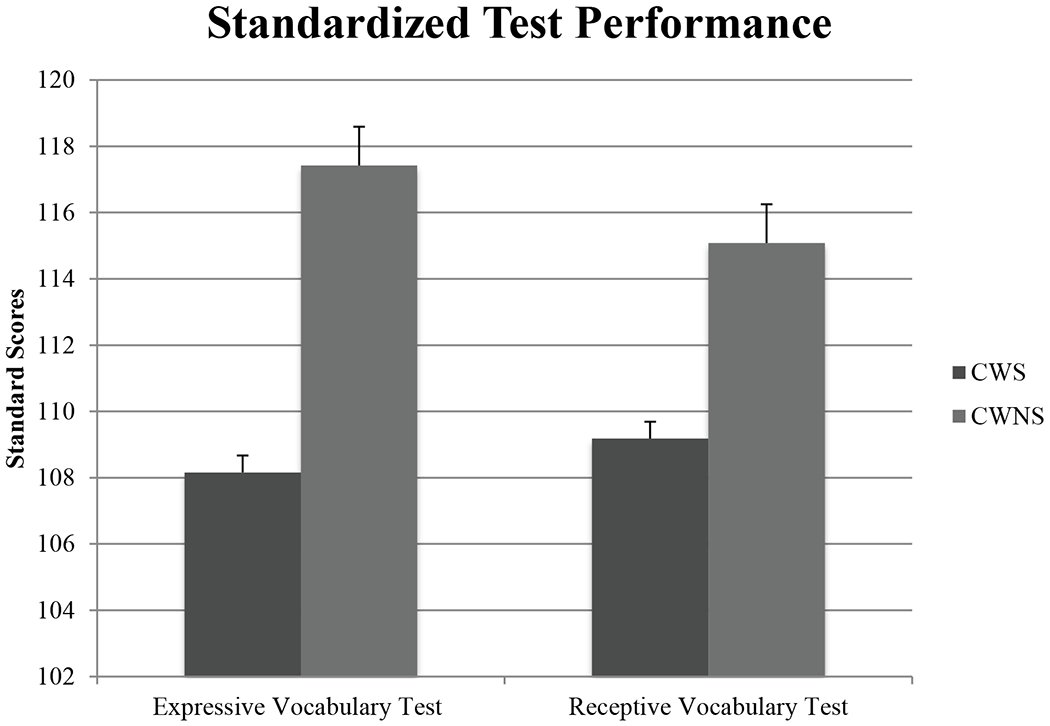
Standardized test performance
The mean receptive standard score of the CWS was 109.18, while that of the CWNS was 115.08, t(98) = −2.02, p = 0.045; d = .405, small effect. The average receptive z-scores of the CWS was 0.65, while that of the CWNS was 1.038, t(98) = −1.99, p = 0.049, d = .399, small effect. Most participants performed above the test mean of 100 on the standardized measures, which could be because the majority of the participants were from higher SES backgrounds, although SES had been balanced in individual studies. Additionally, numerous studies had excluded CWNS participants who did not perform within normal limits on language measures.
3.2. Lexical diversity in spontaneous language of CWS and CWNS
Unlike our comparisons of standardized test results, in which the children had been tested using different standardized measures, all language sample data were analyzed using identical procedures. Thus, raw scores were used for this set of analyses. For comparisons, we set alpha at p = 0.005 after correcting for multiple comparisons among the varied measures (i.e., Bonferroni adjustment: .05 divided by 10 analyses, resulting in p value of 0.005). Independent samples t tests were used to compare the two groups’ NDW and VocD values. Mann-Whitney U tests were used to compare the two groups’ TTR, TTR50, and MATTR, due to lack of homogeneity of variance both within and across groups on features such as kurtosis and skewness, and omnibus testing of distribution normality, as discussed earlier. As Table 4 displays, contrary to the hypothesis, the mean number of different words (NDW) for CWS (50.89) and CWNS (50.66) did not differ, t(148) = 0.19, p = 0.85. Similarly, VocD in samples from the CWS (64.23) and the CWNS (66.46) did not differ, t(150) = −0.66, p = 0.51. Type-token ratio (TTR) was also not significantly different between the CWS (0.26) and CWNS (0.27), Z = −1.85, p = 0.06. Moreover, the type-token ratio of the middle 50 utterances (TTR50) was not significantly different between the CWS (0.48) and CWNS (0.49), Z = −1.42, p = 0.16. Finally, the MATTR between the groups was not significantly different between the CWS (0.67) and CWNS (0.68), Z = −0.43, p = 0.67.
Table 4.
Mean lexical diversity for CWS and CWNS across measures
| Group | TTR | TTR50 | NDW | VocD | MATTR |
|---|---|---|---|---|---|
| CWS | 0.26 (SD = 0.09) |
0.48 (SD = 0.07) |
50.89 (SD = 7.83) |
64.23 (SD = 19.10) |
0.67 (SD = 0.06) |
| CWNS | 0.27 (SD = 0.08) |
0.49 (SD = 0.07) |
50.66 (SD = 7.26) |
66.46 (SD = 22.37) |
0.68 (SD = 0.06) |
The CWS, on average, had samples containing more utterances, although after Bonferroni adjustment, the difference was not significant, t(150) = 2.51, p = 0.013. CWS samples had an average of 217 utterances, while the CWNS had a mean of 176 utterances. CWS also tended to produce more words, but this difference was not significant, t(150) = 1.71, p = 0.09. CWS had an average of 847 words while the CWNS had an average of 713. CWS and CWNS displayed similar MLU values (CWS = 4.165; CWNS = 4.166).
3.3. Associations between lexical diversity in spontaneous language and expressive vocabulary knowledge
A correlation matrix was constructed to estimate possible relationships among lexical diversity measures and expressive vocabulary standard scores. Examination of inter-relationships was undertaken to estimate concurrent validity of MATTR in relation to other measures of lexical diversity and expressive vocabulary testing. For this analysis, we set alpha at p = 0.005 after correcting for the 10 multiple comparisons using the Bonferroni procedure. As depicted in Table 5, VocD and NDW, r(52) = 0.45, p = 0.0008, VocD and MATTR, r(52) = 0.72, p < 0.0000001, and NDW and MATTR, r(52) = 0.62, p = 0.000001, demonstrated significant relationships. Two additional correlations only approached significance, given the Bonferroni correction: the correlation between MATTR and TTR50, r(52) = 0.29, p = 0.03, and between TTR and TTR50, r(52) = 0.37, p = 0.0067.
Table 5.
Correlations among lexical diversity measures
| Overall TTR | NDW100 | VocD | MATTR | |
|---|---|---|---|---|
| NDW100 | r = 0.13 p = 0.34 |
|||
| VocD | r = −0.09 p = 0.51 |
r = 0.45* p = 0.00008 |
||
| MATTR | r = 0.25 p = 0.007 |
r = 0.62* p = 0.000001 |
r = 0.72* p = <0.00001 |
|
| TTR50 | r = 0.37 p = 0.007 |
r = −0.01 p = 0.93 |
r = 0.13 p = 0.37 |
r = 0.29 p = 0.03 |
= significant at 0.005
Following Bonferroni correction, none of these lexical diversity measures correlated significantly with expressive vocabulary standard scores; the closest relationship was observed for TTR50 and expressive vocabulary, not significant after correction for multiple tests, r(52) = 0.34, p = 0.01. There was also a positive correlation between MATTR and expressive vocabulary standard scores that approached but did not meet the unadjusted criteria for significance, r(52) = 0.23, p = 0.09. Thus, we cannot be confident that lexical diversity measures tap the same construct as expressive vocabulary test scores. The correlation matrix is shown in Table 6.
Table 6.
Correlations between lexical diversity measures and expressive vocabulary
| Overall TTR | NDW | MATTR | TTR50 | VocD | ||
|---|---|---|---|---|---|---|
| Expressive Vocabulary SS | Correlation (r) | 0.004 | 0.001 | 0.23 | 0.34 | 0.12 |
| p-value | 0.98 | 0.99 | 0.09 | 0.01 | 0.40 |
4. Discussion
The primary goal of this study was to compare lexical skills of CWS and matched peers both in spontaneous language and on standardized vocabulary tests. This study used a large sample of matched pairs from datasets across numerous, distinct research groups. Because of the wide range of lexical diversity measures used within the extant literature, a secondary goal of this study was to assess the concurrent validity of MATTR, a newer measure of lexical diversity, against other measures of lexical diversity in spontaneous language. Finally, we explored relationships between lexical diversity measures and expressive vocabulary test scores, to assess the extent to which lexical diversity relates to expressive vocabulary knowledge.
4.1. Performance on Standardized Tests of Vocabulary Knowledge
A significant difference was found between CWS and CWNS on expressive and receptive vocabulary scores. These findings are consistent with the meta-analysis by Ntourou and colleagues (2011), which also revealed between group differences in vocabulary scores across the studies included in their analysis. Related to expressive vocabulary in particular, the CWS in our study performed, on average, almost a full standard deviation lower than the CWNS on the expressive vocabulary tests they were given, across the studies in which they participated. This finding is interesting because three different vocabulary tests were used across studies, but CWS demonstrated significantly lower expressive and receptive vocabulary scores on such tasks. Because we examined a varied age group, it appears that these differences are present from close to stuttering onset until age eight.
Only two studies to date have found lesser performance of CWS on both expressive and receptive vocabulary, as measured by standardized tests (Coulter et al., 2009; Choo et al., 2016). Similar to our study, these studies both employed a large number of participants (85 pairs, Coulter et al.; 66 CWS and 53 CWNS, Choo et al.). It should be cautioned that 20 pairs from Choo et al. were used in this analysis, making up almost 50% of the sample, so it is not notable that we found similar results.
Use of overlapping datasets is common in the study of clinical populations. For example, we note that Coulter et al. (2009) employed 45 pairs from Anderson et al. (2005). Potential differences in findings between studies with overlapping samples but differing sample sizes attests to the importance of statistical power through large sample sizes, and perhaps more frequent data pooling across laboratories in order to draw robust conclusions about language skills in CWS.
Consistent with previous research, both the CWS and CWNS groups fell within the average range on vocabulary test scores. This finding supports the notion that most CWS are not language-impaired, per se, but instead may display fairly subtle language differences from typically fluent peers. In fact, only two CWS performed more than one standard deviation below the mean on any of the analyses, and these scores were on a receptive vocabulary test.
4.2. Lexical diversity in spontaneous language
Contrary to our hypothesis, the CWS did not differ in the lexical diversity of their spontaneous language samples when compared to CWNS. This is consistent with some previous literature, which found no differences on NDW or TTR between CWS and CWNS (Watkins & Yairi, 1997; Watkins et al., 1999; Silverman & Bernstein Ratner, 2002). However, the findings are in contrast to those of Silverman and Bernstein Ratner (2002), who found significantly reduced lexical diversity using VocD among CWS compared to peers. This difference between studies is in spite of the fact that the present study incorporated these samples into its analyses; the samples constituted approximately 20% of the present study’s samples (30 samples of 152 total).
In summary, then, results of this large-scale analysis of lexical diversity data indicate that CWS did not differ from fluent peers as assessed on five different measures of conversational lexical diversity, including a new measure meant to remedy some weaknesses of prior indices of lexical diversity (MATTR). This finding would seem to suggest with some degree of confidence that CWS display equivalent lexical diversity in their spontaneous language samples, even when the standardized vocabulary test data suggest a difference in vocabulary knowledge.
Language samples from CWS contained slightly more utterances, but this difference was not significant, and may have been due to clinical attempts to elicit a sufficient number of disfluencies from the CWS for other analyses. Despite the greater number of utterances, MLU was very similar across the two groups, with only a difference of 0.001 between the two means. This is consistent with Watts et al. (2017), who also employed a large sample of 181 CWS. Whereas Watts et al. (2017) compared the CWS to a normative database, this study individually matched CWS with peers similar in age, gender, and SES, allowing conclusions about the lack of between-group differences in lexical diversity to be drawn with more certainty.
At first glance, it seems rather inconsistent that we should find differences between the groups on standardized vocabulary tests but not in lexical diversity of spontaneous language. It is clear that there are methodological differences between vocabulary tests and measures of lexical diversity in spontaneous language. Language testing does not permit self-selection of lexicon. As has been noted by many child language researchers, children may not have been exposed to the words that are on a specific vocabulary test, or they may find them difficult to retrieve or resolve among comprehension options. It is unclear whether this breakdown might occur while retrieving the concept, phonological representation, or motor sequencing pattern of the word. Spontaneous language sampling during play, in contrast to these tests, gives children free range in the words that they use. There are no set lexical targets required to satisfy the task.
Why do CWS show differences on direct testing that are not apparent in natural communicative interaction? Our research and others’ suggest that CWS seem to perform significantly less well on other structured tasks requiring specific verbal responses, such as nonword repetition tasks (Anderson, Wagovich, & Hall, 2006; Hakim & Bernstein Ratner, 2004) and phonological memory tasks (Anderson, Wagovich, & Brown, 2019; Pelczarski & Yaruss, 2016). Both of these measures are documented to correlate with performance on standardized language measures in a large body of research that examines predictors of language proficiency in children. It may be that CWS have developed lexical retrieval preferences for use in conversation that fit well with their language encoding capacity, whereas no such options are available when complying with a test prompt requiring a specific lexical target.
4.3. Relations among measures of children’s lexical skills
Lexical diversity in conversation is one indicator of lexical skill, as is the vocabulary knowledge displayed on standardized tests. No lexical diversity measure correlated significantly with scores on standardized expressive vocabulary measures after adjustment for multiple comparisons. However, both MATTR and TTR50, it should be noted, exhibited trends in this direction. Both of these analyses conceive of lexical diversity similarly – considering the number of different words in relation to the total number of words. TTR50 does not standardize sample size by words (i.e., sample length is measured in utterances, such that samples can range in the number of words subjected to TTR50 analysis), whereas MATTR (a) uses entire samples, increasing the representativeness of the measure over TTR50, and (b) uses an algorithm to control sample size through the analysis of subsamples of a specified size. Thus, although we do not wish to overinterpret statistical trends, we note that the two analyses that approached significance in relation to expressive vocabulary tests are actually similar in their computation.
Among the lexical diversity measures, we found significant inter-correlations among the three measures that control for sample size: VocD and NDW, VocD and MATTR, and NDW and MATTR. Correlations were medium (VocD/NDW, r = .45) to large (Vocd/MATTR, r = .72, NDW/MATTR, r = .62). There are at least two important implications of these findings. First, as noted above, those analyses that take sample size in words into account seem to be measuring the construct of lexical diversity in a way that leads to convergence across measures. This highlights the importance of using measures that control for the effects of differences across sample size. Second, as pertains to the question of the concurrent validity of MATTR, the newer of the lexical diversity measures, it appears that MATTR does display acceptable correspondence with other lexical diversity measures that have been shown to address differences in sample size adequately. In contrast, TTR and TTR50 values did not demonstrate significant relations when compared to other measures. This is interesting, as TTR is the oldest and most commonly used analysis among clinicians when measuring lexical diversity (Bernstein Ratner & MacWhinney, 2016). When sample size is standardized somewhat, through number of utterances, TTR50 still appears to paint a different picture of individual lexical skills than the other three measures. The correlations between VocD and MATTR are noteworthy, given that both have proved more reliable across sample size differences than other measures (Fergadiotis et al., 2013; Fergadiotis et al., 2015; Covington & McFall, 2010; Silverman & Bernstein Ratner, 2002; Malvern et al., 2004; McCarthy & Jarvis, 2007; Koizumi & In’nami, 2012) and both use the entire sample in their analysis.
4.4. Limitations
The limitations of this study include the wide age range of participants and potential variability in collecting language samples across studies. In regard to the first issue, although efforts were made to examine CWS as close to onset as possible, not all of the datasets consisted of young children close to onset. The diversity of studies instead allowed us to pool a wide range of participants, from close to onset through age eight. However, the variability in participant age makes it difficult to rule out whether any potential vocabulary differences pre-dated stuttering onset or emerged after onset. Of importance, finding an effect on standardized vocabulary test performance in such a large sample across ages increases power and generalizability. Moreover, because there was no difference observed in lexical diversity of spontaneous language, it is unlikely that word avoidances and substitutions conditioned by stuttering impacted the lexical content of children’s conversational language. That is, if CWS were shortening utterances or choosing from a smaller set of vocabulary items, these behaviors would have been captured as reduced lexical diversity in comparison to CWNS. Alternatively, use of circumlocutions or word substitutes could have added to diversity, but this was not observed, either.
Pertinent to the second issue, some studies we included employed mother-child interactions, while others used clinician-child interactions for their language samples. Adult interaction styles may have varied, together with toys and topics of conversation. However, because the group comparison results of the lexical analyses were similar (i.e., none resulted in significant between-group differences), we infer that this procedural variability across datasets did not impact the lexical diversity findings of this study. In comparison to language sample analysis, elicitation of language is more controlled during standardized vocabulary testing. Indeed, it was in the language testing that we observed differences between the CWS and their peers.
4.5. Future research
Future studies could divide participants into children near onset and older children to help determine if lexical skills change over time since onset. Even more informative would be longitudinal studies, in which factors such as persistence and recovery can also be determined from potential linguistic measures, as are now suggested by growth-modeling over time of a subset of the current study population, as reported by Leech et al. (2017, 2019).
To help understand why we observed differences on standardized measures and not spontaneous measures, future research could perform a more sophisticated assessment of lexical retrieval during standardized measures. This may involve performing an item-by-item analysis on standardized measures in order to determine if the CWS reach ceiling earlier than CWNS and therefore have a lower number of opportunities to respond to items, or if they make numerous errors with a similar number of opportunities.
Some of the referenced prior studies on language in CWS, as well as the current study, have revealed that reports of language skill in young CWS, whether skills are observed to be lower than, equivalent to, or higher than non-stuttering peers, obtain quite different results as sample size is increased by adding observations from either the same lab or others. In this set of analyses, combining data tended to confirm findings from the majority of prior smaller studies, but not all. Statistical findings from larger pools can either confirm or weaken conclusions reached from smaller individual reports. This is why future research should strive as much as possible to exploit data sharing initiatives that facilitate combining data from numerous researchers, languages and sampling contexts, in order to most thoroughly sample CWS and obtain more generalizable findings. Work is underway to convert many of the transcripts used in our analyses to fully inter-analyzable corpora to be contributed for follow-up analysis by other researchers to FluencyBank (www.fluency.talkbank.org). Some (e.g., Bernstein Ratner), are already completed, while others are in progress; a major remaining challenge is to convert notations of fluency breakdown in these samples to a single unified set of codes. This is an inherent problem in use of other potential open-access repositories for stuttering data, such as OSF.io and Databrary – outside of the CHAT transcription system used by TalkBank, we do not have a lingua franca for describing fluency behaviors seen in stuttering.
4.6. Summary
The primary goal of this study was to examine lexical diversity in spontaneous conversational language, as well as to examine performance on standardized vocabulary testing, by pooling CWS and CWNS across seven sites/research labs within the United States. A second goal was to assess the relations among the different lexical diversity measures to explore questions of concurrent validity of MATTR. Finally, we examined the relations between lexical diversity measures and expressive vocabulary knowledge. A highly significant difference was found between CWS and CWNS on standard expressive and receptive vocabulary scores across studies that used different vocabulary measures. The CWS performed, on average, almost one standard deviation below the CWNS on the expressive vocabulary tests. Both groups still fell within the normal (nonclinical) range, however. In contrast, CWS demonstrated no significant differences in lexical diversity compared to CWNS on several lexical diversity measures in spontaneous language samples: overall TTR, TTR50, NDW, VocD, and a new measure, MATTR. Among spontaneous lexical diversity measures, there were significant correlations among NDW, VocD, and MATTR, providing some evidence of MATTR’s concurrent validity with similar measures of lexical diversity, and suggesting the importance of using the entire transcript for language sample analysis. However, none of the lexical diversity analyses were significantly correlated with children’s expressive vocabulary test score performance.
We wish to point out that behavioral measures are at best a crude indicator of skill areas that may be more difficult for CWS than their typical peers. Many of the children we profiled were participants in neuroimaging studies that found atypical profiles of activation under linguistic task demand, including lexical processing (Hartfield & Conture, 2006; Weber-Fox, Wray & Arnold, 2013; Kreidler, Hampton Wray, Usler & Weber, 2017). Experimental tasks, such as naming following priming conditions, have also been shown to distinguish CWS from typical peers (e.g., Pellowski & Conture, 2005). Thus, work to examine either standardized test performance or language sample analysis profiles in CWS need to be part of a larger unified, multifactorial approach to understanding the nature of stuttering in early childhood.
Though stuttering is, at its core, a disorder of speech motor coordination, at this point, there is a variety of converging results indicating that CWS often score below fluent, well-matched peers on tests of language skill, or demonstrating neuroimaging profiles that suggest that CWS process language tasks atypically, or showing exacerbation of disfluency under linguistic demand. Such findings clearly have ramifications for a full understanding of how stuttering arises, its precipitators in the speech of young children, and potential ramifications for assessment and intervention. We chose to explore these concerns by combining data to permit more robust statistical analysis of past work, and hope that others will follow in our lead.
Our research provides possible future directions for research in stuttering. These could include analysis that goes beyond lexical profiles and continues to examine grammatical or syntactic profiles. We also note that both language sample analysis and standardized tests have come under warranted criticism for not adequately sampling language-learning skill, and for biasing against children who speak non-mainstream dialects, are language-learning, or who come from lower socio-educational backgrounds. In such cases, a large body of clinical work and research suggests the value of dynamic assessment (Peña, Iglesias & Lidz, 2001; Dockrell & Marshall, 2015), an approach that has not, to our knowledge, been employed to assess the learning potential of CWS compared to their typically-fluent peers. Finally, the cooperative nature of data-sharing in this study highlights the benefits of combining data from numerous research labs to increase the reliability and generalizability of results, while increasing the power to identify potential subtle differences between cohorts of children.
Highlights.
CWS did not differ from CWNS in conversational lexical diversity
CWS performed significantly worse than CWNS on standardized vocabulary tests
Significant correlations among NDW, VocD, and MATTR
Only measure that correlated with scores on standardized expressive vocabulary was TTR50
Acknowledgments
This study was supported in part with grants from the National Institutes of Health (NIDCD R01DC015494, Ratner; NIDCD R01DC011277, Chang) and the National Science Foundation (BCS1626300, Ratner), as well as internal funding provided by the University of Missouri Research Council (Wagovich).
Biographies
Author Biography
Courtney Luckman, MA, CCC-SLP, is director of operations and speech-language pathologist at speech IRL in Chicago, IL, where she specializes in stuttering.
Stacy A. Wagovich, Ph.D., CCC-SLP is an Associate Professor and Chair of the Department of Communication Science and Disorders, University of Missouri. Her research interests are in childhood fluency disorders, as well as developmental language disorders.
Christine Weber, PhD, CCC-SLP is a Professor of Speech, Language, & Hearing Sciences at Purdue University and co-director of the Purdue Stuttering Project. She is the director of the Neural Systems for Language Processing Laboratory. Her research focus is on the development of neural functions mediating language processing in typical development, stuttering, and developmental language disorders.
Barbara Brown, MS, CCC-SLP is a research associate, clinical instructor, and certified speech-language pathologist. Her current interests include evidence-based practice and treatment outcomes in clients who stutter, and speech and swallowing disorders in children with cerebral palsy.
Soo-Eun Chang, Ph.D., CCC-SLP, is an Assistant Professor in the Department of Psychiatry at the University of Michigan. Soo-Eun currently conducts multimodal neuroimaging research to examine brain function and anatomy differences in children who stutter relative to typically developing peers during brain development.
Nancy E Hall, Ph.D., CCC-SLP, is an Associate Professor and Department Chair in Communication Sciences and Disorders at the University of Maine. She researches parents perspectives on raising children with communication impairments.
Nan Bernstein Ratner, Ed.D., CCC-SLP, BCS-CLLD, is Professor of Hearing and Speech Sciences at the University of Maryland. She is a Board Recognized Specialist in Child Language and Language Disorders, who publishes broadly in the areas of language and fluency development/disorders.
Footnotes
Publisher's Disclaimer: This is a PDF file of an unedited manuscript that has been accepted for publication. As a service to our customers we are providing this early version of the manuscript. The manuscript will undergo copyediting, typesetting, and review of the resulting proof before it is published in its final form. Please note that during the production process errors may be discovered which could affect the content, and all legal disclaimers that apply to the journal pertain.
References
- Adams MR (1990). The demands and capacities model I: theoretical elaborations. Journal of Fluency Disorders, 15, 135–141. [Google Scholar]
- Anderson JD & Conture EG (2000). Language abilities of children who stutter: A preliminary study. Journal of Fluency Disorders, 25, 283–304. [Google Scholar]
- Anderson JD, Pellowski MW, & Conture EG (2005). Childhood stuttering and dissociations across linguistic domains. Journal of Fluency Disorders, 30, 219–253. [DOI] [PubMed] [Google Scholar]
- Anderson JD, Wagovich SA, & Hall NE (2006). Nonword repetition skills in young children who do and do not stutter. Journal of fluency disorders, 31, 177–199. [DOI] [PMC free article] [PubMed] [Google Scholar]
- Anderson JD, Wagovich SA, & Brown BT (2019). Phonological and semantic contributions to verbal short-term memory in young children with developmental stuttering. Journal of Speech, Language, and Hearing Research, 62, 644–667. [DOI] [PMC free article] [PubMed] [Google Scholar]
- Bernstein Ratner N & MacWhinney B (2016). Your laptop to the rescue: Using the child language data exchange system archive and CLAN utilities to improve language sample analysis. Seminars in Speech and Language, 37, 74–84. [DOI] [PMC free article] [PubMed] [Google Scholar]
- Bernstein Ratner N & Wijnen F (2007). The vicious cycle: Linguistic encoding, self-monitoring and stuttering In Au-Yeung J & Leahy MM (Eds.) Research, treatment, and self-help in fluency disorders: New horizons, (pp. 84–90). Dublin, Ireland: International Fluency Association. [Google Scholar]
- Bloodstein O, & Bernstein Ratner N (2008). A handbook on stuttering (6th ed.). New York: Thomson-Delmar. [Google Scholar]
- Bonelli P, Dixon M, Bernstein Ratner N, & Onslow M (2000). Child and parent speech and language following the Lidcombe Programme of early stuttering intervention. Clinical Linguistics & Phonetics, 14, 427–446. [Google Scholar]
- Brownell R (2000a). Receptive One-Word Picture Vocabulary Test. Novato, CA: Academic Therapy Publications. [Google Scholar]
- Brownell R (2000b). Expressive One-Word Picture Vocabulary Test. Novato, CA: Academic Therapy Publications. [Google Scholar]
- Choo AL, Burnham E, Hicks K, & Chang S (2016). Dissociations among linguistic, cognitive, and auditory-motor neuroanatomical domains in children who stutter. Journal of Communication Disorders, 61, 29–47. [DOI] [PMC free article] [PubMed] [Google Scholar]
- Coulter CE, Anderson JD, & Conture EG (2009). Childhood stuttering and dissociations across linguistic domains: A replication and extension. Journal of Fluency Disorders, 34, 257–278. [DOI] [PMC free article] [PubMed] [Google Scholar]
- Covington MA & McFall JD (2010). Cutting the Gordian knot: The moving-average type–token ratio (MATTR). Journal of Quantitative Linguistics, 17, 94–100. [Google Scholar]
- Dickinson DK & Tabors PO (2001). Beginning literacy with language: Young children learning at home and school. Baltimore: Paul Brookes Publishing. [Google Scholar]
- Dockrell JE, & Marshall CR (2015). Measurement issues: Assessing language skills in young children. Child and Adolescent Mental Health, 20(2), 116–125. [DOI] [PubMed] [Google Scholar]
- Dunn LM, & Dunn LM (1981). Peabody Picture Vocabidary Test-Revised. Circle Pines, MN: American Guidance Service. [Google Scholar]
- Dunn LM, & Dunn LM (1997). Peabody Picture Vocabulary Test (3rd ed.). Circle Pines, MN: American Guidance Service. [Google Scholar]
- Dunn LM, & Dunn DM (2007). PPVT-4: Peabody picture vocabulary test (4th ed.). Pearson Assessments. [Google Scholar]
- Ellis Weismer S, Venker C, Evans JL, & Moyle M (2013). Fast mapping in late-talking toddlers. Applied Psycholinguistics, 34, 69–89. [DOI] [PMC free article] [PubMed] [Google Scholar]
- Eriksson M, Marschik PB, Tulviste T, Almgren M, Pérez Pereira M, Wehberg S, … & Gallego C (2012). Differences between girls and boys in emerging language skills: Evidence from 10 language communities. British Journal of Developmental Psychology, 30(2), 326–343. [DOI] [PubMed] [Google Scholar]
- Fenson L, Dale PS, Reznick JS (1993). The Macarthur communicative development inventories: User’s guide and technical manual. San Diego, CA: Singular Publishing Group. [Google Scholar]
- Fergadiotis G (2011). Modeling lexical diversity across language sampling and estimation techniques. (Dissertation). Retrieved from Arizona State University Digital Repository. [Google Scholar]
- Fergadiotis G, Wright HFL, & West TM (2013). Measuring lexical diversity in narrative discourse of people with aphasia. American Journal of Speech-Language Pathology, 22, 397–408. [DOI] [PMC free article] [PubMed] [Google Scholar]
- Fergadiotis G, Wright HFL, & Green SB (2015). Psychometric evaluation of lexical diversity indices: assessing length effects. Journal of Speech, Language, and Hearing Research, 58, 840–852. [DOI] [PMC free article] [PubMed] [Google Scholar]
- Frank MC, Braginsky M, Yurovsky D, & Marchman VA (2017). Wordbank: An open repository for developmental vocabulary data. Journal of Child Language, 44(3), 677–694. [DOI] [PubMed] [Google Scholar]
- Gardner MF Expressive One-Word Picture Vocabulary Test. Novato, Calif.: Academic Therapy Publications, 1979. [Google Scholar]
- Gardner M (1990). Expressive One-Word Picture Vocabulary Test, Revised. Austin, TX: Pro-Ed. [Google Scholar]
- Golinkoff RM, Hoff E, Rowe ML, Tamis- LeMonda CS, & Hirsh- Pasek K (2019). Language matters: Denying the existence of the 30- million- word gap has serious consequences. Child Development, 90(3), 985–992. [DOI] [PMC free article] [PubMed] [Google Scholar]
- Gray S, Plante E, Vance R & Henrichsen M (1999). The diagnostic accuracy of four vocabulary tests administered to preschool-age children. Language, Speech and Hearing Services in Schools, 30, 196–206. [DOI] [PubMed] [Google Scholar]
- Hakim ΗB & Bernstein Ratner N (2004). Nonword repetition abilities of children who stutter: an exploratory study. Journal of Fluency Disorders, 29, 179–199. [DOI] [PubMed] [Google Scholar]
- Hall NE, Higgins K, Wagovich SA, Farkas L, Cote E, Russell L, & Ward J (2007). A developmental study of normal fluency and language. In Au-Yeung J & Leahy MM (Eds.) Research, treatment, and self-help in fluency disorders: New horizons, (pp. 130–135). Dublin, Ireland: International Fluency Association. [Google Scholar]
- Hall NE, Wagovich SA, & Bernstein Ratner N (2007). Language considerations in developmental stuttering. In Conture E& Curlee R (Eds.), Stuttering and related disorders of fluency (3rd ed., pp. 153–167). New York: Thieme. [Google Scholar]
- Hartfield KN, & Conture EG (2006). Effects of perceptual and conceptual similarity in lexical priming of young children who stutter: Preliminary findings. Journal of Fluency Disorders, 57(4), 303–324. [DOI] [PMC free article] [PubMed] [Google Scholar]
- Hess CW, Ritchie KP, & Landry RG (1984). The type-token ratio and vocabulary performance. Psychological Reports, 55, 51–57. [Google Scholar]
- Hess CW, Haug ΗT, & Landry RG (1989). The reliability of type-token ratios for the oral language of school age children. Journal of Speech and Hearing Research, 32, 536–540. [DOI] [PubMed] [Google Scholar]
- Johnson KN, Karrass J, Conture EG, & Walden T (2009) Influence of stuttering variation on talker group classification in preschool children: Preliminary findings. Journal of Communication Disorders, 42, 195–210. [DOI] [PMC free article] [PubMed] [Google Scholar]
- Klee T (1992). Developmental and diagnostic characteristics of quantitative measures of children’s language production. Topics in Language Disorders, 12, 28–41. [Google Scholar]
- Koizumi R & In’nami Y (2012). Effects of text length on lexical diversity measures: Using short texts with less than 200 tokens. System, 40, 554–564. [Google Scholar]
- Kreidler K, Hampton Wray A, Usler E, & Weber C (2017). Neural indices of semantic processing in early childhood distinguish eventual stuttering persistence and recovery. Journal of Speech, Language, and Hearing Research, 60(11), 3118–3134. [DOI] [PMC free article] [PubMed] [Google Scholar]
- Lai SA, & Schwanenflugel PJ (2016). Validating the use of D for measuring lexical diversity in low-income Kindergarten children. Language, Speech, and Hearing Services in Schools, 47(3), 225–235. [DOI] [PubMed] [Google Scholar]
- Leadholm B & Miller JF (1992). Language sample analysis: The Wisconsin guide. Madison, WI: Wisconsin Department of Public Instruction. [Google Scholar]
- Leech KA, Bernstein Ratner N, Brown B, & Weber CM (2017). Preliminary evidence that growth in productive language differentiates childhood stuttering persistence and recovery. Journal of Speech, Language, and Hearing Research, 60, 3097–3109. [DOI] [PMC free article] [PubMed] [Google Scholar]
- Leech KA, Bernstein Ratner N, Brown B & Weber CM (2019). Language growth predicts stuttering persistence over and above family history and treatment experience. Journal of Speech, Language and Hearing Research, 62, 1371–1372. [DOI] [PMC free article] [PubMed] [Google Scholar]
- Levine D, Pace A, Luo R, Hirsh-Pasek K, Golinkoff RM, de Villiers J, … & Wilson MS (2018). Evaluating socioeconomic gaps in preschoolers’ vocabulary, syntax and language process skills with the Quick Interactive Language Screener (QUILS). Early Childhood Research Quarterly. [Google Scholar]
- MacWhinney B (2000). The CHILDES Project: Tools for Analyzing Talk. 3rd Edition Mahwah, NJ: Lawrence Erlbaum Associates. [Google Scholar]
- Malvern DD, Richards BJ, Chipere N, & Duran P (2004). Lexical diversity and language development. New York: Pal grave MacMillan. [Google Scholar]
- Malvern DD & Richards BJ (1997). A new measure of lexical diversity. In Ryan A & Wray A (Eds.), Evolving models of language (pp. 58–71). Clevedon: Multilingual Matters. [Google Scholar]
- McCarthy PM & Jarvis S (2007). Vocd: A theoretical and empirical evaluation. Language Testing, 24, 459–488. [Google Scholar]
- McCarthy PM & Jarvis S (2010). MTLD, Voc-D, and HD-D: A validation study of sophisticated approaches to lexical diversity assessment. Behavior Research Methods, 42, 381–392. [DOI] [PubMed] [Google Scholar]
- McKee G, Malvern D, & Richards B (2000). Measuring vocabulary diversity using dedicated software. Literacy and Linguistic Computing, 15, 323–337. [Google Scholar]
- Millager RA, Conture EG, Walden TA, & Kelly EM (2014). Expressive language intratest scatter of preschool-age children who stutter. Contemporary Issues in Communication Sciences and Disorders, 41, 110–119. [PMC free article] [PubMed] [Google Scholar]
- Miller JF (1991). Quantifying productive language disorders. In Miller JF (Ed.), Research on child language disorders: A decade of progress. Austin, Texas: Pro-Ed. [Google Scholar]
- Miller JF (1981). Assessing language production: experimental procedures. London: Arnold. [Google Scholar]
- Newcomer P & Hammill D (1982). Test of Language Development-Primary. Austin, Texas: Pro-Ed. [Google Scholar]
- Nippold MA (1990). Concomitant speech and language disorders in stuttering children: A critique of the literature. Journal of Speech and Hearing Disorders, 55, 51–60. [DOI] [PubMed] [Google Scholar]
- Nippold MA (2012). Stuttering and language ability in children: questioning the connection. American Journal of Speech-Language Pathology, 21, 183–196. [DOI] [PubMed] [Google Scholar]
- Nippold MA (2018). Language development in children who stutter: a review of recent research. International Journal of Speech-Language Pathology, 1–9. [DOI] [PubMed] [Google Scholar]
- Ntourou K, Conture EG, & Lipsey MW (2011). Language abilities of children who stutter: A meta-analytical review. American Journal of Speech-Language Pathology, 20, 163–179. [DOI] [PMC free article] [PubMed] [Google Scholar]
- Owen AJ & Leonard LB (2002). Lexical diversity in the spontaneous speech of children with specific language impairment: application of D. Journal of Speech, Language, and Hearing Research, 45, 927–937. [DOI] [PubMed] [Google Scholar]
- Pelczarski KΜ & Yaruss JS (2016). Phonological memory in young children who stutter. Journal of Communication Disorders, 62, 54–66. [DOI] [PubMed] [Google Scholar]
- Pellowski MW, & Conture EG (2005). Lexical priming in picture naming of young children who do and do not stutter. Journal of Speech, Language, and Hearing Research, 48, 278–294. [DOI] [PubMed] [Google Scholar]
- Peña E, Igleasias A & Lidz C (2001). Reducing test bias through dynamic assessment of children’s word learning. Journal of Speech, Language and Hearing Research, 10, 138–154. [Google Scholar]
- Reilly S, Onslow M, Packman A, Wake M, Bavin EL, Prior M, … & Ukoumunne OC (2009). Predicting stuttering onset by the age of 3 years: A prospective, community cohort study. Pediatrics, 123(1), 270–277. [DOI] [PMC free article] [PubMed] [Google Scholar]
- Restrepo MA, Schawnenflugel P, Blake J, Neuharth-Prtichett S, Cramer S & Ruston H (2006). Performance on the PPVT-III and the EVT: applicability of the measures with African American and European American preschool children. Language, Speech and Hearing Services in Schools, 37, 17–27. [DOI] [PubMed] [Google Scholar]
- Retherford KS (2000). Guide to analysis of language transcripts (3rd ed.). Eau Claire, WI: Thinking Publications. [Google Scholar]
- Rice M & Hoffman L (2015). Predicting vocabulary growth in children with and without Specific Language Impairment: a longitudinal study from 2;6 to 21 years of age. Journal of Speech, Language and Hearing Research, 58, 345–359. [DOI] [PMC free article] [PubMed] [Google Scholar]
- Richards B (1987). Type/token ratios: what do they really tell us? Journal of Child Language, 14, 201–209. [DOI] [PubMed] [Google Scholar]
- Richels CG, Johnson KN, Walden TA, & Conture EG (2013). Socioeconomic status, parental education, vocabulary and language skills of children who stutter. Journal of communication disorders, 46(4), 361–374. [DOI] [PMC free article] [PubMed] [Google Scholar]
- Ryan BP (1992). Articulation, language, rate, and fluency characteristics of stuttering and nonstuttering preschool children. Journal of Speech and Hearing Research, 35, 333–342. [DOI] [PubMed] [Google Scholar]
- Schwab JF, & Lew- Williams C (2016). Language learning, socioeconomic status, and child- directed speech. Cognitive Science, 7(4), 264–275. [DOI] [PMC free article] [PubMed] [Google Scholar]
- Silverman S & Bernstein Ratner N (2002). Measuring lexical diversity in children who stutter: application of VocD. Journal of Fluency Disorders, 27, 289–304. [DOI] [PubMed] [Google Scholar]
- Smith A, & Weber C (2017). How stuttering develops: The multifactorial dynamic pathways theory. Journal of Speech, Language, and Hearing Research, 60(9), 2483–2505. [DOI] [PMC free article] [PubMed] [Google Scholar]
- Templin MC (1957). Certain language skills in children. Minneapolis: University of Minnesota Press. [Google Scholar]
- Tommerdahl J & Kilpatrick C (2013). Analysing frequency and temporal reliability of children’s morphosyntactic production in spontaneous language samples of varying lengths. Child Language Teaching and Therapy, 29, 171–183. [Google Scholar]
- Tommerdahl J & Kilpatrick CD (2014). The reliability of morphological analyses in language samples. Language Testing, 31, 3–18. [Google Scholar]
- Ukrainetz T & Blomquist C (2002). The criterion validity of four vocabulary tests compared with a language sample. Child Language Teaching and Therapy, 18, 59–78. [Google Scholar]
- Vernon- Feagans L, Bratsch- Hines M, Reynolds E, & Willoughby M (2019). How early maternal language input varies by race and education and predicts later child language. Child Development. [DOI] [PMC free article] [PubMed] [Google Scholar]
- Wagovich SA, & Hall NE (2018). Stuttering frequency in relation to lexical diversity, syntactic complexity, and utterance length. Communication Disorders Quarterly, 39, 335–345. [Google Scholar]
- Wagovich SA, Hall NE, & Clifford BA (2009). Speech disruptions in relation to language growth in children who stutter: An exploratory study. Journal of Fluency Disorders, 34, 242–256. [DOI] [PubMed] [Google Scholar]
- Walden TA, Frankel CB, Buhr AP, Johnson KN, Conture EG, & Karrass JM (2012). Dual diathesis-stressor model of emotional and linguistic contributions to developmental stuttering. Journal of Abnormal Child Psychology, 40(4), 633–644. [DOI] [PMC free article] [PubMed] [Google Scholar]
- Warren-Leubecker A & Bohannon JN (1984). Intonation patterns in child-directed speech: Mother-father speech. Child Development, 55, 1379–1385. [Google Scholar]
- Watkins RV, Kelly DJ, Harbers ΗM, & Hollis W (1995). Measuring children’s lexical diversity: Differentiating typical and impaired language learners. Journal of Speech and Hearing Research, 38, 1349–1355. [DOI] [PubMed] [Google Scholar]
- Watkins RV & Yairi E (1997). Language production abilities of children whose stuttering persisted or recovered. Journal of Speech, Language, and Hearing Research, 40, 385–399. [DOI] [PubMed] [Google Scholar]
- Watkins RV, Yairi E, & Ambrose NG (1999). Early childhood stuttering III: Initial status of expressive language abilities. Journal of Speech, Language, and Hearing Research, 42, 1125–1135. [DOI] [PubMed] [Google Scholar]
- Watts A, Eadie P, Block S, Mensah F, & Reilly S (2015). Language ability of children with and without a history of stuttering: a longitudinal cohort study. International Journal of Speech-Language Pathology, 17, 86–95. [DOI] [PubMed] [Google Scholar]
- Watts A, Eadie P, Block S, Mensah F, & Reilly S (2017). Language skills of children during the first 12 months after stuttering onset. Journal of Fluency Disorders, 51, 39–49. [DOI] [PubMed] [Google Scholar]
- Weber-Fox C, Wray AH, & Arnold H (2013). Early childhood stuttering and electrophysiological indices of language processing. Journal of Fluency Disorders, 38(2), 206–221. [DOI] [PMC free article] [PubMed] [Google Scholar]
- Westby CE (1979). Language performance of stuttering and nonstuttering children. Journal of Communication Disorders, 12, 133–145. [DOI] [PubMed] [Google Scholar]
- Williams KT (1997). Expressive vocabulary test (EVT). Circle Pines, MN: American Guidance Service Inc. [Google Scholar]
- Williams KT (2007). EVT-2: Expressive Vocabulary Test. Pearson Assessments. [Google Scholar]
- Williams DE, Melrose BM, & Woods CL (1969). The relationship between stuttering and academic achievement in children. Journal of Communication Disorders, 2, 87–98. [Google Scholar]