

Abstract
Background:
Texture features were the intrinsic properties of the human tissues and could efficiently detect the subtle functional changes of involved tissue. The pathologic changes of the lateral pterygoid muscle (LPM) were significantly correlated with the temporomandibular disc displacement. However, the occult functional changes of LPM could not be detected by the naked eye on the medical images. The current study was aimed to evaluate the functional changes of the LPM in the patients with temporomandibular disorders (TMDs) using texture analysis.
Methods:
Twenty-nine patients with TMD were performed with magnetic resonance (MR) imaging on a 3.0T MR scanner, who were consecutively recruited from the TMD clinic of Hainan Hospital of Chinese People's Liberation Army General Hospital from February 2019 to September 2019. The patients were classified into three groups according to the disc displacement: disc without displacement (DWoD), disc displacement with reduction (DDWR) and disc displacement without reduction (DDWoR). The gray-level co-occurrence matrix method was applied with the texture analysis of LPM on the axial T2-weighted imaging. The texture features included angular second moment, contrast, correlation, inverse different moment, and entropy. One-way analysis of variance was used for grouped comparisons and receiver operating characteristics (ROC) curve analysis was applied to evaluate the diagnostic efficacy of the texture parameters.
Results:
Texture contrast of LPM presented significantly lower in DDWoR (46.30 [35.03, 94.48]) than that in DWoD (123.85 [105.06, 143.23]; test statistic = 23.05; P < 0.001). Texture entropy of LPM showed significant differences among DWoD (7.62 ± 0.33), DDWR (6.76 ± 0.35), and DDWoR (6.46 ± 0.39) (PDWoD-DDWR < 0.001, PDWoD-DDWoR < 0.001, and PDDWR-DDWoR = 0.014). Area under the ROC curve (AUC) demonstrated that texture entropy had an excellent diagnostic accuracy for DWoD-DDWR (AUC = 0.96) and DWoD-DDWoR (AUC = 0.98).
Conclusion:
The texture contrast and entropy could identify the altered functional status of LPM in patients with TMD and could be considered as the effective imaging biomarker to evaluate the functional changes of LPM in TMD.
Keywords: Entropy, Magnetic resonance imaging, Pterygoid muscle, Temporomandibular joint disorders
Introduction
Temporomandibular disorders (TMDs) were a common and self-limited clinical syndrome, characterized by the pain in temporomandibular joint (TMJ) or its affiliated tissues.[1] TMD was common in adults and one third of adults reported having symptoms,[2] which had costed to $4 billion per year for the TMD management in the last decade.[3]
Etiology of TMD still remained unclear, and it might be multi-factorial. The most common cause was the TMJ disc displacement,[4] which should not be solely used to diagnose TMD.[5] The other cause was the masticatory muscle disorder according to the anatomical origin, such as local myalgia, myofascial pain, myofibrotic contracture, myositis, myospasm, and neoplasia.[1] Masticatory muscles included masseter muscle, temporalis muscle, medial pterygoid muscle (MPM), and lateral pterygoid muscle (LPM). The first three masticatory muscles could elevate the mandible and close the mouth, and the morphometry[6] and edematous change[7] would be associated with pain-related TMD. The LPM could protract the mandible and produce the “side to side” movement of the jaw, and the upper head all inserted in the disc for the three LPM attachment types.[8] Although the upper head of the LPM insertion on the disc could increase the percentage of disc displacement without reduction,[9] the type of LPM insertion does not appear to relate with disc displacement[10–12] while muscle pathologic changes were significantly correlated with the disc displacement.[11,13,14]
The superior head of LPM inserted on the disc over the three types[8] might increase the risk of anterior displacement, and then reduce the function of the superior head of LPM and finally cause the muscle atrophy.[15] The myospasm of the superior head of LPM could also cause the TMJ disc displacement.[15] Therefore, the functional evaluation of LPM becomes more and more important for patients with TMD.
The common magnetic resonance (MR) technique to evaluate the structure and function of LPM mainly included as follows: (1) diffusion tensor imaging to evaluate the morphological alterations of the LPM[16]; (2) the intravoxel incoherent motion (IVIM)[17,18] MR imaging (MRI) to quantitatively evaluate diffusion and perfusion status of LPM[19]; (3) muscle morphology[14,20] and volume measurement[21] of LPM; (4) angle between LPM and condyle to identify risk factors for sideways disk displacement of TMJ.[22] Although the above MR techniques could be used to evaluate the functional or organic changes of LPM, texture analysis[23,24] could also be used to evaluate the functional changes of LPM, which could not be observed by the naked eyes. Gray-level co-occurrence matrix (GLCM),[25] as an second order texture features, had been primarily used in the clinical practice, such as pancreatic neuroendocrine tumor,[26] primary central neural system lymphoma,[27] benign and malignant breast tumors.[28] However, GLCM was rarely reported in the evaluation of LPM in TMD up to now.
Texture features were the intrinsic properties of the human tissues and could efficiently detect the subtle functional changes of involved tissue.[29] Therefore, GLCM texture technique was used to assess the functional changes of LPM in the patients with TMD without masticatory organic disease in the current study, which might be helpful to explain the pathomechanism of disc displacement and provide the important information for the treatment strategy.
Methods
Ethical approval
The study was approved by the Ethical Committee of Chinese People's Liberation Army (PLA) General Hospital (No. S2019-065-01) and complied with the Declaration of Helsinki. Informed consents were obtained from all participants before the study.
Subjects
Twenty-nine patients with TMD (male/female = 4/25, mean age: 34.0 [22.8, 49.0] years) were recruited from the TMD clinic of Hainan Hospital of Chinese People's Liberation Army General Hospital and were performed with MRI scanning from February 2019 to September 2019. The diagnostic criteria of TMD were based on the revised Research Diagnostic Criteria for Temporomandibular Disorders (RDC/TMD).[3] The included criteria were listed as follows: (1) Only suffered from disc disorders without the hypomobility or hypermobility disorders; (2) No fractures or congenital/developmental disorders; and (3) No any treatment before the MRI examination. The patients with the following criteria should be excluded out: (1) masticatory muscle disorders or coronoid hyperplasia; (2) imaging artifacts influencing the diagnosis of TMD; and (3) the contraindication for MRI. Fifty-eight TMJs (29 subjects) were classified into three subtypes according to the TMJ disc location[30]: (1) TMJ disc without displacement (DWoD); (2) TMJ disc displacement with reduction (DDWR); and (3) TMJ disc displacement without reduction (DDWoR) [Figure 1A–E].
Figure 1.

The types of the temporomandibular joint (TMJ) disc displacement on the oblique sagittal proton density weighted images. (A) TMJ disc without displacement; (B and C) TMJ disc displacement with reduction; (D, E) TMJ disc displacement without reduction. Arrow: TMJ disc. (B, D) Closed mouth position and (C,E) open mouth position.
Magnetic resonance imaging
The TMJ data were obtained from a GE three-tesla MR system (SingHdxt; GE Healthcare, Milwaukee, WI, USA), and a conventional eight-channel quadrature head coil was used. All subjects were instructed to lie in a supine position, and formed padding was used to limit head movement. The sequence included axial T2-weighted imaging (T2WI) and oblique sagittal proton density weighted imaging (PDWI) with close and open mouth position. The imaging parameters of T2WI were listed as follows: TR (repetition time) = 3600 ms, TE (echo time) = 92.5 ms, FOV (field of view) = 21 cm × 21 cm, Matrix = 320 × 288, NEX (number of acquisition) = 2, slice thickness = 3 mm, slice gap = 4 mm. The imaging parameters of PDWI included as follows: TR (repetition time) = 2423 ms, TE (echo time) = 30 ms, FOV (field of view) = 14 cm × 14 cm, Matrix = 288 × 192, NEX (number of acquisition) = 2, slice thickness = 2 mm, slice gap = 1.
Image review
All the MRIs were reviewed on the picture archiving and communication system (PACS) workstation. The disc displacement was diagnosed based on the oblique PDWI with close and open mouth position. The masticatory muscles were evaluated on the axial T2WI to exclude the patients with the masticatory muscle disorders. The imaging findings were blindly reviewed in consensus by two experienced neuroradiologists without knowing the clinical information.
Texture analysis
The texture features of LPM were measured over the superior belly of the LPM with the maximal area using GLCM method with the GLCM plugin (Version 0.4) on ImagJ (Version 1.50) (https://imagej.nih.gov/ij) [Figure 2]. The GLCM plugin was set as follows: the size of the step in pixels = 1, the direction of the step = 0 degrees, and the texture parameters angular second moment (ASM), contrast, correlation, inverse different moment (IDM), and entropy[27,29] were selected. The whole region of interest (ROI) was drawn on the LPM slice with the maximal area using freehand selection method, which should avoid the adjacent fat and bone components. ROI was placed for three times by the same neuroradiologist on the same slice, and the mean value of texture parameter was regarded as the final value.
Figure 2.

The bilateral lateral pterygoid muscles (LPMs) were performed with texture feature measurement by drawing regions of interest using ImageJ software (Version 1.50). Circle 1 and circle 2 were drawn on the LPMs slice with the maximal area using freehand selections method avoiding the adjacent fat and bone components.
Statistical analysis
The normal distribution data were presented as mean ± standard deviation (SD), and non-normal distribution data were presented as median (P25, P75). The texture ASM, contrast, and correlation were performed with Kruskal-Wallis one-way analysis of variance (ANOVA) for its non-normal distribution, and all pairwise method was used to perform multiple comparisons. Texture IDM and entropy were performed with one-way ANOVA for its normal distribution, and LSD method was applied with the post hoc multiple comparisons when equal variance was assumed. Otherwise, Dunnett's T3 was applied when equal variance was not assumed. Receiver operating characteristics (ROC) curve analysis was applied to evaluate the diagnostic efficacy of the texture parameters with significant group difference. The diagnostic accuracy could be assessed according to the area under the curve (AUC): 0.9 to 1.0 = excellent; 0.8 to 0.9 = good; 0.7 to 0.8 = fair; 0.6 to 0.7 = poor; 0.5 to 0.6 = fail.[31]
Statistically significant difference was set at a P < 0.05. Statistical analysis was performed using the PASW Statistics Software Version 18.0 (SPSS Inc., Chicago, IL, USA).
Results
Comparison of texture features among DWoD, DDWR, and DDWoR groups
Table 1 demonstrated that texture contrast presented significantly lower in DDWoR (46.30 [35.03, 94.48]) than that in DWoD (123.85 [105.06, 143.23]; test statistic = 23.05; P < 0.001), and texture entropy showed significant differences among DWoD (7.62 ± 0.33), DDWR (6.76 ± 0.35), and DDWoR (6.46 ± 0.39) (F value = 60.352, PDWoD-DDWR = 0.000, PDWoD-DDWoR = 0.000, and PDDWR-DDWoR = 0.014) [Figures 3 and 4]. Texture ASM, correlation, and IDM presented no significant difference among DWoD, DDWR, and DDWoR (H value = 4.499 and P = 0.109, H value = 3.368 and P = 0.186, and F value = 1.929 and P = 0.155, respectively).
Table 1.
Comparison of the texture features among DWoD, DDWR, and DDWoR groups for the patients with TMD.
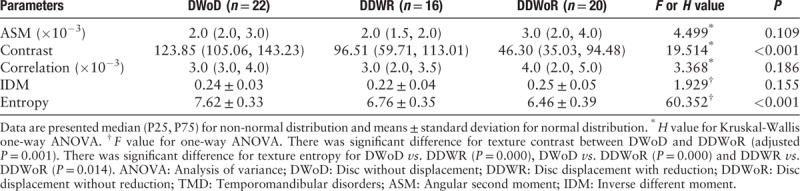
Figure 3.

Comparison of texture contrast among DWoD (n = 22), DDWR (n = 16), and DDWoR (n = 20). (A) Independent-samples Kruskal-Wallis test. (B) Pairwise comparison of group and each node representing the sample average rank of group. DWoD: Disc without displacement; DDWR: Disc displacement with reduction; DDWoR: Disc displacement without reduction.
Figure 4.

The comparison of texture entropy among DWoD (n = 22), DDWR (n = 16), and DDWoR (n = 20). DWoD: Disc without displacement; DDWR: Disc displacement with reduction; DDWoR: Disc displacement without reduction.
ROC analysis of the texture contrast and entropy among DWoD, DDWR, and DDWoR groups
Texture contrast presented a good diagnostic accuracy for DWoD-DDWoR (AUC = 0.88, cut-off value = 69.23, sensitivity = 70.00% and specificity = 100.00%), and fair accuracy for DWoD-DDWR (AUC = 0.72) and DDWR-DDWoR (AUC = 0.73) [Table 2 and Figure 5]. Table 2 demonstrated that texture Entropy had an excellent diagnostic accuracy for DWoD-DDWR (AUC = 0.96, cut-off value = 7.34, sensitivity = 100% and specificity = 81.82%) and DWoD-DDWoR (AUC = 0.98, cut-off value = 7.10, sensitivity = 95.00% and specificity = 95.45%), and fair accuracy for DDWR-DDWoR (AUC = 0.72) [Figure 6].
Table 2.
ROC analysis of texture contrast and entropy among DWoD, DDWR, and DDWoR.

Figure 5.

ROC of texture contrast for DWoD-DDWR (AUC = 0.72), DWoD-DDWoR (AUC = 0.88), and DDWR-DDWoR (AUC = 0.73) groups. DWoD: Disc without displacement; DDWR: Disc displacement with reduction; DDWoR: Disc displacement without reduction; AUC: Area under the curve; ROC: Receiver operating characteristics curve.
Figure 6.

ROC of texture entropy for DWoD-DDWR (AUC = 0.96), DWoD-DDWoR (AUC = 0.98), and DDWR-DDWoR (AUC = 0.72) groups. DWoD: Disc without displacement; DDWR: Disc displacement with reduction; DDWoR: Disc displacement without reduction; AUC: Area under the curve; ROC: Receiver operating characteristics curve.
Discussion
The MRI evaluation for the skeletal muscle commonly included the signal changes on T1WI and T2WI, the volume measurement[21] and the muscle morphology[14,20] based on the conventional MRIs. The functional MRI could provide the diffusion and perfusion status of muscle[19] based on IVIM MRI, muscle blood flow and oxygenation based on nuclear MRI (NMRI) and spectroscopy,[32] the muscle energetics based on the 31P NMRI,[33] and the measurement of minimal fat in normal skeletal muscles based on T2 relaxation time mapping (T2 maps) and MR spectroscopy.[34] However, the functional MRI examination commonly had a low cost-benefit efficacy because of its large medical cost and consumed time. Recently, texture analysis, as an non-invasive technique to detect the subtle changes of human tissue, had presented some progress in the muscle evaluation, such as internal obturator muscles after radiotherapy for prostate cancer based on the T1WI and T2WI MRIs,[35] the paraspinal musculature in MRI of the lumbar spine,[36,37] and muscular dystrophy classification.[38] In the current study, texture analysis was mainly used to identify the subtle change of LPM, which could not be observed abnormal signal by the naked eyes.
GLCM was a common second order texture analysis method to detect the relationship of the selected two points in different distance, direction, and magnitude, which could quantitatively characterize the spatial distribution of pixels for selected images and extract the texture features from the gray information.[27] The common texture measurement included first order, second order, third and higher order textures, and GLCM was a second order texture defining the relationship between two pixels (usually neighboring) in the original image.[39] Therefore, GLCM method was applied to extract the texture features and the distance in pixels was set as 1 in the current study.
Texture contrast was also called as “Sum of Square Variance,” which represented the local variations in the gray-level co-occurrence matrix.[39] In the current study, the texture contrast of LPM presented a downtrend, and the significant difference was identified between DWoD and DDWoR. LPM was inserted on the TMJ disk, and the functional change would increase the risk of anterior displacement.[15] In this study, conventional MRIs confirmed that there was no abnormal signal on LPM. Therefore, the texture analysis could be used to detect the subtle changes, which was not observed by the naked eyes. The current results also suggested that the decreased texture contrast would influence the function of LPM, and then induce the disk displacement. Further ROC analysis demonstrated that texture contrast could provide a good level to detect the functional changes of LPM between DWoD and DDWoR. Therefore, the texture contrast could be considered as an imaging biomarker for the evaluation of LPM in patients with TMD.
Texture entropy showed the amount of information of the image for compression. The loss of the information could be measured by the entropy,[25] which had been used to evaluate the function of the periaqueductal gray matter,[40] the pancreatic neuroendocrine tumor,[26] and the malignant breast tumors.[28] In this study, texture entropy of LPM also presented significantly decreased in DDWR and DDWoR compared with DWoD, which could be speculated that the loss of information of LPM might be the cause of anterior disk displacement. The current results also suggested that the texture entropy of LPM presented lower in DDWoR than that in DDWR, which demonstrated that texture entropy might be associated with displacement extent. IVIM method confirmed that the increased perfusion of superior belly LPM could be observed in the TMJ with anterior disc displacement without reduction, and the increased perfusion might influence the status of LPM, which was sensitively detected by texture entropy. Further ROC analysis demonstrated that texture entropy had an excellent evaluating accuracy for the status of LPM for DDWR and DDWoR distinguished from DWoD. Therefore, texture entropy could be considered as effective and persuasive imaging biomarkers for the status evaluation of LPM for TMJ with disc displacement.
The current study investigated the altered status of LPM using GLCM method, and the results were interesting and persuasive. However, there were some limitations in this study. First, GLCM measurement should include more parameters setting such as the size of the step in pixels and the direction of the step; Second, only one texture technique was used in this study. The other novel texture method should also be involved in the future study, such as histogram analysis, gray-level run-length matrix and local binary patterns. Lastly, texture analysis was performed on the T2WI images, and the other images (T1WI, DWI, and PDWI) should also be investigated in future.
In conclusion, the current study demonstrated that altered texture contrast and entropy presented in the LPM for TMJ with anterior disc displacement, and texture contrast and entropy could be considered as the effective imaging biomarkers to evaluate the status of LPM in TMD. GLCM texture features evaluation could provide the direct imaging evidence to explain the mechanism for the alter status of LPM in TMD.
Funding
This study was supported by a grant from the key research and develop projects in Hainan Province (No. ZDYF2017008).
Conflicts of interest
None.
Footnotes
How to cite this article: Liu MQ, Zhang XW, Fan WP, He SL, Wang YY, Chen ZY. Functional changes of the lateral pterygoid muscle in patients with temporomandibular disorders: a pilot magnetic resonance images texture study. Chin Med J 2020;133:530–536. doi: 10.1097/CM9.0000000000000658
Meng-Qi Liu and Xing-Wen Zhang contributed equally to the work.
References
- 1.Buescher JJ. Temporomandibular joint disorders. Am Fam Physician 2007; 76:1477–1482. doi: 10.1016/b978-0-323-17126-7.00010-8. [PubMed] [Google Scholar]
- 2.Rutkiewicz T, Kononen M, Suominen-Taipale L, Nordblad A, Alanen P. Occurrence of clinical signs of temporomandibular disorders in adult Finns. J Orofac Pain 2006; 20:208–217. doi: 10.1111/j.1365-2842.2006.01606.x. [PubMed] [Google Scholar]
- 3.Schiffman E, Ohrbach R, Truelove E, Look J, Anderson G, Goulet JP, et al. Diagnostic criteria for temporomandibular disorders (DC/TMD) for clinical and research applications: recommendations of the international RDC/TMD consortium network∗ and orofacial pain special interest group dagger. J Oral Facial Pain Headache 2014; 28:6–27. doi: 10.11607/jop.1151. [DOI] [PMC free article] [PubMed] [Google Scholar]
- 4.Kakimoto N, Shimamoto H, Kitisubkanchana J, Tsujimoto T, Senda Y, Iwamoto Y, et al. T2 relaxation times of the retrodiscal tissue in patients with temporomandibular joint disorders and in healthy volunteers: a comparative study. Oral Surg Oral Med Oral Pathol Oral Radiol 2019; 128:311–318. doi: 10.1016/j.oooo.2019.02.005. [DOI] [PubMed] [Google Scholar]
- 5.Kircos LT, Ortendahl DA, Mark AS, Arakawa M. Magnetic resonance imaging of the TMJ disc in asymptomatic volunteers. J Oral Maxillofac Surg 1987; 45:852–854. doi: 10.1016/0278-2391(87)90235-7. [DOI] [PubMed] [Google Scholar]
- 6.Garip H, Tufekcioglu S, Kaya E. Changes in the temporomandibular joint disc and temporal and masseter muscles secondary to bruxism in Turkish patients. Saudi Med J 2018; 39:81–85. doi: 10.15537/smj.2018.1.20873. [DOI] [PMC free article] [PubMed] [Google Scholar]
- 7.Nikkuni Y, Nishiyama H, Hyayashi T. The relationship between masseter muscle pain and T2 values in temporomandibular joint disorders. Oral Surg Oral Med Oral Pathol Oral Radiol 2018; 126:349–354. doi: 10.1016/j.oooo.2018.06.003. [DOI] [PubMed] [Google Scholar]
- 8.Litko M, Szkutnik J, Berger M, Rozylo-Kalinowska I. Correlation between the lateral pterygoid muscle attachment type and temporomandibular joint disc position in magnetic resonance imaging. Dentomaxillofac Radiol 2016; 45:20160229.doi: 10.1259/dmfr.20160229. [DOI] [PMC free article] [PubMed] [Google Scholar]
- 9.Mazza D, Marini M, Impara L, Cassetta M, Scarpato P, Barchetti F, et al. Anatomic examination of the upper head of the lateral pterygoid muscle using magnetic resonance imaging and clinical data. J Craniofac Surg 2009; 20:1508–1511. doi: 10.1097/SCS.0b013e3181b09c32. [DOI] [PubMed] [Google Scholar]
- 10.Omami G, Lurie A. Magnetic resonance imaging evaluation of discal attachment of superior head of lateral pterygoid muscle in individuals with symptomatic temporomandibular joint. Oral Surg Oral Med Oral Pathol Oral Radiol 2012; 114:650–657. doi: 10.1016/j.oooo.2012.07.482. [DOI] [PubMed] [Google Scholar]
- 11.Imanimoghaddam M, Madani AS, Hashemi EM. The evaluation of lateral pterygoid muscle pathologic changes and insertion patterns in temporomandibular joints with or without disc displacement using magnetic resonance imaging. Int J Oral Maxillofac Surg 2013; 42:1116–1120. doi: 10.1016/j.ijom.2013.01.022. [DOI] [PubMed] [Google Scholar]
- 12.Dergin G, Kilic C, Gozneli R, Yildirim D, Garip H, Moroglu S. Evaluating the correlation between the lateral pterygoid muscle attachment type and internal derangement of the temporomandibular joint with an emphasis on MR imaging findings. J Craniomaxillofac Surg 2012; 40:459–463. doi: 10.1016/j.jcms.2011.08.002. [DOI] [PubMed] [Google Scholar]
- 13.Yang X, Pernu H, Pyhtinen J, Tiilikainen PA, Oikarinen KS, Raustia AM. MR abnormalities of the lateral pterygoid muscle in patients with nonreducing disk displacement of the TMJ. Cranio 2002; 20:209–221. doi: 10.1080/08869634.2002.11746213. [DOI] [PubMed] [Google Scholar]
- 14.Yang X, Pemu H, Pyhtinen J, Tiilikainen PA, Oikarinen KS, Raustia AM. MRI findings concerning the lateral pterygoid muscle in patients with symptomatic TMJ hypermobility. Cranio 2001; 19:260–268. doi: 10.1080/08869634.2001.11746177. [DOI] [PubMed] [Google Scholar]
- 15.Taskaya-Yilmaz N, Ceylan G, Incesu L, Muglali M. A possible etiology of the internal derangement of the temporomandibular joint based on the MRI observations of the lateral pterygoid muscle. Surg Radiol Anat 2005; 27:19–24. doi: 10.1007/s00276-004-0267-6. [DOI] [PubMed] [Google Scholar]
- 16.Nastro E, Bonanno L, Catalfamo L, Runci M, Bramanti A, Anastasi G, et al. Diffusion tensor imaging reveals morphological alterations of the lateral pterygoid muscle in patients with mandibular asymmetry. Dentomaxillofac Radiol 2018; 47:20170129.doi: 10.1259/dmfr.20170129. [DOI] [PMC free article] [PubMed] [Google Scholar]
- 17.Wang YC, Hu DY, Hu XM, Shen YQ, Meng XY, Tang H, et al. Assessing the early response of advanced cervical cancer to neoadjuvant chemotherapy using intravoxel incoherent motion diffusion-weighted magnetic resonance imaging: a pilot study. Chin Med J (Engl) 2016; 129:665–671. doi: 10.4103/0366-6999.177995. [DOI] [PMC free article] [PubMed] [Google Scholar]
- 18.Hu LB, Hong N, Zhu WZ. Quantitative measurement of cerebral perfusion with intravoxel incoherent motion in acute ischemia stroke: initial clinical experience. Chin Med J 2015; 128:2565–2569. doi: 10.4103/0366-6999.166033. [DOI] [PMC free article] [PubMed] [Google Scholar]
- 19.Ngamsom S, Nakamura S, Sakamoto J, Kotaki S, Tetsumura A, Kurabayashi T. The intravoxel incoherent motion MRI of lateral pterygoid muscle: a quantitative analysis in patients with temporomandibular joint disorders. Dentomaxillofac Radiol 2017; 46:20160424.doi: 10.1259/dmfr.20160424. [DOI] [PMC free article] [PubMed] [Google Scholar]
- 20.D’Ippolito SM, Borri Wolosker AM, D’Ippolito G, Herbert de Souza B, Fenyo-Pereira M. Evaluation of the lateral pterygoid muscle using magnetic resonance imaging. Dentomaxillofac Radiol 2010; 39:494–500. doi: 10.1259/dmfr/80928433. [DOI] [PMC free article] [PubMed] [Google Scholar]
- 21.Lopes SL, Costa AL, Gamba Tde O, Flores IL, Cruz AD, Min LL. Lateral pterygoid muscle volume and migraine in patients with temporomandibular disorders. Imaging Sci Dent 2015; 45:1–5. doi: 10.5624/isd.2015.45.1.1. [DOI] [PMC free article] [PubMed] [Google Scholar]
- 22.Kohinata K, Matsumoto K, Suzuki T, Tsunoda M, Hayashi Y, Araki M, et al. Retrospective magnetic resonance imaging study of risk factors associated with sideways disk displacement of the temporomandibular joint. J Oral Sci 2016; 58:29–34. doi: 10.2334/josnusd.58.29. [DOI] [PubMed] [Google Scholar]
- 23.Kassner A, Thornhill RE. Texture analysis: a review of neurologic MR imaging applications. Am J Neuroradiol 2010; 31:809–816. doi: 10.3174/ajnr.A2061. [DOI] [PMC free article] [PubMed] [Google Scholar]
- 24.Depeursinge A, Foncubierta-Rodriguez A, Van De Ville D, Muller H. Three-dimensional solid texture analysis in biomedical imaging: review and opportunities. Med Image Anal 2014; 18:176–196. doi: 10.1016/j.media.2013.10.005. [DOI] [PubMed] [Google Scholar]
- 25.Mohanaiah P, Sathyanarayana P, Gurukumar L. Image texture feature extraction using GLCM approach. Int J Sci Res Publ 2014; 3:1–5. [Google Scholar]
- 26.Wang YW, Zhang XH, Wang BT, Wang Y, Liu MQ, Wang HY, et al. Value of texture analysis of intravoxel incoherent motion parameters in differential diagnosis of pancreatic neuroendocrine tumor and pancreatic adenocarcinoma [in Chinese]. Chin Med Sci J 2019; 34:1–9. doi: 10.24920/003531. [DOI] [PubMed] [Google Scholar]
- 27.Wang BT, Liu MX, Chen ZY. Differential diagnostic value of texture feature analysis of magnetic resonance T2 weighted imaging between glioblastoma and primary central neural system lymphoma [in Chinese]. Chin Med Sci J 2019; 34:10–17. doi: 10.24920/003548. [DOI] [PubMed] [Google Scholar]
- 28.Wang BT, Fan WP, Xu H, Li LH, Zhang XH, Wang K, et al. Value of magnetic resonance imaging texture analysis in the differential diagnosis of benign and malignant breast tumors [in Chinese]. Chin Med Sci J 2019; 34:33–37. doi: 10.24920/003516. [DOI] [PubMed] [Google Scholar]
- 29.Chen Z, Chen X, Liu M, Liu S, Ma L, Yu S. Texture features of periaqueductal gray in the patients with medication-overuse headache. J Headache Pain 2017; 18:14.doi: 10.1186/s10194-017-0727-0. [DOI] [PMC free article] [PubMed] [Google Scholar]
- 30.Tomas X, Pomes J, Berenguer J, Quinto L, Nicolau C, Mercader JM, et al. MR imaging of temporomandibular joint dysfunction: a pictorial review. Radiographics 2006; 26:765–781. doi: 10.1148/rg.263055091. [DOI] [PubMed] [Google Scholar]
- 31.Xia J, Broadhurst DI, Wilson M, Wishart DS. Translational biomarker discovery in clinical metabolomics: an introductory tutorial. Metabolomics 2013; 9:280–299. doi: 10.1007/s11306-012-0482-9. [DOI] [PMC free article] [PubMed] [Google Scholar]
- 32.Carlier PG, Bertoldi D, Baligand C, Wary C, Fromes Y. Muscle blood flow and oxygenation measured by NMR imaging and spectroscopy. NMR Biomed 2006; 19:954–967. doi: 10.1002/nbm.1081. [DOI] [PubMed] [Google Scholar]
- 33.Carlier PG, Marty B, Scheidegger O, Loureiro de Sousa P, Baudin PY, Snezhko E, et al. Skeletal muscle quantitative nuclear magnetic resonance imaging and spectroscopy as an outcome measure for clinical trials. J Neuromuscul Dis 2016; 3:1–28. doi: 10.3233/JND-160145. [DOI] [PMC free article] [PubMed] [Google Scholar]
- 34.Kim HK, Serai S, Merrow AC, Wang L, Horn PS, Laor T. Objective measurement of minimal fat in normal skeletal muscles of healthy children using T2 relaxation time mapping (T2 maps) and MR spectroscopy. Pediatr Radiol 2014; 44:149–157. doi: 10.1007/s00247-013-2791-1. [DOI] [PubMed] [Google Scholar]
- 35.Scalco E, Rancati T, Pirovano I, Mastropietro A, Palorini F, Cicchetti A, et al. Texture analysis of T1-w and T2-w MR images allows a quantitative evaluation of radiation-induced changes of internal obturator muscles after radiotherapy for prostate cancer. Med Phys 2018; 45:1518–1528. doi: 10.1002/mp.12798. [DOI] [PubMed] [Google Scholar]
- 36.Mannil M, Burgstaller JM, Thanabalasingam A, Winklhofer S, Betz M, Held U, et al. Texture analysis of paraspinal musculature in MRI of the lumbar spine: analysis of the lumbar stenosis outcome study (LSOS) data. Skeletal Radiol 2018; 47:947–954. doi: 10.1007/s00256-018-2919-3. [DOI] [PubMed] [Google Scholar]
- 37.Mannil M, Burgstaller JM, Held U, Farshad M, Guggenberger R. Correlation of texture analysis of paraspinal musculature on MRI with different clinical endpoints: Lumbar Stenosis Outcome Study (LSOS). Eur Radiol 2019; 29:22–30. doi: 10.1007/s00330-018-5552-6. [DOI] [PubMed] [Google Scholar]
- 38.Cai J, Xing F, Batra A, Liu F, Walter GA, Vandenborne K, et al. Texture analysis for muscular dystrophy classification in MRI with improved class activation mapping. Pattern Recognit 2019; 86:368–375. doi: 10.1016/j.patcog.2018.08.012. [DOI] [PMC free article] [PubMed] [Google Scholar]
- 39.Sharma EK, Priyanka E, Kalsh EA, Saini EK. GLCM and its features. IJARECE 2015; 4:2180–2183. [Google Scholar]
- 40.Chen Z, Chen X, Liu M, Liu S, Yu S, Ma L. Magnetic resonance image texture analysis of the periaqueductal gray matter in episodic migraine patients without T2-visible lesions. Korean J Radiol 2018; 19:85–92. doi: 10.3348/kjr.2018.19.1.85. [DOI] [PMC free article] [PubMed] [Google Scholar]