. 2020 Mar 11;9:e53672. doi: 10.7554/eLife.53672

Figure 1. X-ray crystal structures of the sheath proteins, FcpA from L. biflexa and FcpB from L. interrogans.

(A). Schematic of a Leptospira cell. Each cell has two flagella sandwiched between the inner and outer membranes; a single flagellum extends from a motor at either end. (B) Comparison of the predicted endoflagellar filament composition and morphology in Leptospira with the Salmonella exoflagellum. (C) Structure of L. biflexa FcpA in two orthogonal views, depicted as a cartoon colored with a ramp from blue (N-terminus) to red (C-terminus). The dotted line stands for the flexible 54 amino acids at the N-terminus, not visible in electron density. (D) Structure of L. interrogans FcpB in two orthogonal views, similar color code as panel A. (E) Solvent accessible surface of FcpA colored according to an electrostatic potential ramp from negative (red) through neutral (white) to positive (blue) potentials. (F) Solvent accessible surface of FcpB, similar color code as panel E. The perspective was chosen to show the interacting surface of FcpB (positively charged region, panel F left-hand side), in an open-book view (approximately 180° rotated according to a vertical axis), with FcpA (negative cleft, panel E right-hand side). This interaction was later uncovered by studying the whole filament assembly (see Figure 4E).

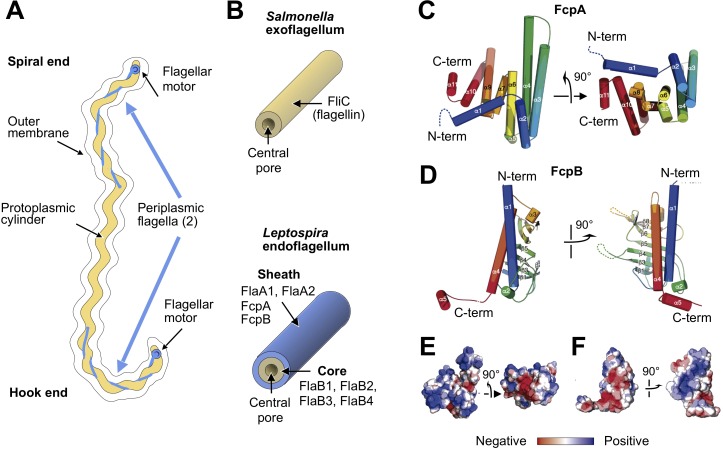
Figure 1.

Figure 1—figure supplement 1. Preferred orientation of purified coiled L.biflexa flagellar filaments in the specimen ice layer.

Figure 1—figure supplement 1.

(A) Cryo-electron micrograph showing a wild-type L. biflexa flagellar filament. (B) Schematic illustrating our definition of the tilt angle (θ) of a filament with respect to the XY-plane. (C) Representative 2D class average image from ~250 filaments imaged by cryo-EM at 0° tilt. Within cryo-EM samples, Leptospira flagella are largely restricted to the XY plane (θ~0°) due to confinement within the specimen ice layer, yielding a relatively small number of distinct class average images (<30). This restriction in the range of θ values prevents a meaningful 3D reconstruction from being obtained. (D) Close-up of the boxed region in A after applying a low-pass filter.

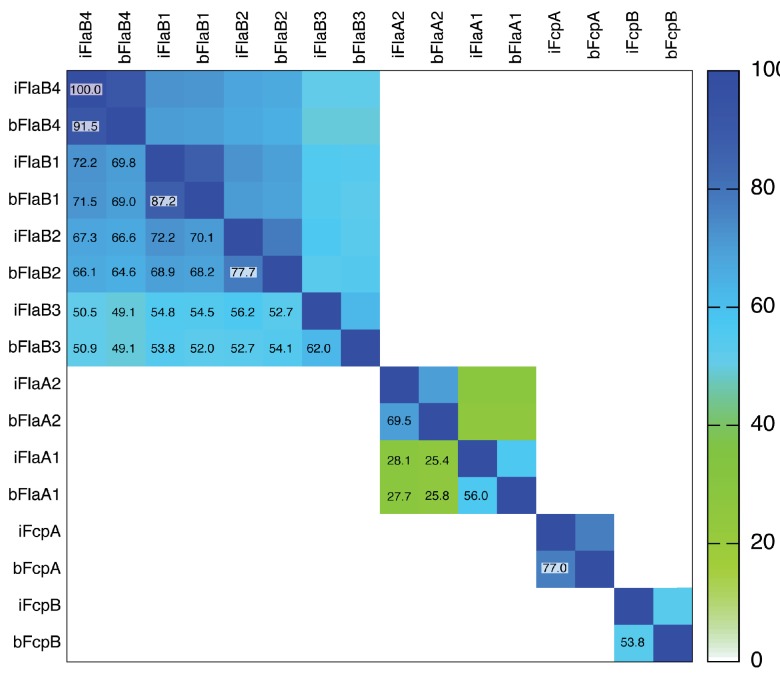
Figure 1—figure supplement 2. Square matrix plot illustrating pairwise sequence identities of flagellar filament proteins from Leptospira.

Figure 1—figure supplement 2.

Individual boxes are colored according to the ramp scale shown on the right (white - green - blue). Percent identities are also indicated in each pairwise box (the main diagonal boxes correspond to 100% self-identities). The prefixes ‘i’ or ‘b’ on the column and row labels indicate Leptospira interrogans or L. biflexa, respectively, followed by the name of the protein. Note that FlaB3 is significantly less homologous to the other three FlaB isoforms. The two FlaA isoforms, FlaA1 and FlaA2 are homologous, albeit with low sequence identity (<30%). FcpA and FcpB are not homologous between them, and FcpA shows significantly higher sequence conservation among different Leptospira species, than FcpB.