Abstract
Autism spectrum disorder (ASD) is genetically heterogeneous with convergent symptomatology, suggesting common dysregulated pathways. We analyzed brain transcriptional changes in five mouse models of Pitt-Hopkins Syndrome (PTHS), a syndromic form of ASD caused by mutations in TCF4 (transcription factor 4, not TCF7L2 / T-Cell Factor 4). Analyses of differentially expressed genes (DEGs) highlighted oligodendrocyte (OL) dysregulation, which we confirmed in two additional mouse models of syndromic ASD (Ptenm3m4/m3m4 and Mecp2tm1.1Bird). The PTHS mouse models showed cell-autonomous reductions in OL numbers and myelination, functionally confirming OL transcriptional signatures. Next, we integrated PTHS mouse model DEGs with human idiopathic ASD postmortem brain RNA-seq data, and found significant enrichment of overlapping DEGs and common myelination-associated pathways. Importantly, DEGs from syndromic ASD mouse models, and reduced deconvoluted OL numbers, distinguished human idiopathic ASD cases from controls across three postmortem brain datasets. These results implicate disruptions in OL biology as a cellular mechanism in ASD pathology.
Introduction
Autism spectrum disorder (ASD) affects approximately 1:68 individuals and has uncountable burdens on affected individuals, their families, and health care systems. While the genetic contributions to idiopathic ASD are heterogeneous and largely unknown, the causal mutations for syndromic forms of ASD, including truncations and copy number variants, provide a genetic footing with which to gain mechanistic insights 1–3. Models of these syndromic disorders have been used to characterize the downstream molecular and physiological processes disrupted by these mutations with the expectation these phenotypes will translate to idiopathic forms of ASD 4.
One form of syndromic ASD is caused by autosomal dominant mutations in the transcription factor 4 (TCF4; not TCF7L2 / T-Cell Factor 4) gene and results in Pitt-Hopkins syndrome (PTHS), a rare neurodevelopmental disorder characterized by intellectual disability, failure to acquire language, deficits in motor learning, hyperventilation, gastrointestinal abnormalities, and autistic behavior 5. TCF4 is a basic helix-loop-helix (bHLH) transcription factor that is highly expressed during cortical development, is regulated by neuronal activity, and regulates many aspects of neuronal development including neuronal excitability, pyramidal cell positioning, and neurite outgrowth 6–9. In addition, animal models of PTHS have behavioral deficits related to ASD including deficits in learning and memory, reduced ultrasonic vocalizations, and social isolation 10,11.
Two leading hypotheses for the underlying pathophysiology in ASD are abnormal neuronal connectivity and imbalances in excitation and inhibition 12,13, and these broad hypotheses likely overlap. In support of these hypotheses, several neuroimaging studies have identified defects in white matter (WM) tracts, with a reduction in corpus callosum (CC) volume being the most consistent finding 14,15. However, resolution restraints of these imaging techniques, preclude their ability to define the exact cellular structure responsible 16. Therefore, a deeper understanding of whether axons and/or myelin, the two major components of WM tracts, are altered in ASD is critical to our understanding of disease etiology and for the development of targeted treatments.
Here, we attempt to address several fundamental questions about the relevance of animal models for the study of human ASD and endeavor to identify a common pathophysiology that bridges across the ASD spectrum. To address these questions, we performed integrative transcriptomic analyses of seven independent mouse models covering three syndromic forms of ASD generated across five laboratories, and assessed dysregulated genes and their pathways in human postmortem brain from patients with ASD and neurotypical controls. These cross-species analyses converged on shared disruptions in myelination across both syndromic and idiopathic ASD, and we biologically validate OL and myelination defects in our PTHS mouse model. Together, these results highlight both the face validity of mouse models, while also identifying novel convergent molecular phenotypes amenable to potential rescue with therapeutics.
Results
Tcf4 expression is developmentally regulated across the lifespan
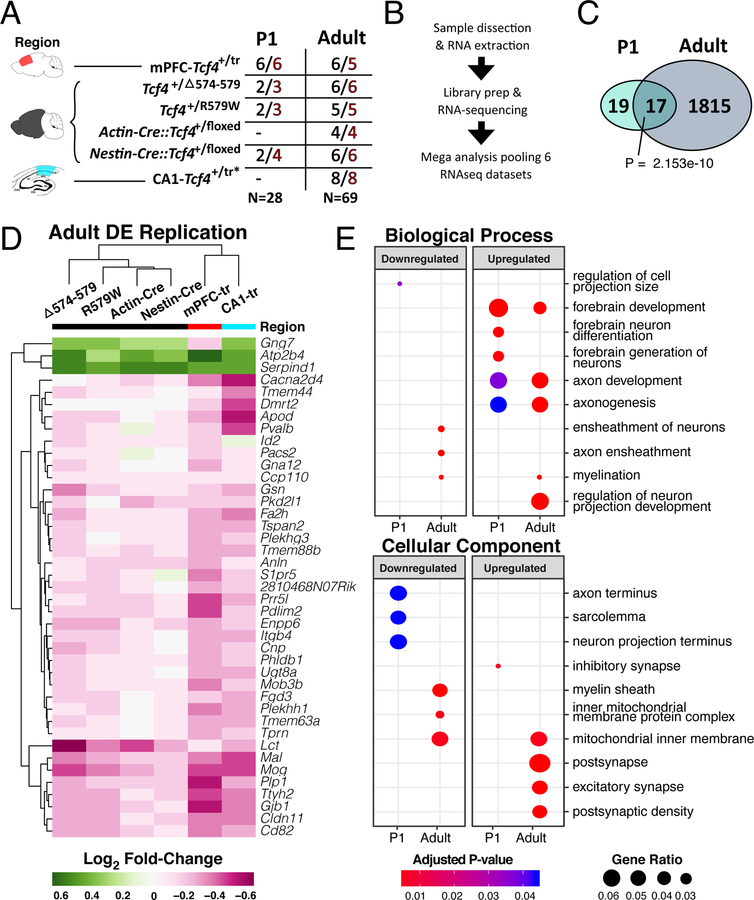
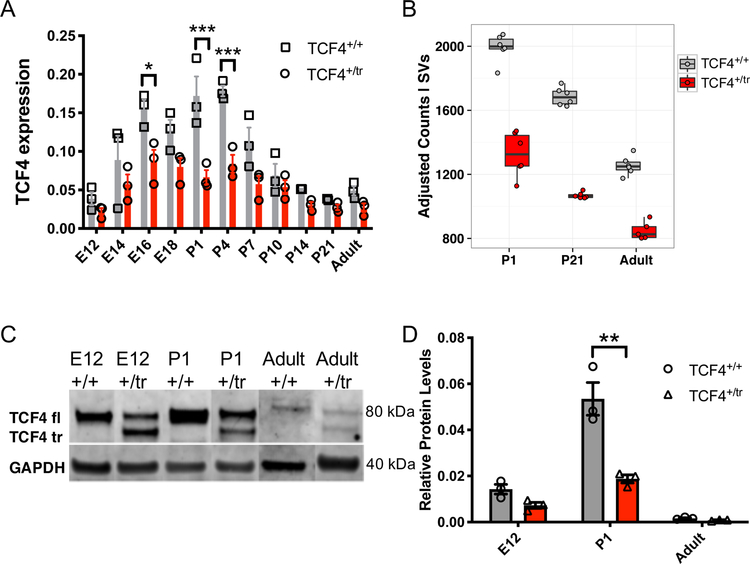
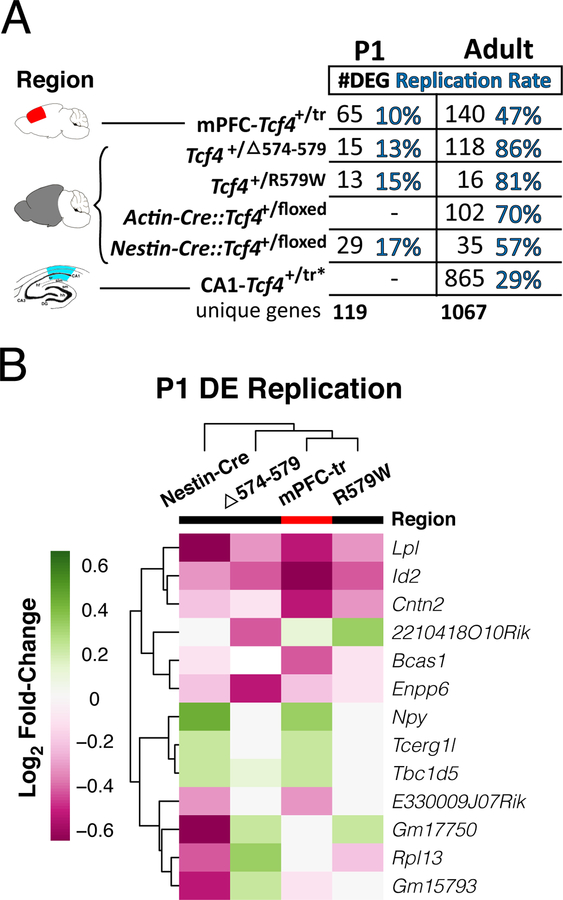
We first assessed molecular convergence across five independent mouse models of Pitt-Hopkins syndrome (PTHS), which model TCF4 protein haploinsufficiency and/or translation of dominant-negative TCF4 proteins 17. We first generated RNA-seq data from prefrontal cortex (PFC) of a PTHS mouse line that shows heterozygous expression of a truncated TCF4 protein with dominant-negative properties (Tcf4+/tr) 17. The Tcf4+/tr mouse showed significant blunted expression of full-length Tcf4 transcript (Extended Data Fig. 1a,b) and protein (Extended Data Fig. 1c,d) in the brain between embryonic day 16 and postnatal day 4 (E16, P4) and smaller difference in expression in adulthood (Extended Data Fig. 1a,b,d). This mirrored a similar expression pattern across the human lifespan 6, suggesting there may be a critical period for the genesis of PTHS that coincides with early cortical development, which is consistent with other syndromic and idiopathic forms of human ASD 18. In addition to the Tcf4+/tr PFC RNA-seq and published Tcf4+/tr hippocampal dataset10, we further created and processed RNA-seq data from four additional mouse lines harboring heterozygous Tcf4 mutations or deletions: Tcf4+/D574−579, Tcf4+/R579W, Actin-Cre::Tcf4+/floxed and Nestin-Cre::Tcf4+/floxed 11. Given that Tcf4 is developmentally regulated and plays a role in gene regulation, we assessed the effects of heterozygous Tcf4 mutations (Tcf4+/mut) on the mouse transcriptome from the prefrontal cortex, CA1 region of hippocampus, and hemi-brain at P1 and in adulthood (Fig. 1a).
Figure 1: RNA-seq of multiple Tcf4 mutations reveal age-specific differential gene expression.
(A) Summary table of the 5 mouse lines of Tcf4 mutation sequenced in this analysis. Samples come from 3 regions, medial prefrontal cortex, hemibrain, and hippocampal CA1 (colored red, black, and teal, respectively). Two age groups, P0–2 (P1) and >P42 (adult), were assessed in this study. N’s of wild-type and PTHS mice are colored black and red, respectively. (B) General sample-to-analysis RNA-seq pipeline. (C) Venn diagram of DEGs in P1 and adult mice by Tcf4+/mut genotype across all mouse lines and tissue regions (FDR<0.05). There are 36 DEGs in P1 group, and 1832 DEGs in adult group. A significant group of 17 genes are differentially expressed in both P1 and adult age groups (Fisher’s exact test, p=2.153 e-10). (D) Log2 fold-change heatmap of DEGs from the mega-analysis shows high concordance of differential expression across other mouse lines (replication defined as the same gene also differentially expressed in another model with two-sided p<0.05). (E) Dot plot of gene ontology (GO) enrichment analysis of DEGs split by up- or down-regulated genes to determine functional pathways affected in PTHS mice brain (q-adjusted two-sided hypergeometric test, padj < 0.05). Gene ratio dot size represent % of genes for each GO term differentially expressed.
RNA-seq of multiple Tcf4 mutations reveals age-specific differential gene expression.
Differential expression analysis of each Tcf4+/mut mouse model by age showed differentially expressed genes (DEGs) in both the P1 and adult brain, with overall high concordance and replication rates across these varied models and tissue sources (Fig. 1d, Extended Data Fig. 2, Supplementary Table 1). Combined analysis across the RNA-seq data from these multiple models of PTHS revealed widespread transcriptional dysregulation in the adult mouse brain in Tcf4+/mut versus wild-type (WT) (Fig. 1c, Supplementary Table 2). Gene ontology (GO) analysis of the DEGs identified from Tcf4+/mut mice showed age-specific processes (Fig. 1e, Supplementary Table 3). Genes upregulated in adult brains were enriched for processes associated with forebrain development, neuron projection, axon development, excitatory synapses, and postsynaptic density, while downregulated genes were enriched in processes associated with axon ensheathment, and myelination. Together, these bioinformatic analyses suggest that TCF4 mutation leads to upregulation of genes associated with neuronal function while downregulated genes are associated with oligodendrocytes and myelination.
Cell-type specific expression analysis identifies DEGs are enriched in oligodendrocytes
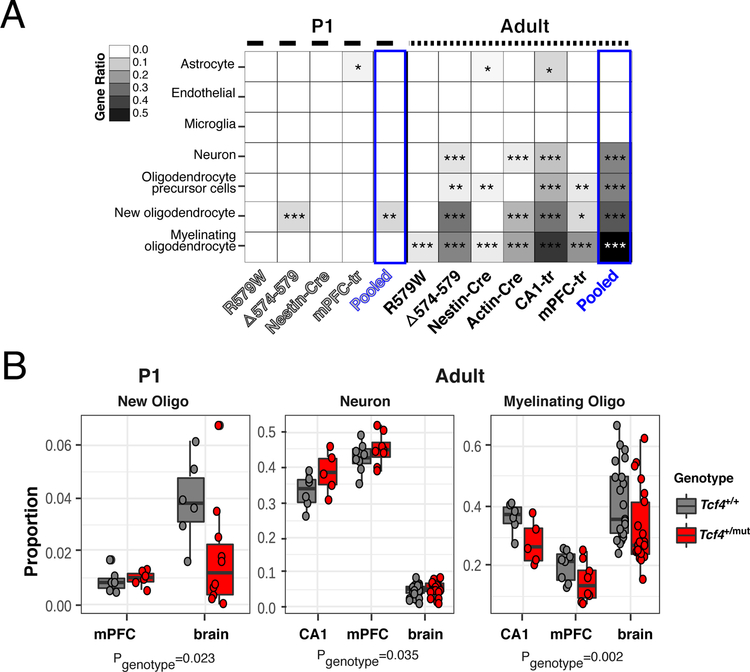
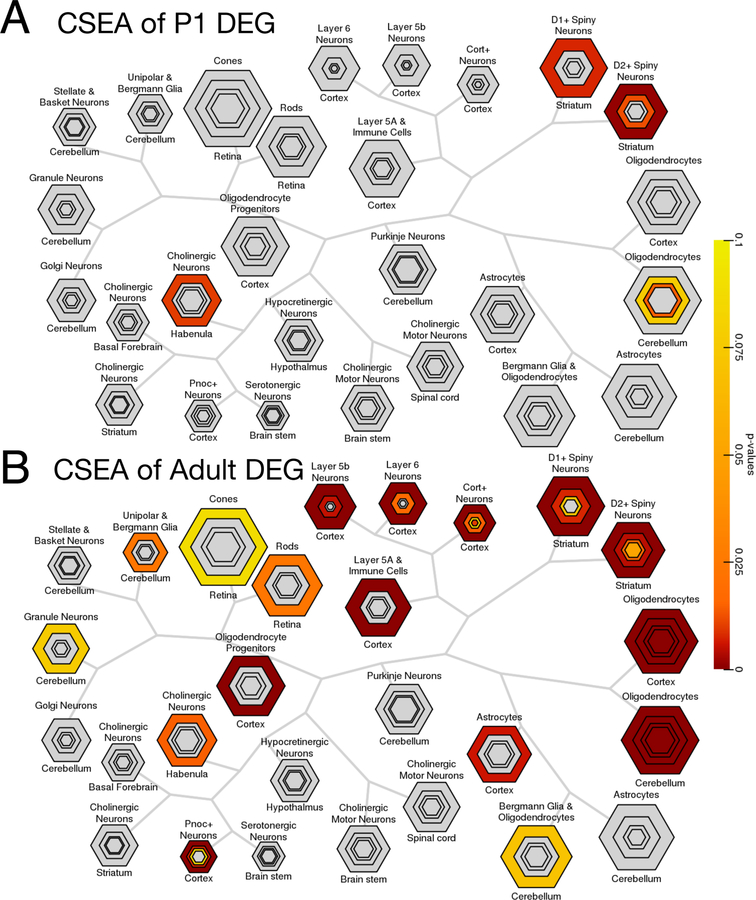
Cell type-specific analysis (CSEA) using expression levels from microarrays (Extended Data Fig. 3) and RNA-seq of purified mouse cell types further implicated OLs as the candidate cell type implicated in Tcf4+/mut mice (Fig. 2a). For example, adult mouse lines across all Tcf4+/mut models showed OL enrichment at all developmental stages with the most significant enrichment found in myelinating OLs, where more than 55% of cell type-specific genes were differentially expressed in our mega-analysis. These results confirm our gene set enrichment analyses, where enrichment was primarily observed in adult samples and from biological and cellular processes associated with neurons and OLs. We further applied RNA deconvolution using RNA-seq of purified mouse cell types to obtain the estimated proportion of RNA signal attributed to each cell type, and identified a significant increase in the proportions of RNA coming from neurons and astrocytes and a significant decrease in the proportion of RNA coming from myelinating OLs in adult Tcf4+/mut mice. Moreover, cell type deconvolution analyses showed new OL proportions were decreased in P1 brains and myelinating OL proportions were decreased in adult brain (Fig. 2b), matching the expected developmental trajectory of the OLs. These findings together suggest Tcf4 mutation leads to deficits in myelination due to fewer mature OLs and/or less active expression of OL-specific genes.
Figure 2: Oligodendrocyte-specific deficits in PTHS model mice.
(A) Heatmap plotting the ratio of cell type-specific genes that are DEGs. Differential expression in all adult mouse lines were highly specific to myelinating OL signature genes (n=21,196–25,848 expressed genes in within an age/mouse line, FDR-adjusted two-sided Fisher’s exact test for gene set enrichment, padj<0.05). New OLs, their precursors, neurons, and astrocytes are enriched in DEGs across all Tcf4 mutant mouse models, but most present in the adult brain (padj<0.05). (B) CIBERSORT cell proportions analysis of PTHS mice stratified by sample tissue source. New OL proportions are down in P1 brains, neuron proportions are up in adult brain, and myelinating OL proportions are down in adult brain (two-sided linear regression of related proportions for Tcf4 effect, NP1= 28, New OL p = 0.023; NAdult = 69, Neuron p= 0.035, Myelinating OL p = 0.00155). Boxplot display the quartiles and median of cell type proportions. (Abbreviations: R579W = Tcf4+/R579W; D574–579 = Tcf4+/D574−579; Nest-Cre = Nestin-Cre::Tcf4+/floxed; Actin-Cre = Actin-Cre::Tcf4+/floxed; mPFC-tr = Tcf4+/tr medial prefrontal cortex; CA1-tr = Tcf4+/tr hippocampal CA1 neurons; FPKM = fragments per kilobase per million reads mapped, * Padj <0.05, ** Padj <0.01, *** Padj < 0.001)
Shared myelination gene regulation between mouse models of syndromic ASD
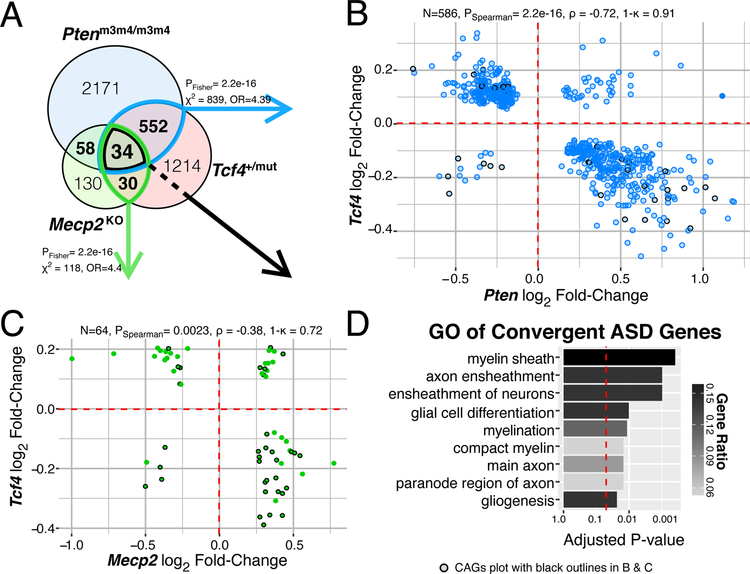
Syndromic forms of ASD are caused by varying mutations yet share significant overlap in their symptomatology, suggesting that dysregulation of convergent biological processes may underlie syndromic ASD. We therefore compared DEGs in adult Tcf4+/mut mouse brains to genes dysregulated in mouse models of PTEN-associated autism (Ptenm3m4/m3m4; 19) and Rett syndrome (Mecp2tm1.1Bird; 20) to characterize shared gene regulation between these three mouse models of syndromic ASD. Remarkably, we found significant overlap of DEGs in Tcf4+/mut vs. Ptenm3m4/m3m4and Tcf4+/mut vs. Mecp2tm1.1Bird mutations (Fig. 3a), with Tcf4 mutations inversely regulating DEGs in Pten and Mecp2 models (Fig. 3b,c). Overall, 34 DEGs were common to all three mouse models, herein referred to as “convergent ASD genes” (CAGs; Fig. 3a,d, Supplementary Table 4). The CAGs were strongly enriched for several myelination-related GO terms, representing up to 15% of the genes involved in processes related to myelination (Fig. 3d). The CAGs are generally down-regulated in the Tcf4 mice while being up-regulated in mice harboring Pten and Mecp2 mutations (Fig. 3b,c). The inverse directionalities of the CAGs between Tcf4 and both Mecp2 and Pten are consistent with prior studies demonstrating that decreased PTEN and MeCP2 protein expression promoted OL expansion, maturation and myelination in animal and cell models 21,22. The mixed directionalities of the CAGs across these three models of syndromic ASD suggests that either hypo- or hyper-myelination have potentially negative consequences on brain function. More generally, we found strong enrichment between the genes dysregulated by TCF4 and other genes implicated in syndromic forms of ASD. Of the 234 ASD risk genes listed in the SFARI Animal Model Module, 28.2% (72/255) were differentially expressed in our mega-analysis (odds ratio [OR]=3.14, hypergeometric p-value=1.23e-12). The significant overlap of differential expression between these mouse models of syndromic ASD and their apparent correlational effects on myelination suggests deficits in OL development and function is potentially a common molecular pathway disrupted in syndromic ASD.
Figure 3: Shared myelination gene regulation between mouse models of syndromic ASD.
(A) Venn diagram of DEGs in each mouse model of ASD (FDR < 0.05). There is significant overlap of DEGs from Tcf4 mutation vs. Mecp2 or Pten homozygous mutation (Two-sided Fisher’s Exact test, p=2.2e-16). (B-C) Log2 fold-change comparison of the genes differentially expressed both in Tcf4 heterozygous mutation and Mecp2 knockout or Pten homozygous mutation, respectively. DEG fold-change directionality in TCF4 mutant mice is inversely correlated (ρ < 0) to that in MeCP2 and Pten mutation suggesting TCF4 plays an opposite role in regulating these genes. 34 genes differentially expressed in all three mutations, referred to as the convergent ASD genes (CAG) are plot with black outlines. (B) The 586 DEGs in the Tcf4 vs. Pten comparison had 91% opposite fold-change directions and displayed strong negative correlation (Spearman correlation p=2.2e-16, ρ = −0.71). (C) The 64 overlapping DEGs in the Tcf4 vs. Mecp2 group had 72% opposite fold-change directions with significant negative correlation (Spearman correlation p=0.0023, ρ = −0.38). (D) Top GO terms of the CAGs enrich for myelination processes (q-value adjusted hypergeometric test Padj=0.0149). (ρ, Spearman’s correlation coefficient, κ, concordance rate).
Functional validation of myelination deficits in the PTHS mouse model.
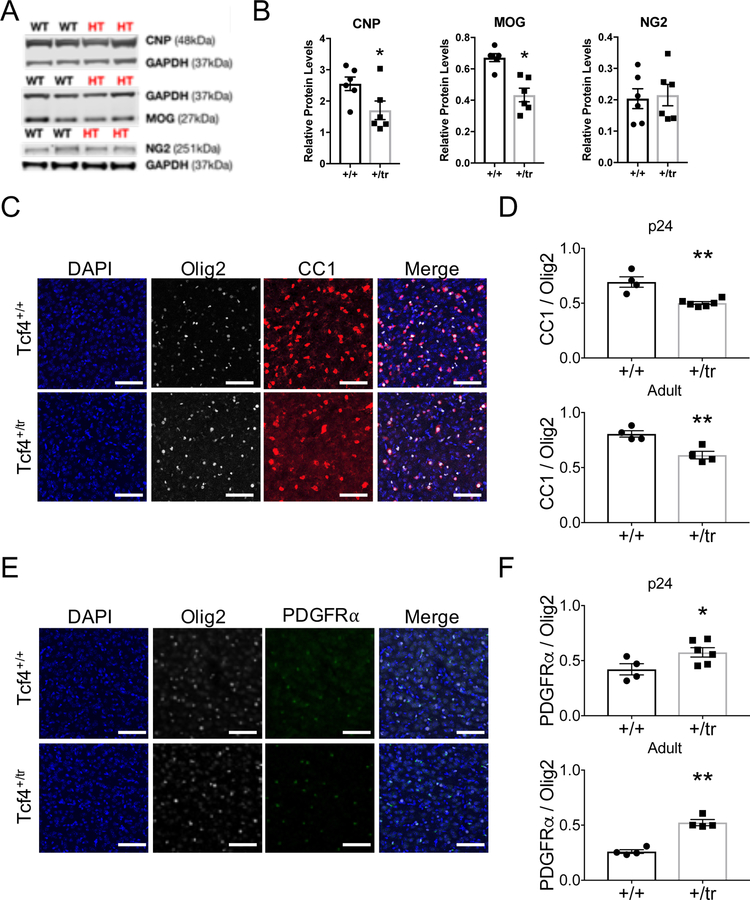
To confirm the presence of myelination deficits in our PTHS mouse model and validate our RNA-seq signatures, we performed ex vivo and in vitro experiments to quantify OLs and myelination. First, we performed Western blots from adult mouse brain lysates and measured expression of the myelinating OL proteins CNP and MOG, and OL precursor cell (OPC) marker NG2. CNP and MOG were significantly decreased in Tcf4+/tr mice compared to Tcf4+/+ littermates, while NG2 protein expression was similar (Fig. 4a,b).
Figure 4: Validation of myelination defects due to Tcf4 mutation.
(A) Western blot for myelinating OL proteins, CNP and MOG, and an OL precursor cell protein, NG2, normalized to GAPDH in mPFC-Tcf4+/tr. (B) Relative protein levels of MOG and CNP are significantly decreased in Tcf4+/tr brain (two-sided unpaired t-test, n=12 mice, pMOG=0.0008, pCNP=0.0436). Relative levels of NG2 do not differ between genotypes (two-sided unpaired t-test, n=12 mice, p=0.815). (C) Representative immunostaining for the mature OL marker CC1 and pan-OL marker Olig2 in the cortex of p24 Tcf4+/+ and Tcf4+/tr mice. (D) The proportion of Olig2-positive cells that are CC1-positive is significantly reduced in p24 Tcf4+/tr mice (Tcf4+/tr 0.69±0.05 vs. Tcf4+/+ 0.50±0.01, two-sided unpaired t-test, n=10 mice, p=0.0016) and adult Tcf4+/tr mice (Tcf4+/tr 0.61±0.04 vs. Tcf4+/+ 0.81±0.03, two-sided unpaired t-test, n=8 mice, p=0.0055). (E) Representative immunostaining for the OPC marker PDGFRɑ and pan-OL marker Olig2 in the cortex of p24 Tcf4+/+ and Tcf4+/tr mice. (F) The proportion of Olig2-positive cells that are PDGFRɑ-positive is significantly increased in p24 Tcf4+/tr mice (Tcf4+/tr 0.58±0.04 vs. Tcf4+/+ 0.42±0.05, two-sided unpaired t-test, n=10 mice, p=0.0495) and adult Tcf4+/tr mice (Tcf4+/tr 0.52±0.03 vs. Tcf4+/+, two-sided unpaired t-test 0.26±0.02, n=8 mice, p=0.0002). All scale bars equal 100µm. Center values represent the mean and error bars are S.E.M., *p<0.05, **p<0.01.
Next, to determine if decreased RNA and protein levels of OLs markers were due to decreased numbers of mature OLs, we performed immunohistochemical (IHC) cell counts on brain sections from Tcf4+/tr and Tcf4+/+ mice. We quantified the population of OPCs and mature OLs using antibodies against PDGFRα and CC1 (anti-APC), respectively. To control for heterogeneity in OL density in the gray matter, we performed blinded cell counts on anatomically equivalent brain sections and normalized our counts using the pan-OL marker, OLIG2. At P24, we observed a significant decrease in the proportion of CC1-positive OLs (Fig. 4c,d) and a significant increase in the proportion of PDGFRα-positive OPCs in the cortex of Tcf4+/tr mice compared to Tcf4+/+ littermates. A similar result was observed in brain sections from adult mice (P42; Fig. 4e,f), suggesting TCF4-dependent myelination defects are present by P24 and are preserved through adulthood.
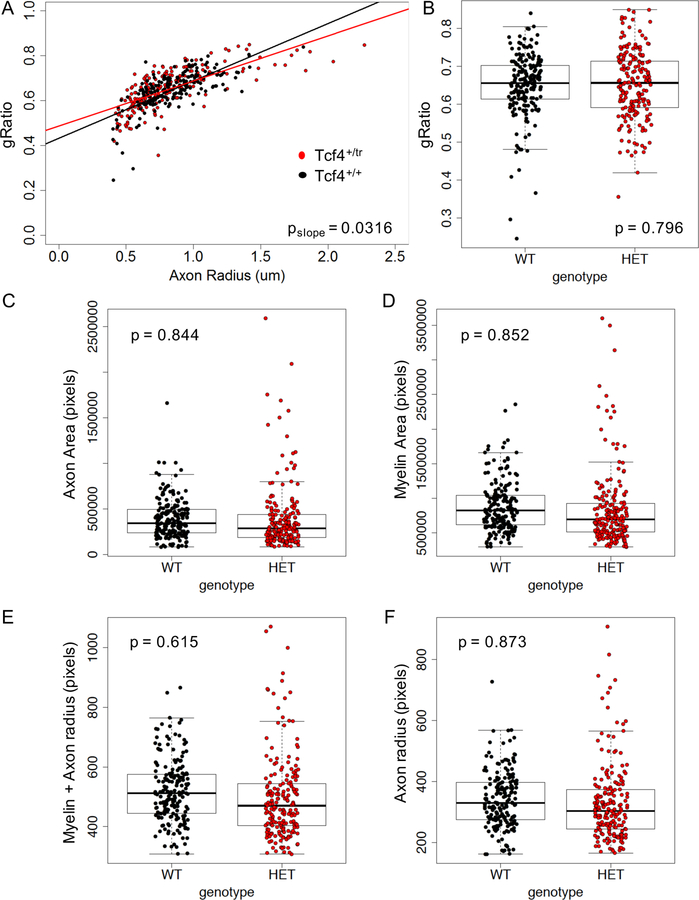
Next, we used transmission electron microscopy (TEM) to visualize myelination in the CC of Tcf4+/tr and Tcf4+/+ littermates. Blinded to genotype, TEM images were taken of the CC directly above the dorsal hippocampus from anatomically equivalent tissue sections between littermates. Using blinded quantification, we did not observe a genotype difference in the gRatio, axonal area, or myelin area (Extended Data Fig. 4). However, we did observe a significant decrease in the proportion of myelinated axons in the CC of Tcf4+/tr mice compared to Tcf4+/+ littermates (Fig. 5a,b), which is consistent with our Western blot and IHC results (Fig. 4).
Figure 5: The proportion of myelinated axons in the corpus callosum is reduced in TCF4 mutant mice.

(A) Representative electron micrographs of the CC from Tcf4+/+ and Tcf4+/tr mice. TEM images were quantified from 4 Tcf4+/+ and 5 Tcf4+/tr mice. (B) The proportion of axons myelinated across images was significantly reduced in Tcf4+/tr mice (logistic mixed effects model, OR=0.65, n=9 mice, p=0.046). The size of circles is proportional to the number of axons per image and the colors indicate the animal each slice was obtained from. (C) Representative electrophysiology traces of evoked compound action potentials recorded in the CC from Tcf4+/+ and Tcf4+/tr mice. N1 represents action potentials traveling down myelinated axons and N2 represents action potentials traveling down unmyelinated axons. (D) The proportion of action potentials traveling down myelinated axons was consistently reduced in Tcf4+/tr mice compared to Tcf4+/+ mice (n=30 brain slices from 4 Tcf4+/+ and 5 Tcf4+/tr mice, ANOVA p=0.0012). Center values represent the mean and error bars are S.E.M., *p<0.05, **p<0.01, ***p<0.001.
We next determined if the reduction of myelinated axons in the CC of the Tcf4+/tr mice is physiologically relevant to the propagation of compound action potentials (CAPs) in the CC by performing electrophysiological recordings. Acute coronal brain slices were obtained from P29–32 Tcf4+/tr and Tcf4+/+ littermates. CAPs were evoked by a bipolar stimulating electrode and recorded by a field electrode placed at varying distances across the CC (Fig. 5c). The N1 nad N2 peaks represents CAPs traveling down myelinated unmyelinated axons, respectively 23. Tcf4+/tr brain slices showed a significant reduction in the N1/N2 proportion suggesting more CAPs are traveling down unmyelinated axons in these animals (Fig. 5d). We also calculated conduction velocity of CAPs, and observed no difference between Tcf4+/tr and Tcf4+/+ littermates (Extended Data Fig. 5), suggesting that when axons are myelinated in Tcf4+/tr mice, the process appears to occur normally. In summary, our TEM and electrophysiology results indicate that the PTHS mouse has a pathological reduction in the proportion of myelinated axons that leads to a greater proportion of neuronal activity being transmitted down unmyelinated axons.
To further investigate the role of TCF4 in regulating the differentiation and/or maturation of OLs, we performed several in vitro studies to monitor the growth and differentiation of primary OPCs and OLs that were dissociated from the brains of Tcf4+/tr and Tcf4+/+ mice. First, we generated primary neuronal cultures from P0 cortices and performed immunocytochemistry (ICC) to quantify the population of OLs in our cultures. After arresting mitosis with Ara-C treatment, we observed a significant reduction in the number of CNP-positive OLs in primary cultures derived from Tcf4+/tr mice compared to Tcf4+/+ littermates (Fig. 6a,b). Moreover, cultures derived from Tcf4tr/tr mice, which typically die hours after birth, but can produce viable primary neuronal cultures, failed to produce any CNP-positive OLs (Fig. 6b). This further confirms Tcf4 plays a role in producing/maintaining the number of mature OLs in our cortical cultures. However, because of the diverse cell populations in these cortical cultures, it is unclear whether the reduction of OLs is due directly to Tcf4 mutation within OL lineage or arises from a non-cell autonomous mechanism.
Figure 6. In vitro biological validation of myelination defects due to Tcf4 mutation.
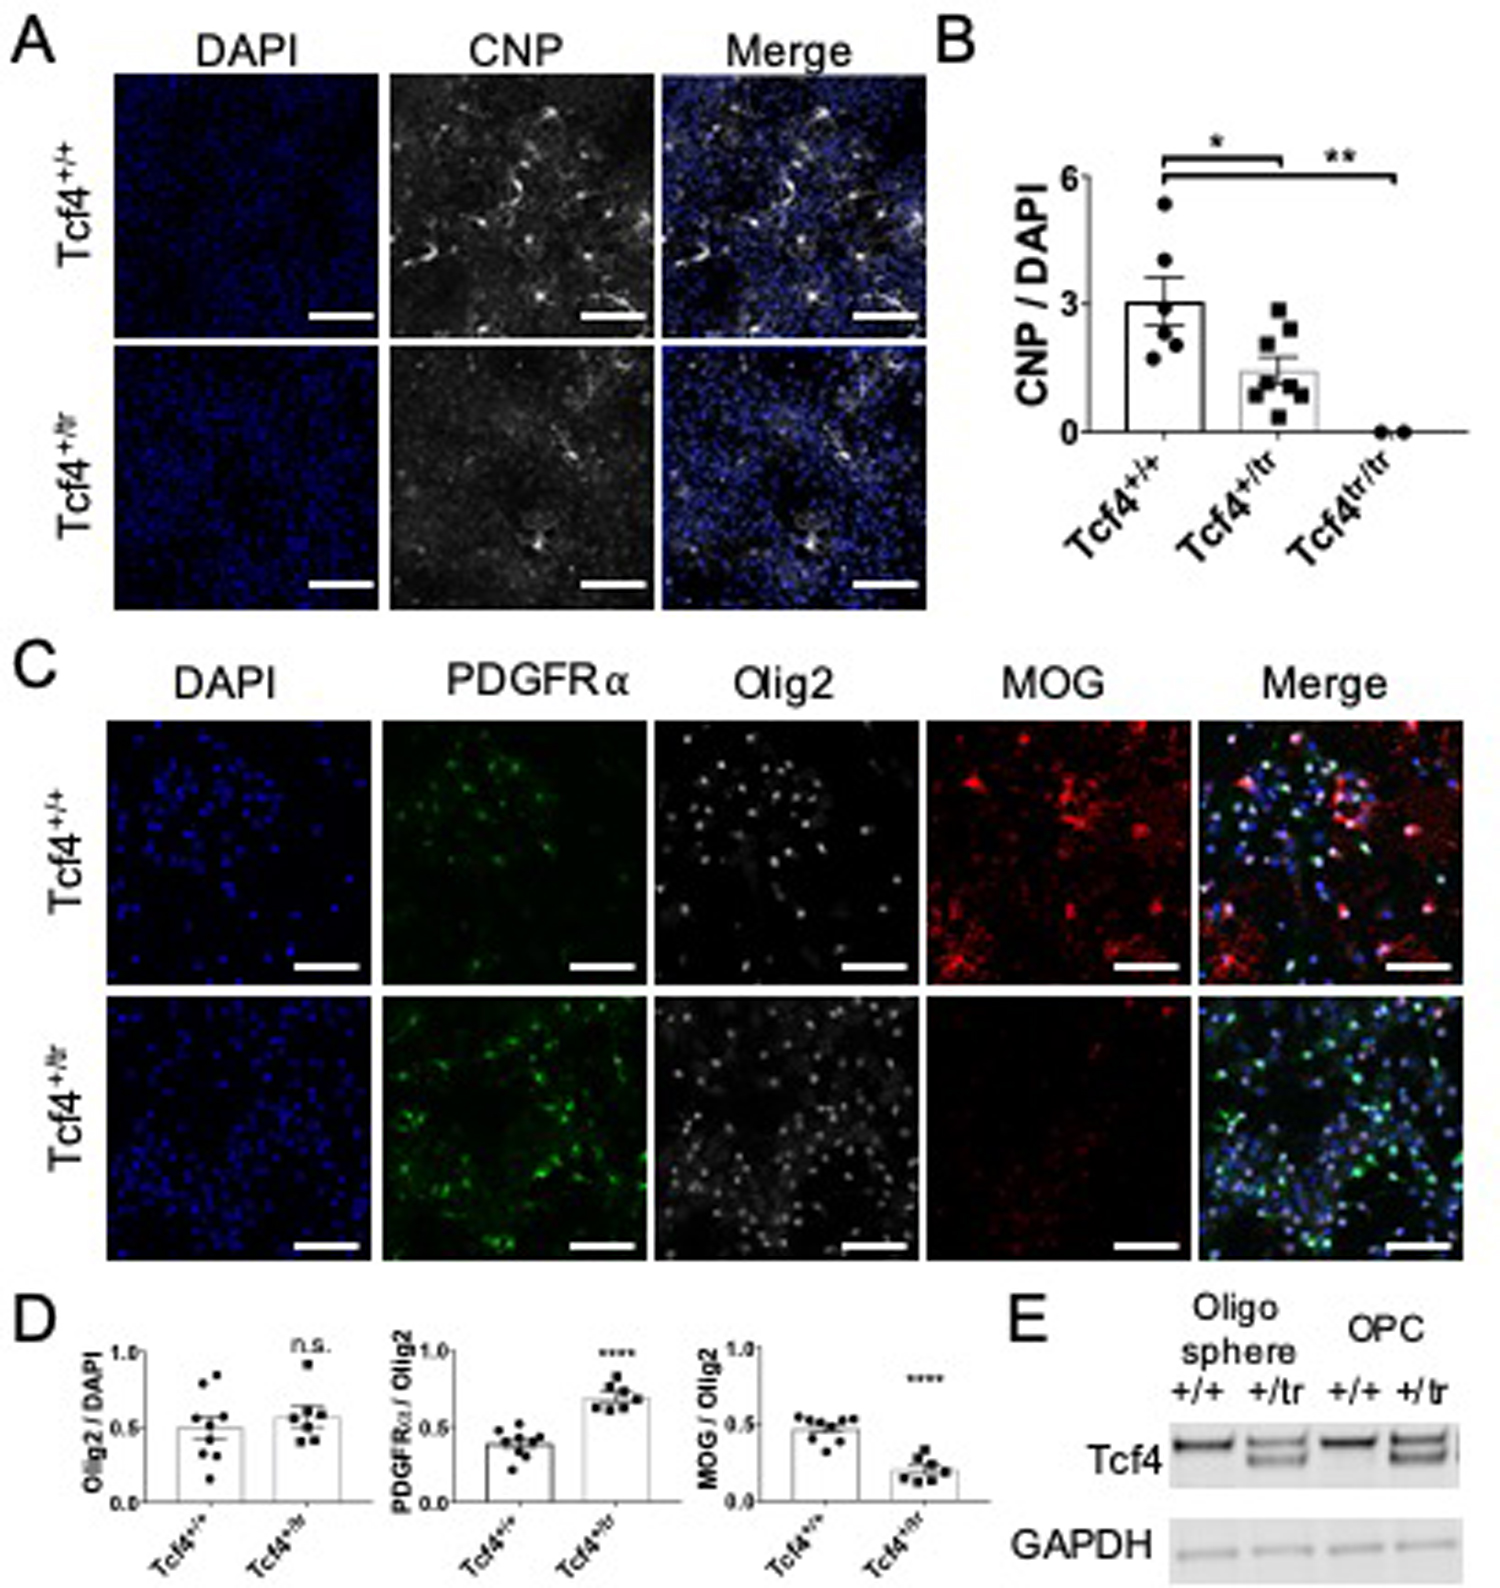
(A) Representative images of CNP-positive OLs in primary neuronal cultures derived from Tcf4+/+ and Tcf4+/tr mice. (B) The proportion of CNP-positive cells in significantly reduced in cultures derived from Tcf4+/tr mice (Tcf4+/+ 3.07%±0.57% vs. Tcf4+/tr 1.46%±0.31%, n=16 mice, ANOVA p=0.0074, Posthoc p=0.031). Tcf4tr/tr mice failed to produce any CNP-positive OLs. (C) Representative images of OPCs (PDGFRα) and mature OLs (MBP) derived from Tcf4+/+ and Tcf4+/tr mice. To control for cell numbers all cell counts are normalized by the pan-OL marker Olig2 that labels both OPC and mature OLs. (D) Cultures derived from Tcf4+/tr mice produce significantly more OPCs (Tcf4+/+ 0.39±0.03, n=9 vs. Tcf4+/tr 0.69±0.03, two-sided unpaired t-test, n=16 mice; p<0.0001) and fewer MOG-positive OLs (Tcf4+/+ 0.47±0.03, n=9 vs. Tcf4+/tr 0.21±0.03, two-sided unpaired t-test, n=16 mice; p<0.0001). (E) Example Western blot showing TCF4 protein is expressed in these OL cultures (repeated from independent cultures derived from 3 Tcf4+/+ and 4 Tcf4+/tr mice). All scale bars equal 100µm. For all bar graphs, center values represent the mean and error bars are S.E.M.; *p<0.05, **p<0.01, ***p<0.001, ****p<0.0001.
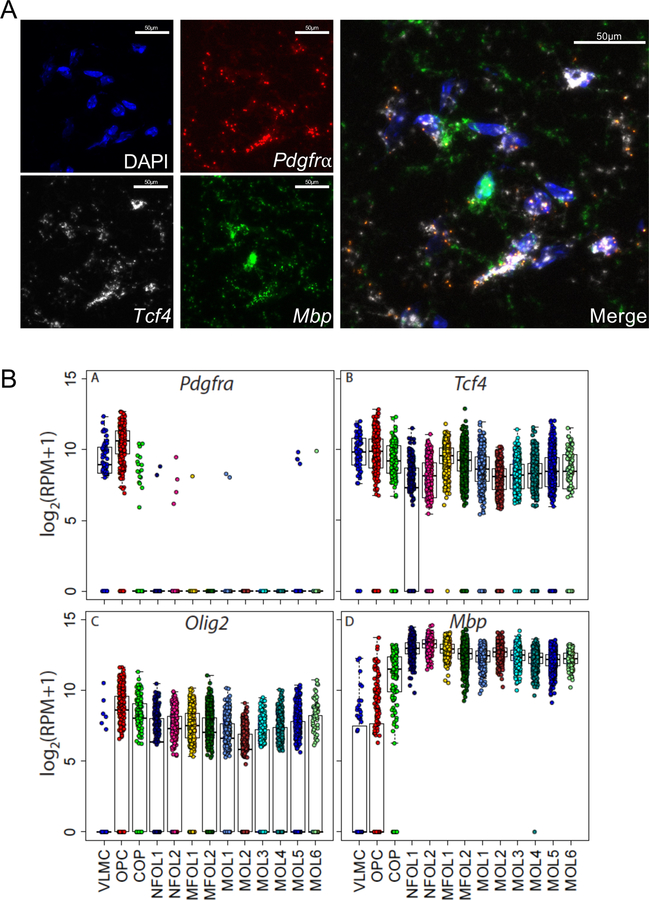
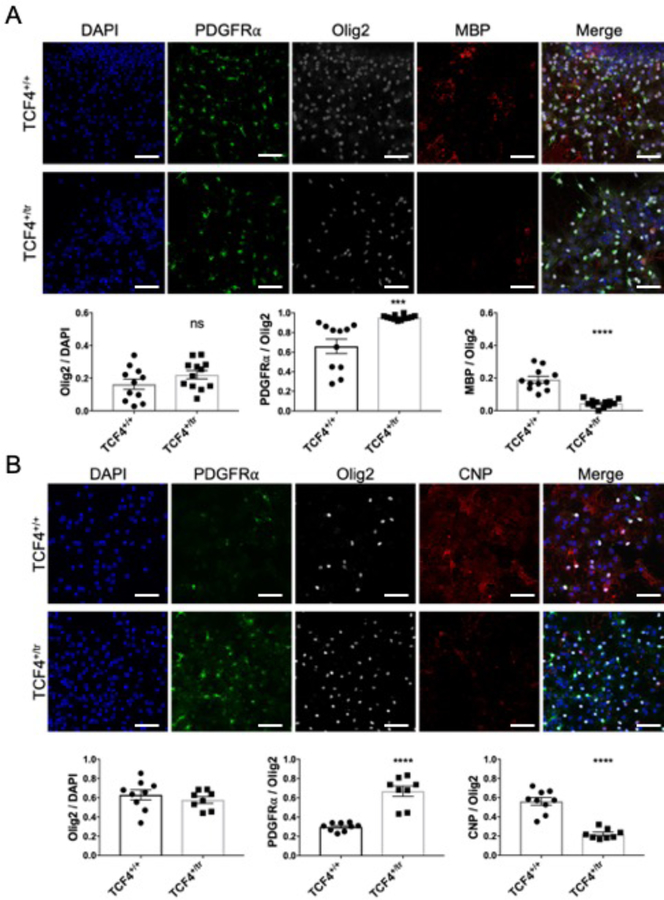
To determine if TCF4 protein directly regulates differentiation and/or survival of OLs we first confirmed Tcf4 transcript is expressed in the OL lineage. Fluorescent in situ hybridization experiments in mouse cortical brain sections showed Tcf4 transcripts are present in both OPCs and OLs (Extended Data Fig. 6a), and this result matches previously published single-cell sequencing data (Extended Data Fig. 6b) 24. We next asked if Tcf4 mutation affects OL development in a cell-autonomous manner by dissociating OPCs from neonatal Tcf4+/tr and Tcf4+/+ mice using a protocol that generates a 98% pure population of cell-types within the OL lineage 25. We confirmed the purity of these cultures using ICC for the neuronal markers Tuj1 and NeuN, and the astrocyte marker GFAP. We observed only rare Tuj1+, NeuN+ or GFAP+ cells within our cultures (Extended Data Fig. 7). After a period of OPC expansion, primary OPC cultures were differentiated for two days, and ICC was performed using antibodies against PDGFRα, MOG, and OLIG2 to measure the proportions of OPCs and OLs present in the culture. Similar to ex vivo IHC results, blinded quantification of cultures derived from Tcf4+/tr mice cortices showed a significant increase in the proportion of OPCs compared to Tcf4+/+ mice (Fig. 6c,d). Although Tcf4+/tr mice produced more OPCs in culture, we observed a significant decrease in the proportion of MOG-positive OLs compared to Tcf4+/+ cultures (Fig. 6c,d). This result was replicated using antibodies against MBP and CNP (Extended Data Fig. 8a,b). In addition, protein lysates from these cultures were positive for both full-length and truncated TCF4 protein (Fig. 6e). These results indicate this phenotype appears to result directly from Tcf4 mutation within the OL population because there are no other cell types present within these cultures that could provide a non-cell autonomous signal. As an additional confirmation of a cell autonomous role for Tcf4 in regulating OL differentiation and/or survival, we genetically deleted a single Tcf4 allele in the OL lineage by crossing the Olig2-Cre+/− mouse with the Tcf4+/flox mouse. We performed blinded quantification of OPCs and OLs in the cortex of P24 mice, and observed a significant reduction in the proportion of CC1-positive OLs (Fig. 7a,b) and a significant increase in the proportion of PDGFRα-positive OPCs (Fig. 7a,c) in the cortex of Olig2-Cre+/−; Tcf4+/flox mice compared to Olig2-Cre+/−; Tcf4+/+ littermates. These results not only indicate that OL lineage-specific deletion of Tcf4 successfully phenocopied OL defects observed in animals with Tcf4 germline mutations, but also confirm that TCF4 regulates OPC differentiation and/or OL survival in a cell autonomous manner.
Figure 7: TCF4 regulation of oligodendrocytes is cell autonomous.
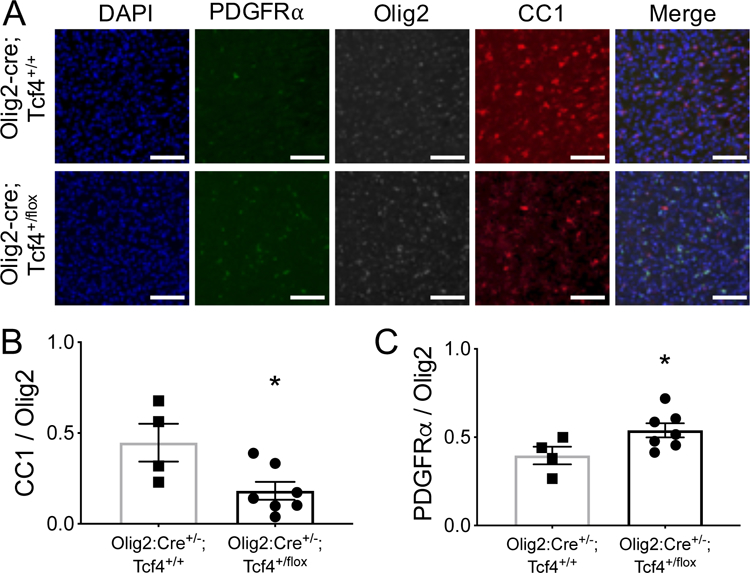
(A) Representative immunostaining for the OPC marker PDGFRα, mature OL marker CC1 and pan-OL marker Olig2 in the cortex of p24 Olig2-Cre; Tcf4+/+ and Olig2-Cre; Tcf4+/flox mice. (B) The proportion of Olig2-positive cells that are CC1-positive is significantly reduced in Olig2-cre; Tcf4+/flox mice compared to Olig2-Cre+/−;Tcf4+/+ cultures (Olig2-Cre+/−;Tcf4+/flox 0.19±0.05 vs. Olig2-Cre+/−;Tcf4+/+ 0.45±0.10, n=11 mice, one-tailed unpaired t-test p=0.015). (C) The proportion of Olig2-positive cells that are PDGFRα-positive significantly increased in Olig2-cre; Tcf4+/flox mice (Olig2-Cre+/−;Tcf4+/flox 0.52±0.04 vs. Olig2-Cre+/−;Tcf4+/+ 0.40±0.05, one-tailed unpaired t-test, n=11 mice, p=0.028). All scale bars equal 100µm. For all bar graphs, center values represent the mean and error bars are S.E.M.,*p<0.05.
Human-mouse convergence of gene expression in idiopathic and syndromic ASD
Lastly, we examined the role of OL disruption in idiopathic ASD, which are more prevalent in the human population, but due to their polygenic nature are more difficult to model in animals. First, we found significant enrichment of adult Tcf4+/mut mice DEGs in the SFARI Human Gene Module of ASD candidate risk genes. Approximately one fifth of the homologous SFARI Human Gene module genes were DEGs in the Tcf4+/mut mice (N=190/992) and 46 of these are causal for syndromic ASD (Supplementary Table 5, Fisher’s exact test, OR = 2.12, p=2.2 e-16), suggesting TCF4 may be an upstream regulator of a variety of previously identified ASD risk genes. Sensitivity enrichment analyses of overlapping adult Tcf4+/mut mice DEGs with SFARI Human Genes with higher scientific evidence to contribute to ASD (i.e. scores 1–3 or Syndromic) demonstrated significant enrichment (Fisher’s exact test, OR = 2.96, p=2.2 e-16). We next tested our adult Tcf4+/mut mice DEGs with human homologs implicated in ASD by two large, unbiased de novo variant analyses 26,27 to replicate the enrichment signal with human ASD (Sanders et al. N= 25/61, Fisher’s exact test OR = 5.92, p=7.33 e −10; Satterstrom et al. N = 35/97, Fisher’s exact test OR = 4.83, p= 2.33 e-16). Of note, TCF4 is one of the 102 ASD risk genes identified by Satterstrom et al. that contributes more to the neurodevelopmental delay ascertained cohort. We further identified significant enrichment of DEGs in the Tcf4+/mut mice among published WGCNA co-expression modules from microarray of human ASD postmortem brain 28, BrainSpan RNA-seq of developing human neocortex 29, and RNA-seq from human postmortem prefrontal and temporal cortex 30 (Supplementary Table 6). Specifically, we found the strongest enrichment of Tcf4+/mut DEGs among human genes involved in myelination, axon ensheathment, and gliogenesis (asdM14, adjusted hypergeometric p-value=5.6e-20). In addition, we observed Tcf4+/mut DEGs showed enrichment in other previously identified co-expression modules involved in synaptic transmission and mRNA processing (Supplementary Table 6). Enrichment in these gene co-expression modules supports the idea that gene networks disrupted in Tcf4+/mut mice are similar to gene networks disrupted in human ASD, and further identifies myelination as an additional pathway disrupted in ASD.
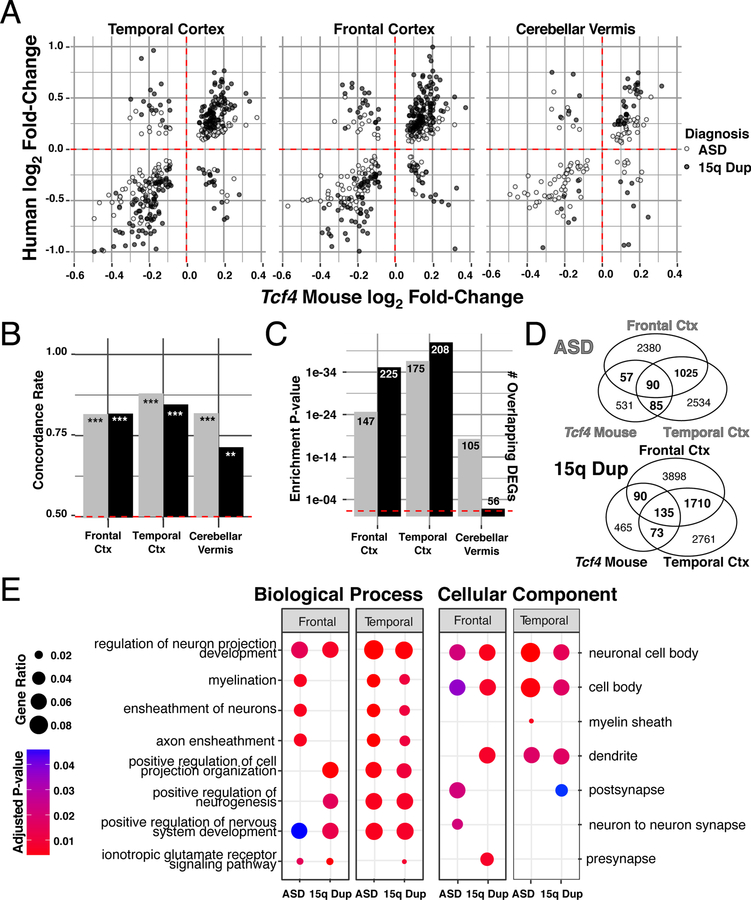
To better characterize phenotypes identified in mouse models with human illness, we directly integrated RNA-seq data fromTcf4+/mut mice with postmortem human brain tissue from ASD and 15q duplication postmortem brain from frontal cortex, temporal cortex, and cerebellar vermis 30 (Extended Data Fig. 9a). Differential expression between PTHS mouse and human ASD or 15q duplication was significantly concordant (Extended Data Fig. 9b). Tcf4+/mut DEGs strongly overlapped with human ASD and 15q duplication at replication, displaying slightly more overlap with the 15q duplication diagnosis (Extended Data Fig. 9c). Comparing replication of DEGs with a more stringent cutoff (p<0.01), gene regulation became more correlated with higher concordance rates, suggesting these groups of genes better represent the shared pathways affected in both PTHS and human ASD. GO analysis of DEGs in frontal and temporal cortex overlapping with PTHS mouse DEGs enriched for processes related to axon and dendrite projection development and postsynaptic regulation and signaling (Extended Data Fig. 9e).
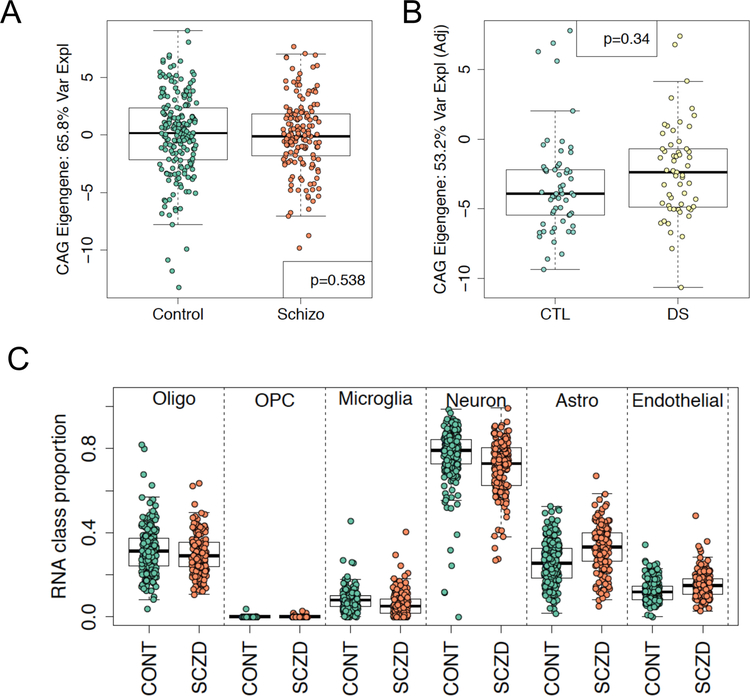
Next, we evaluated the ability of our mouse-derived CAG gene set to distinguish patients with ASD and 15q duplication from unaffected individuals. We found significant differences in patients with ASD from controls among the 34 human homologs of the CAGs via its eigengene using linear mixed effects modeling that incorporated observed and latent confounders (Fig. 8a, linear mixed effects regression p-value =8.35e-4). This association was relatively robust, as sensitivity analyses only adjusting for brain region (linear mixed effects regression, two-sided p=0.044) and then the larger set of observed confounders (linear mixed effects regression, two-sided p=0.021) remained significant. The gene rotations that created this CAG eigengene were directionally consistent between the human and mouse samples, as OL marker genes (e.g. MBP and CNP) had positive loadings for an eigengene that was decreased in ASD samples. We subsequently replicated this CAG eigengene discrimination of 13 ASD patients from 39 unaffected controls in the frontal cortex from independent data 31 (Fig. 8b). This discrimination of patients from controls appeared unique to ASD, as similar analyses in patients with schizophrenia and neurotypical controls 32 showed no differences in the expression of these CAG genes (Extended Data Fig. 10a). Similarly, while myelination has previously been implicated in Down syndrome (DS) 23, the CAG eigengene in microarray data did not show separation between a small number of patients with DS and unaffected controls across a large number of brain regions and ages (Extended Data Fig. 10b), suggesting the dysregulation of these specific 34 genes may be unique to ASD.
Figure 8: Human-mouse convergence of gene expression in idiopathic and syndromic ASD.
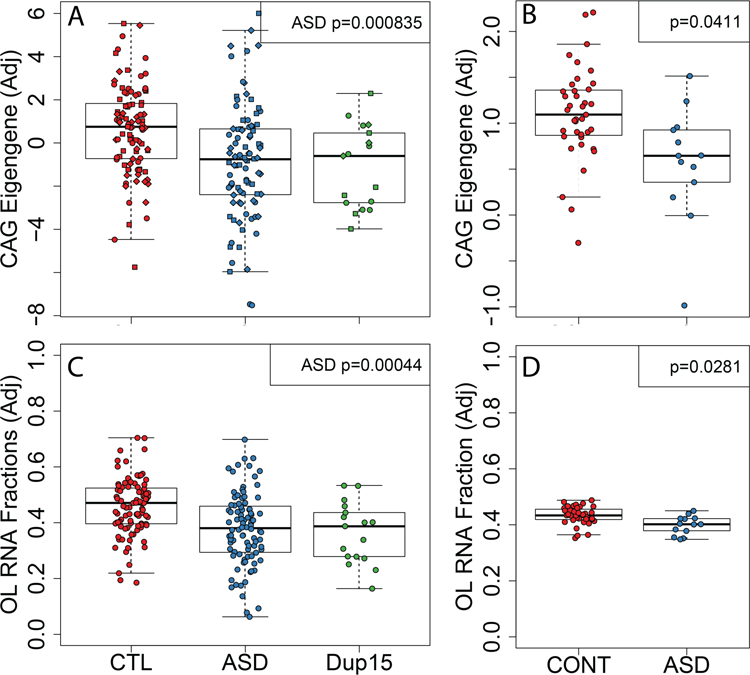
(A) The eigengene of the CAGs found across the three models of syndromic ASD in Parikshak et al is significantly associated with ASD but not 15q duplication diagnoses (via linear mixed effects modeling). (B). The CAG eigengene is also different between patients with ASD from controls in Wright et al. as replication (linear regression for ASD p=0.0411). Estimated cellular composition differences between patients with ASD and controls using reference-based deconvolution show decreased OL RNA fractions in (C) Parikshak et al (linear mixed effects regression for ASD p=0.0004) and (D) Wright et al (linear regression for ASD p=0.0281). The y-axis in each panel are residualized values when accounting for observed and latent confounders for improved visual interpretation (see Methods).
We lastly sought to confirm differences in the relative proportion of OLs in human ASD. We tested for differences in cellular composition between patients with ASD and 15q duplication estimated using cell type-specific single cell RNA-seq data from adult samples as reference profiles. We found significant decreases in the fraction of RNAs from OLs across samples from all three brain regions in ASD (Fig. 8c), which was robust to the linear mixed effects regression model employed (region-adjusted: p=0.011, observed covariate-adjusted: p=0.005). We again replicated these RNA fraction shifts using data from Wright et al 31, with decreased expression signal from OLs (Fig. 8d). We further found suggestive evidence for increased OPC fractions in both the Parikshak (region-adjusted: p=0.041, observed covariate-adjusted: p=0.086, observed and latent-adjusted: p=0.056) and Wright datasets (observed and latent-adjusted: p=0.045) even though this cell population is rarer and thus more difficult to deconvolute from bulk tissue. This deconvolution approach further showed suggestive evidence for the previously-reported increase in astrocyte (region-adjusted: p=0.007, observed covariate-adjusted: p=0.0013, observed and latent-adjusted: p=0.019) fractions in ASD 33, and suggestive evidence for increased microglia when not adjusting for latent variables (region-adjusted: p=0.098, observed covariate-adjusted: p=0.055, observed and latent-adjusted: p=0.42) 34. As these RNA deconvolution calculate the RNA fraction and not necessarily the fraction of each cell type, we used a third dataset consisting of single nuclei RNA-seq (snRNA-seq) from 15 patients with ASD and 16 neurotypical controls 35, and identified a significant decrease in the fraction of nuclei that were OLs (Supplementary Table 7) and increase in the fraction that were protoplasmic astrocytes, in line with our RNA deconvolutions from bulk data above.
These analyses together provide further evidence that implicate inefficient maturation from OPCs to OLs and/or altered survival of OLs in the etiology of ASD. Together, these data strongly support the hypothesis that defects in myelination are a prevalent pathophysiology in syndromic and idiopathic ASD.
Discussion:
Starting with RNA-seq generated from five independent mouse models of PTHS as well as two additional mouse models of PTEN-related disorders and Rett’s syndrome, we identified a consistent transcriptional signature indicating syndromic ASD is associated with altered gene expression related to OL maturation and myelination. CSEA demonstrated DEGs are significantly enriched in OPCs and OLs, and these signatures were biologically validated in our PTHS mouse model. Lastly, we demonstrated that DEGs in our PTHS mouse models represents ~20% of the genes in the SFARI Human Gene Module for ASD, and that these myelin-associated DEGs can be used to distinguish human idiopathic ASD cases from neurotypic controls. Together, these results provide strong support that oligodendrocyte defects are prevalent in both syndromic and idiopathic ASD.
Myelination defects in monogenic ASD mouse models
Myelin pathologies are previously reported in several animal models of syndromic ASD 21,22,36–41. We combined the transcriptomes of three models of syndromic ASD that harbor mutations in Tcf4, Pten, or Mecp2, and showed a significant convergence of differential gene expression. We identified 34 DEGs (termed CAGs) that are common to all three models which were significantly enriched in biological functions associated with myelination (Fig. 3). Interestingly, these CAGs showed anti-correlated gene expression between the Tcf4 model and Pten and Mecp2 models. This expression directionality predicts that both hypo- and hyper-myelination respectively, which we hypothesize may partially relate to the heterogeneity of causal mutations and symptoms between individuals with ASD. Here, in two independent postmortem human datasets, we showed decreased RNA fractions attributed to OLs. The dichotomy between myelination defects in mice with Tcf4 compared to Pten and Mecp2 mutations was biologically validated. We observed hypomyelination in our PTHS mouse model (Figure 4,5), while hypermyelination was previously reported in a Pten mouse model 21 and Mecp2 knockdown was shown to upregulate myelin-associated genes 22.
We showTcf4 mutation alters the population of OLs by increasing the proportion of OPCs while reducing the population of mature OLs (Fig. 4, 6). This reduction in mature OLs was confirmed by TEM imaging of the CC, where the percentage of myelinated axons was significantly reduced in PTHS mice. These structural phenotypes led to functional consequences, as a greater proportion of CAPs propagated down unmyelinated axons within the CC of PTHS mice (Fig. 5). Furthermore, reduced myelination in the PTHS mouse model is due directly to Tcf4 mutation within the OL lineage, as TCF4-dependent reduction in OL numbers was observed in pure OL-lineage cultures (Fig. 6) and after OL-lineage specific deletion of Tcf4 (Fig. 7). However, further experiments are required to fully understand how TCF4 mechanistically regulates the OL lineage.
Numerous other ASD mouse models have reported myelination defects. Tsc2 mutant mice that model Turberous Sclerosis display hypomyelination 36. FMRP mutant mice, which model Fragile X, and Cntnap2 mutant mice, which model Pitt Hopkins-Like Syndrome 1, show delayed myelination 37,38. Chd8 mutant mice showed sexually dimorphic response, such that myelin genes were upregulated in male mice and downregulated in female mice 39, and CHD8 is shown to directly regulate OL development42. Together, these studies indicate that both hyper- and hypo-myelination defects are prevalent in monogenic forms of ASD.
Myelination defects in idiopathic ASD
In humans, the process of CNS myelination begins early in the first year of life and continues throughout development which immediately precedes the first appearances of ASD clinical abnormalities and temporally coincides with the progression of the disorder 43. Numerous neuroimaging studies report differences in WM in ASD patients, with a reduction of CC volume being the most consistent finding 14,15. However, due to resolution constraints, movement artifacts, and/or variability in methods employed, the exact source WM abnormalities cannot be directly discerned 16,43.
In agreement with human imaging studies, an EM and immunohistochemistry study of prefrontal axons from postmortem brains of idiopathic autism patients showed that the ASD brain has a larger proportion of thin axons and decreased myelin thickness in certain brain regions 16. Moreover, single-cell sequencing of postmortem brains from 15 ASD and 16 neurotypical controls showed that ASD cases had more protoplasmic astrocytes compared to controls 35. From our analysis of this dataset, we also observed a significant decrease in OLs present in these ASD samples compared to controls (Supplementary Table 7) 35. Using a similar deconvolution strategy we employed in Fig. 2 and 8, Wang et al., (2019) showed ASD was associated with a significant decrease in OLs 44. Together, these results indicate white matter tract defects are a consistent pathological finding in ASD and are in part due to myelin defects.
Hypo- and hypermyelination in ASD
To gain insight into more genetically complex forms of ASD in humans, we compared transcriptional profiles from mouse models of monogenic forms of ASD to RNA-seq from the cortex and cerebellum of human postmortem ASD patients and controls. Using an RNA deconvolution strategy, we show hypomyelination is present in two independent sets of human ASD cases (Fig. 8). However, given that hypo- and hyper-myelination is observed and predicted in various monogenic mouse models 21,22,36,37,39 and by our RNA-seq analysis, we predict some human cases of ASD would present with hyper-myelination, and several lines of evidence support this prediction. First, EEG studies measuring event-related potentials in ASD patients have observed heterogeneity in response latency due to auditory stimulation 45, and this result could be due to varying levels of myelination across ASD cases. In addition, there may be region specific myelination defects in ASD, with single individuals showing both hypo- and hyper-myelination within a single individual depending on the brain region examined 46,47. Evidence of region specificity of myelination defects is supported by neuroimaging studies, which show highly specific WM tract deficiencies 46,47. Furthermore, macrocephaly is a common endophenotype observed in many individuals diagnosed with ASD, and specifically in individuals with PTEN mutations 48 and some atypical forms of Rett syndrome caused by MECP2 mutation 49. Therefore, we speculate that macrocephaly and hypermyelination may coincide in a proportion of ASD individuals.
Primary or secondary pathophysiology
Our results indicate that mutations in Tcf4 lead to a cell autonomous effect on the OL lineage. We show in pure OPC cultures, that TCF4 protein is expressed and when mutated it leads to an increase in the proportion of OPCs and a decrease in the proportion of OLs (Fig. 6, Extended Data Fig. 6). In addition, we replicated this phenotype by genetically deleting a single Tcf4 allele within the OL-lineage using Cre recombination driven by the Olig2 promoter (Fig. 7). We show cell autonomous defects in myelination are a primary pathophysiology in PTHS, and we identify transcriptional signatures that suggest myelination defects are a common pathophysiology in ASD. However, we do not claim myelination defects are strictly cell autonomous across ASD. Similar to neurons, OLs are responsive to their environment, and it is known that neuronal activity and experience regulates myelination 50. Instead, we suggest ASD mutations affecting neuronal function may lead to non-cell autonomous defects in myelination that varies between individual cases. The proximity and communication between OLs and neurons predicts that dysfunction in one cell type will have negative consequences on the other cell type.
We have provided a concise framework to more fully characterize the biological consequences of individual cell populations within bulk tissue RNA-seq expression data and subsequently validate this framework with robust, convergent experimental evidence. In several syndromic mouse models of ASD and human postmortem ASD brain samples, we identify a transcriptional signature implicating OL biology and myelination as being a common pathophysiology across the ASD spectrum. These findings offer an alternative to the neurocentric view of developmental disorders and suggests myelination may be a novel therapeutic target for the treatment of ASD.
Methods:
Animals and tissue collection
The Tcf4+/tr mouse model of PTHS are heterozygous for a deletion of the DNA-binding domain of the Transcription Factor 4(B6;129-TCF4tm1Zhu/J; stock number 013598, Jackson Laboratory, Bar Harbor, ME) 51. This mouse colony was backcrossed at least 6 generations, maintained by SoBran on a 12-hour light cycle, and fed ad libitum. Tcf4+/tr mouse samples were matched with WT littermates, and sex was randomly selected in each genotype and age group. The Tcf4R579W and Tcf4△574−579 were generated using Crispr/Cas9 technology by the Animals Models Core facility at UNC 11. Heterozygous founders from each mutation were checked for off-target effects of the guide RNA, to which no changes were found. The Tcf4+/floxed mice were generated previously 52, and the Actin-Cre (JAX stock # 019099), Nestin-Cre (JAX stock #003771), and Olig2-Cre (JAX stock #025567) 53 mice were purchased from Jackson Laboratories. The Tcf4+/R579W, Tcf4+/△574−579, Actin-Cre::Tcf4+/floxed, Nestin-Cre::Tcf4+/floxed, and Olig2-Cre::Tcf4+/floxed mice 11 were maintained on a congenic C57/BL6 background, and maintained on a 12:12 light dark cycle with ad libitum access to food and water. Age-matched, sex-matched WT littermates were used as controls for all samples. All the procedures were in accordance with the NIH Guide for the Care and Use of Laboratory Animals and approved by the institutional animal care and use committee.
qRT-PCR
To measure Tcf4 transcript expression across Tcf4+/tr mouse lifespan in mouse, three cortical samples were collected each from both genotypes over 11 developmental ages from embryonic day 12 (E12) to postnatal day 42 (P42, adult). Embryonic samples required microdissection for medial frontal cortical tissue. All samples were separately flash frozen and homogenized in Trizol (Life Technologies). Aqueous phase was mixed with a 1:1 volume of 70% ethanol prior to purification using RNeasy mini columns treated with DNAse according to manufacturer’s protocol (Qiagen). RNA samples were then reverse-transcribed to cDNA using the Quantscript Reverse Transcriptase kit (Qiagen). Amplification of cDNA was performed with iTaq SYBR Green Supermix (Bio-Rad) and Tcf4 primers were designed using with Primer 3 software (http://bioinfo.ut.ee/primer3-0.4.0/). Primers were designed to span exons 19 and 20 to measure the full-length transcript. End-point PCR followed by product sequencing, in addition to cDNA dilution series and melt curve analysis, were used to verify primer design efficiency and specificity. Real time PCR was performed on the 7900HT Fast Real-Time PCR system (Applied Biosystems). Data was expressed as fold-change of gene of interest normalized to Gapdh expression using 2^-delta delta Ct. Lifespan expression fold-change was analyzed between the two genotypes with a two-way ANOVA with Sidak’s multiple comparison test for post hoc analysis in the GraphPad’s Prism software. mTcf4 forward primer CCC AGA CCA AGC TCC TGA TT, reverse primer CAT GTG ATT CGC TGC GTC TC; mGapdh forward primer GCC GTA TTC ATT GTC ATA CCA GG, reverse primer CGA CTT CAA CAG CAA CTC CC.
Western Blot
TCF4 protein levels were measured across development in E12, P1, and adult ages (N=3 per condition). Mice cortices were extracted and flash frozen on dry ice. Dissected tissue was homogenized with T10 basic ultra-turrax (IKA) in a 1:15 ratio of tissue (mg): RIPA buffer plus protease inhibitor cocktail (Amresco). Samples were sonicated for 20 cycles using Sonifier 250 (Branson Ultrasonics) set at an output control of 1.5, and duty cycle of 60.05. Lysates were mixed with 20% SDS (Amresco) for a final concentration of 2% and resonicated. Lysates were then incubated on a rotator for 1hr in 4°C and centrifuged at 20,000g for 5 minutes at 4°C. Supernatants were quantified using BCA kit (Pierce). Samples were blinded and randomly ordered on Western blots to control for batch bias. Total protein amounts of 20µg were used from each sample and separated using a 4–12% gradient Novex Bis-Tris Bolt SDS-PAGE gel via gel electrophoresis and transferred to 0.45 µm nitrocellulose membranes. Membranes were incubated at room temperature for 1hr in Odyssey PBS blocking buffer (Li-Cor), probed with anti-ITF-2 (N-16) (1:500, Santa Cruz) and anti-GAPDH (1:1000, Abcam) primary antibodies in Odyssey PBS blocking buffer overnight at 4⁰C, and detected using IRdye donkey anti-goat 680 (1:10,000, Li-Cor) and IRdye donkey anti-rabbit 800 (1:10,000, Li-Cor). Antibody detection and quantification was carried out using the LI-COR Odyssey infrared system and software. The Tcf4+/tr mouse produces two bands, one for the full-length (~75kDa) and one for the truncated protein (~70kDa) variants. We compared protein levels of the full-length protein over time and between genotypes using two-way ANOVA with Sidak’s multiple comparison test for post hoc analysis in the GraphPad’s Prism software.
CNP, MOG, and NG2 protein levels were similarly extracted and measured from whole brain lysates of Tcf4+/tr and WT adult mice (N=6 per genotype). Starting amounts of protein lysates (30µg, 20 µg, and 60ug) were respectively probed with 1:1000 dilutions of each primary antibody (mouse anti-CNP, Millipore; mouse anti-MOG, Abcam, and rabbit anti-NG2, Millipore) and GAPDH and detected with 1:10,000 dilutions of Li-Cor IRdye (donkey anti-mouse 680, donkey anti-rabbit 800). Levels of CNP, MOG, and NG2 were normalized to GAPDH. We compared relative protein levels between genotypes using the two-sided unpaired t-tests.
Primary neuronal cultures
Primary cultures were obtained following the Worthington Papain Dissociation System (Catalog # LK003150). In brief, P0 mice brains were removed and whole cortex were individually microdissected from litters of Tcf4+/tr/Tcf4+/tr mice. Following dissection, individual cortices were enzymatically dissociated and isolated into a single cell suspension. Following papain inhibition, cells were plated at 2.5X10⁴ per 24 well of poly-l-ornithine and laminin coated plates. At DIV1, medium was fully exchanged with oligodendrogenesis promotion medium (NBM/B27, 1XGlutamax and Pen/Strep with 10 µg/mL PDGFa, and 10µg/mL bFGF). At DIV3 half of the medium was exchanged with oligodendrogenesis promotion medium. Starting at DIV5 growth factors were removed from medium and cells were treated with Ara-C (0.5µM for 48 hrs). After Ara-C treatment, cells were cultured with ½ NBM/B27 medium exchange until DIV14 when cells were 4% PFA fixed for ICC experiments. Coverslips were stained for CNPase, MBP, TUJ1 and DAPI. Imaging was performed blind to genotype, three 4X4 tiles using the 10X objective were imaged per mouse/coverslip for each of the antigen labels and the number of cells positive for OL markers were normalized to total DAPI counts per field.
Primary OPC and oligodendrocyte cultures
Primary OPC and OLs were obtained following a previous protocol 25. In brief, following dissociation or p0 pups, cells were cultured as spheres for 10 days in growth factors with ½ media exchange every other day. On the 11th day, media was replaced with conditioned media and ¼ media exchange every day until plating (Day 15). Cells were then cultured as OPCs in OPC media for 3 days until adding mature OL media for 3 days in order to push the OPCs to a mature fate. Cells were then fixed in 4% PFA for 15 minutes before ICC.
Transmission Electron Microscopy (TEM)
After perfusion with 2% paraformaldehyde (freshly prepared from EM grade aqueous solution), 2% glutaraldehyde, 3mM MgCl2, in 0.1 M sodium cacodylate buffer, pH 7.2 p21 mouse brains were kept overnight in fixative. The next day brains were dissected in fixative, and rinsed with sodium cacodylate buffer. Samples were then post fixed in reduced 2% osmium tetroxide, 1.6% potassium ferrocyanide in buffer (2 hr) on ice in the dark. Following a dH2O rinse, samples were stained with 2% aqueous uranyl acetate (0.22 µm filtered, 1 hr, dark), dehydrated in a graded series of ethanol, propylene oxide and embedded in Eponate 12 (Ted Pella) resin. Samples were polymerized at 60°C overnight. Thin sections, 60 to 90 nm, were cut with a diamond knife on the Reichert-Jung Ultracut E ultramicrotome and picked up with copper slot (1 x 2 mm) grids. Grids were stained with 2% uranyl acetate and observed with a Phillips CM120 TEM at 80kV. Images were captured with an AMT XR80 CCD camera. Preparation of samples, TEM imaging, and quantification was performed blind to genotypes.
Dissection of ROI for TEM
Cerebellum was removed and brains were divided into left and right hemisphere with a sagittal cut. Each hemisphere was cut again sagittal approximately 2mm from the midline, creating 2mm thick slices. The slices were laid flat and trimmed to a 3mm2 regions containing a length of cortex, CC and hippocampus. The tissue was embedded with the medial side at the front of the block. 300nm sections were stained with toluidine blue to confirm the location of the CC and ensure consistent regions of the CC were imaged across all brains. Blocks were trimmed to a 2x1mm region and thin sections were cut for TEM. Axon area, myelin area, and g-ratio were calculated using ImageJ plug-in 54. Quantification of the proportion of myelinated axons in the CC was previously described 36. We tested for differences in the proportion of myelinated axons by genotype using generalized linear mixed effects models across all 18,608 axons with quantified data across 79 images within 9 mice (5 WT and 4 Tcf4+/tr). Specifically, we modeled whether the log odds of each axon being myelinated differed by genotype (fixed effect), treating images and mice as two nested random intercepts using the logistic/binary link function. This more conservative analysis partitioned variability in axon myelination probability within axons in the same image, and images from the same mouse, essentially comparing data from 9 total animals. More liberal analyses modeling axons within the same image as independent measurements (but not images within the same mouse) showed an identical odds ratio (OR=0.65) with a more significant p-value (p=0.0008). All TEM imaging and counts were performed blind to genotypes.
Immunohistochemistry and Immunocytochemistry
Following fixation cells were rinsed with 0.04% Tween 20 3x while tissue (p24 mouse) was rinsed with 0.4% Triton 3x. Cells were blocked in respective serum (10%) for 2 hours at room temperature on an orbital shaker. Following block, primary antibody was added in 2% serum in 0.04% Tween 20 for cells and 0.4% Triton for tissue, and incubated overnight at 4°C. Following overnight incubation cells were rinsed 3x with 0.04% Tween 20 or 0.4% Triton respectively before adding the secondary antibody to incubate at room temperature for 2 hours. After incubation, cells were rinsed 3x in respective buffer and DAPI (Invitrogen™ D1306) was added in order to visualize nuclei. Visualization was carried out on a ZEISS LSM 700 Confocal. Imaging and quantification was performed blind to genotypes.
Electrophysiology
Acute coronal brain slices containing the CC were obtained from P29–32 mice as previously described 55. Artificial cerebrospinal fluid (ACSF) was oxygenated (95% O2 and 5% CO2) and contained (in mM): 125 NaCl, 25 NaHCO3, 1.25 NaH2PO4, 3 KCl, 25 dextrose, 1 MgCl2, and 2 CaCl2, pH 7.3. A bipolar stimulating electrode was placed 500µm away from the midline and CC was stimulated with a 100µs square pulse using 80% of the maximal stimulation intensity. The recording electrodes were fabricated from borosilicate glass (N51A, King Precision Glass, Inc.) to a resistance of 2–5 MΩ and placed at varying distances from the stimulating electrode in the contralateral CC. For cAP recording pipettes were filled with ACSF. Voltage signals were recorded with an Axopatch 200B amplifier (Molecular Devices) and were filtered at 2 kHz using a built in Bessel filter and digitized at 10 kHz. Data were acquired using Axograph on a Dell PC. For electrophysiology experiments, data collection and analysis were not performed blind to the conditions of the experiment.
Library preparation and RNA sequencing
RNA was extracted from the brains of Tcf4+/tr and WT littermates at two developmental time points, P1 and >P42 with 6 animals per group (total N=24). Animals were collected at the indicated time point, euthanized, and brains removed from the skull. The medial prefrontal cortex (mPFC) was rapidly dissected on an ice block, and the tissue samples were immediately subjected to RNA purification. Sequencing libraries were prepared from RNA from each mouse cortex using the Illumina TruSeq Stranded RNA HT sample preparation kit with Ribo-Zero Gold. Libraries were barcoded and then sequenced using an Illumina HiSeq 3000 at 100bp paired-end reads for targeted coverage of 50 million sequencing fragments (100 million reads) per sample in the LIBD Sequencing Core Facility. There was a median of 129M(Million) mapped reads per sample (interquartile range, IQR: 109M-140M), of which a median 52% (IQR: 49%−54%) were assigned to genes (based on exonic sequence overlap).
Brains collected from Tcf4+/R579W, Tcf4+/△574−579, Nestin-Cre::Tcf4+/Flox, Actin-Cre::Tcf4+/Flox, and littermate controls were dissected at either P0-P2 or P60-P80. Brains were rapidly dissected, flash frozen in a dry ice and ethanol bath, and stored at −80°C. RNA was extracted from one (P60-P80 mice) or both (P0-P2) cerebral hemispheres using the RNeasy Plus kit (Qiagen) per manufacturer’s instructions with the following modifications. The frozen tissue was thawed on ice and then hand homogenized in 500µl of Buffer RLT+ on ice. The crude RNA lysates were diluted with additional Buffer RLT+ to a final volume of 2mL. For purification of RNA, 400µl of P60-P80 lysate or 200µl of P0-P2 lysate were used from the total RNA lysates (2mL). The crude RNA lysate was twice passed through the genomic DNA eliminator column, and the purification proceeded according to the manufacturer’s instructions (Qiagen). A 40µl aliquot of purified RNA was used for additional purification using the RNA Clean and Concentrator kit (Zymo). Briefly, the purified RNA was incubated with RNase-free DNase I (Zymo) for 15 minutes at room temperature. The digested RNA was then washed and cleaned on column per the manufacturer’s instructions. All tested samples had 260/280 and 260/230 ratios ≥ 2.0 measured using a NanoDrop (Thermo Scientific). All RNA samples were verified to have an RNA integrity number (RIN) INNA integrity number on the TapeStation 2000 (Agilent Technologies). Unstranded library construction, quality control, and RNA-sequencing were performed by Beijing Genomic Institute (BGI, Beijing, China) using the Illumina HiSeq4000 at single-end 50bp reads. These samples had a median of 29M reads mapped per sample (IQR: 26M-31M), of which a median 81% (IQR: 79%−83%) were assigned to genes (based on exonic sequence overlap).
Read mapping and quantification of gene expression
HISAT2 genome indices for mm10/GRCm38.p4 were created according to developer’s instructions. Reads were aligned to the mm10 mouse genome using the splice-read mapper HISAT2 (version 2.0.4) 56 using the reference transcriptome to initially guide alignment, based on known transcripts of the GENCODE build [`hisat2 -p 8 -x $GRCm38index −1 $FP −2 $RP -S $SAM --rna-strandness RF --phred33 2> $SUM`]. Single-end reads were aligned with the argument [`-U $UP`]. Unstranded reads did not include the [`--rna-strandness`] argument. Gene expression levels were calculated with the featureCounts tool (version 1.5.0) 57 based on the GENCODE version M11 annotations of the mm10 genome. Tcf4+/tr expression was summarized with featureCounts arguments for reversely-stranded read pairs [`featureCounts -s 2 -p -T 8 -a $GTF -o $OUT $BAM`]. Other Tcf4+/mut samples were prepared with unstranded library kits, so expression was summarized with [`-s 0`] argument instead. ($FP: forward pair; $RP: reverse pair; $SAM: output alignment file, RF: HISAT argument for reversely stranded library prep; $UP: unpaired reads)
Differential expression across TCF4 mutations and brain regions
Differential expression in P1 and adult mice brain from Tcf4 mutation was determined by pooling samples from medial PFC, whole brain, and hippocampal CA1 from 5 forms of Tcf4+/mut (NP1=28, NAdult=69). The R package DESeq2 58 used raw gene counts to determine DEGs by genotype with the linear model `geneCounts ~ Genotype + Line + geneAssignmentRate+ SVs`. Lowly expressed genes were dropped from differential expression (average normalized counts across all samples less than 1). Expression was adjusted for mouse line and gene assignment rates to account for differences between mouse lines, animal care, tissue source, library preparation, and sequencing procedures. Surrogate variables (SV) determined by the R package sva 59 were included to remove batch effects and noise in gene expression data from unknown or un-modeled sources of variation. One low quality sample determined by a low rate of reads mapped to the genome and low gene assignment, an adult Tcf4+/tr sample, was identified in hierarchical clustering and was dropped from analysis. The p-values were adjusted for multiple testing through DESeq2 with a target alpha = 0.05, and mouse genes were considered DEGs at FDR<0.05.
Comparison between differential expression analyses
Sub-analyses to determine DEGs within each mouse line and age group were similarly determined with DESeq2 with the linear model: geneCounts ~ Genotype + SVs at alpha = 0.05. Samples within these groups are considered balanced and matched. A DEG from one dataset is considered “replicated” if it is differentially expressed at p<0.05 in more than one dataset (Fig. 4, 5, and S1).
Functional gene set analysis on the DEGs
We found enriched gene pathways in GO databases with the R-package clusterProfiler 60. The clusterProfiler analysis tested the DEGs at p<0.01 from the pooled analysis in P1 and adult samples for overrepresented gene sets using hypergeometric tests. DEGs are separated by positive and negative log-2 fold-change. We defined the background as the list of expressed genes with mean normalized counts > 1 and adjusted for multiple testing with q-value<0.05.
Cell type-specific expression and relative proportion analysis
We first used the CSEA approach 61 to determine cell type specificity of these TCF4 mutations, which are based on over-representation of cell type-specific genes, determined by TRAP. The DEGs at P1 and Adult age groups at unadjusted P < 0.01 were used for CSEA. Analyses and plots were generated with the online CSEA tool (http://genetics.wustl.edu/jdlab/csea-tool-2/). Each cell type is represented by a 4-level bullseye plot scaled by the number of transcripts unique to that cell type at multiple specificity index thresholds (pSI<0.05, 0.01, 0.001, 0.0001). Enrichment BH-adjusted p-values are plotted in each level of specificity (i.e. the most enriched cell types will have the lowest p-values in all rings). Independent validation of CSEA analysis took RNA-seq raw gene counts from purified cell types of mouse brain from Zhang et al. 62 and the CIBERSORT online tool 63 to create the set of signature genes using default parameters. The signature genes for enrichment was further limited to those upregulated in these cell types from DESeq2 analysis (Fig. 3A). Raw gene counts from PTHS mice were passed to CIBERSORT to predict relative proportions of each cell type. Shifts in proportions was determined by fitting the linear regression to model the genotype effect on cell type proportions co-varying for mouse line `Proportions ~ Genotype +Line`.
Comparing transcriptomes of multiple syndromic ASD mouse models
We compared DEGs from Tcf4+/mut mice with two mouse models of ASD, Mecp2tm1.1Bird) 20 and homozygous Pten mutation (Ptenm3m4/m3/m4) 19. We processed the Mecp2tm1.1Bird and Ptenm3m4/m3/m4 RNA-seq datasets as described below and compared genes differentially expressed in our pooled TCF4 analysis to those also differentially expressed in MeCP2 and Pten homozygous mutations (FDR<0.05). We tested enrichment of differential expression, log2 fold-change correlation, and log2 fold-change directionality concordance with Fisher’s Exact test and Spearman correlation test. We also report r, the Spearman’s correlation coefficient, and 1-k, the rate of genes with opposite log2 fold-change directionality. GO analysis for Fig. 3D was performed on the set of genes differentially expressed in all three mouse models.
Comparing to human ASD risk genes, expression networks, and differential expression
To directly compare our PTHS mice models with sporadic human ASD, we compared our DEGs to the Simons Foundation Autism Research Initiative (SFARI) ASD Human Gene Module and Animal Model Module64,65 and we searched for overlap using weighted gene co-expression network analyses (WGCNAs) from human ASD and neocortical development, as well as gene expression of a recent large RNA-seq study on human ASD postmortem brain 30. We downloaded the list of ASD risk genes scored by (release 8/8/2019) by the evidence of their risk associations to idiopathic or syndromic ASD. We included 992 of the 1089 risk genes that had a homologous mouse gene expressed in our RNA-seq dataset and used the Fisher’s Exact test to test for over-representation of our DEGs in the list of human ASD risk genes. We further subset SFARI human module genes with scientific evidence scores of 1, 2, 3, or syndromic to assess a stricter overlap of our mouse DEG and human genes with stronger evidence to contribute to ASD. We replicated these enrichment by comparing to genes identified to be significantly associated with ASD by large de novo variant analyses 26,27. We downloaded Table S6 in Sanders et al., 2015 and Table S4 in Satterstrom et al. bioRxiv 2019 (accessed 8/14/2019) and 61/65 and 97/102 genes were included in replication enrichment analyses, respectively. We tested enrichment with weighted gene co-expression network analysis (WGCNA) of human brain development 29, microarray of human ASD 28, and RNA-seq of human ASD 30. For WGCNA data from the Voineagu et al. study, we assigned genes to the module that they have strongest membership (kME > 0.7). Here, we limited the analysis to only expressed genes in the mouse data that have human homologs present in each WGCNA study. As described in these papers, we tested enrichment in each co-expression module with two-tailed Fisher’s Exact test, included only positive enrichment (odds ratio > 1), and adjusted for multiple testing with the false discovery rate (FDR<0.05). We also provide a companion GO analysis of these enriched modules to interpret the molecular pathways involved in each co-expression networks. We used all genes in each module with the background as the list of genes reported in each study.
Comparing mouse models of PTHS with human ASD RNA-seq
Lastly, we compared adult PTHS DEGs with differential expression of human ASD vs. control in three brain regions (DLPFC, auditory cortex, and cerebellar vermis). We used biomaRt 66 to map mice genes to their human homolog genes and determined fold-change concordance with chi square test of independence in significant DEGs in both datasets (FDR<0.01 in mice, p<0.05 in human). We tested the log2 fold-change correlation with Fisher’s Exact tests. We report k, the rate of genes with concordant log2 fold-change directionalities between PTHS mouse and human ASD or 15q duplication in each brain region with their respective permutation p-values of 1000 iterations. We subsequently performed GO analysis on genes in both mouse and human for each brain region (as above) with the background as the set of expressed genes with mouse homologs.
We calculated CAG eigengenes within the Parikshak et al and Wright et al datasets to test for association with ASD. We performed principal component analysis (PCA) on the log2(RPKM+1) of the 34 CAG genes homologous between mouse and human. This is analogous to treating the CAG gene set as a WGCNA module and calculating the corresponding eigengene. In the Parikshak et al data, we then associated this eigengene with ASD or 15q duplications diagnoses relative to controls in three different linear mixed effects models, 1) adjusting for brain region, 2) adjusting for brain region, gene assignment rate, sequencing batch, brain bank, RIN, age, sex, which we term the “covariate-adjusted” model, and 3) further adjusting for the top 5 quality surrogate variables (qSVs) 67 All three models treated donor as a random intercept (since some donors contributed multiple brain regions). We display the “adjusted” eigengene in each plot to account for this statistical adjustment, which preserves the effects of diagnosis in the eigengene while regressing out the effects of the observed and latent confounders (as described in Jaffe et al 68 and as implemented in the cleaningY function in the jaffelab R package.
We performed reference-based cellular deconvolution using 146 cell type-specific genes identified from the six adult cell types from Darmanis et al 69 (Table S8) and the Houseman algorithm first used in DNA methylation-based deconvolution 70. We specifically scaled the expression values of these 146 genes within the reference set prior to estimating the weights for each gene, and then within the postmortem ASD data to make values more comparable across datasets prior to deconvolution. Using data from Parikshak et al, we tested for composition differences between diagnostic groups across all samples using linear mixed effects modeling, using the same three models as above, and plotted the effects of cell types on diagnosis using values adjusting for the full observed and latent confounder model (which better visually reflects the multiple regression p-value).
In the data from Wright et al, we tested for ASD effects on RNA composition and the CAG eigengene effects using linear regression, adjusting for RIN, exonic mapping rate, sex, and the first 9 principal components (PCs) of the overall expression data, in line with the original publication 31.
Other RNA-seq data processing:
Kennedy et al. RNA-seq data from hippocampal CA1 of Tcf4+/tr mice 10: We acquired from the authors 16 BAM files from RNA-seq of CA1 pyramidal neurons of unconditioned Tcf4+/tr and WT P60 mice. Reads were extracted from the BAM files to be realigned as single-end unstranded reads with HISAT2. Expression was summarized with featureCounts calls for single-end unstranded reads. Differential expression by genotype adjusting for surrogate variables was determined with DESeq2.
Gabel et al. RNA-seq data of Mecp2tm1.1Bird20 : We downloaded the MeCP2 dataset from accession GSE67294 (N=6, male WT vs. MeCP2 knock-out, visual cortex). Single-end unstranded raw RNA-seq reads were aligned to the genome with arguments for single-end unstranded. FeatureCounts with similar arguments were used to quantify expression of genes [`featureCounts -a $GTF -o $OUT $BAM`]. Differential expression was determined in knockout vs. WT mice adjusting for surrogate variables.
Tilot et al. RNA-seq data of Pten homozygous mutation mice 19: We downloaded the Pten dataset from accession GSE59318 (N= 6, WT vs. homozygous mutants, P42 weeks old). Reversely stranded, paired-end RNA-seq reads were aligned to the genome. featureCounts was used to quantify expression of genes. Differential expression of homozygous mutant mice vs. WT was determined using surrogate variables.
Zhang et al. mouse brain cell type RNA-seq data 62 : We downloaded the Zhang dataset from accession GSE52564 (N=17, 7 purified cell types and 1 bulk tissue). Reversely stranded, paired-end RNA-seq reads were aligned to the genome. FeatureCounts was used to quantify expression of genes.
Parikshak et al. human ASD RNA-seq data 30 : We acquired RNA-seq reads of postmortem human brain from the authors, and aligned to the human genome hg38 and GRCh38 gene annotations with HISAT calls for paired, reversely stranded reads. Reads were summarized with featureCounts with analogous parameters. We further summarized library normalized sum coverage with bwtool to measure expression of degradation prone expressed regions from RNA-seq libraries prepared with RiboZero for the qSVA method explained in Jaffe et al, 67. This degradation region expressed matrix is used in the qSVA analysis method to account for latent degradation effects not completely modeled with RIN. Differential expression in each brain region was then determined with DESeq2 with the statistical model: Expression~ Diagnosis + geneAssignmentRate + SequencingBatch + BrainBank + RIN + Age + Sex+ qSVs`.
Velmeshev et al. 2019 data 35: we downloaded nuclei-level meta-data from http://cells.ucsc.edu/autism/meta.tsv and calculated the proportion of each estimated cell class in each sample. We then performed linear regression analysis for each cell type proportion for ASD diagnosis adjusting for brain region.
Extended Data
Extended Data Fig. 1. Heterozygous truncation of Tcf4 decreases levels of Tcf4 mRNA and protein.
Comparison of lifespan expression patterns of TCF4 in heterozygous (Tcf4+/tr) mice and wild-type (Tcf4+/+) littermates in qRT-PCR and RNA-sequencing analyses. mRNA and protein were extracted from frontal cortex of mice across developmental ages. (A) qRT-PCR analysis of full-length Tcf4 transcripts from mouse frontal cortex. Tcf4+/tr mice show overall reduced expression compared to Tcf4+/+ mice (n=66 mice, ANOVA p=0.02) with the greatest decrease inTcf4 expression around postnatal days 1–4 (P1–4, n=18 mice, Posthoc p<0.05). Center values represent mean and errors bars are S.E.M. (B) RNA-seq analysis also shows TCF4 expression decreased in the Tcf4+/tr mouse in the exon after the truncation (n=35 mice). Tcf4+/tr mice had significant decrease of Tcf4 exons (differentially expressed exon by genotype FDR = 3.35 x 10⁻³⁵). The boxplot shows the quartile breaks of residualized variance stablilized count of a Tcf4 exon after the truncation (see methods on residualization for visual interpretation). (C) Western blot of endogenous mouse TCF4 at three ages (E12, P1, and P42). A single full-length (TCF4 fl; 80kDa) protein is observed in lysates from Tcf4+/+mouse brain and Tcf4+/tr mouse brain expresses a truncated (TCF4 tr) and full-length TCF4 protein. These representative gel images are compiled across several different gel images and stitched together. (D) Full-length TCF4 protein is decreased in the Tcf4+/tr mouse brain (n=3 mice per genotype per timepoint, pAnova =0.0009) with the largest effect occuring at P1 in the TCF4+/tr mice (n= 3 mice per condition, two-sided unpaired t-test, p<0.01). Center values indicate mean and errors bars are the S.E.M., *<0.05, **<0.01, ***< 0.001.
Extended Data Fig. 2. Replicated differential expression across PTHS models.
(A) Table of DEGs (NP1 = 28, NAdult = 69, using the two-sided differential expression cutoff of FDR<0.05) and percent of differential expression replication across different forms of Tcf4 mutation P1 and adult mice. Most DEGs and replication occur in adult mice. The replication rate was defined as the proportion/percentage of DE genes that were p < 0.01 in at least one other mouse model of the same age group divided by those DEGs in the reference mouse model. (B) Differential expression log2 fold-change heatmap comparing replicated DEGs across various models of Tcf4 mutations in P1 (replication defined the same gene having differential expression with two-sided p<0.05).
Extended Data Fig. 3. Cell type-specific expression analysis in PTHS mice.
Bulls-eye plots from CSEA analysis of DEGs in (A) P1 and (B) adult Tcf4+/tr mice. The bulls-eye plot size is scaled to the number of genes specific to a cell type at increasing levels of specificity as published by Xu et al., 201413. The FDR-adjusted hypergeometric test p-value is plot for each level of specificity, with unenriched groups colored gray. Cell type bulls-eye plots are arranged by hierarchical distance of their specific gene expression levels. (A) P1 DEGs (N = 36 DEG at Padj < 0.05) enriched for D1+, D2+, and cholinergic neurons (Padj<0.05). (B) Adult DEGs (N = 1832 DEG at Padj < 0.05) strongly enrich for OLs among other neuronal cell types.
Extended Data Fig. 4. Analysis of TEM images.
(A) Plot of gRatio and corresponding radius for all axons assessed. Axon radius is significantly correlated with gRatio (p=2.86e-34), and this correlation is different by genotype (p=0.03). (B-F) No significant differences were observed between genotypes for gRatio (p=0.796), axon area (p=0.844), myelin area (p=0.852), myelin + axon radius (p=0.615), or axon radius (p=0.873).
Extended Data Fig. 5. Conduction velocity does not differ between TCF4 genotypes.
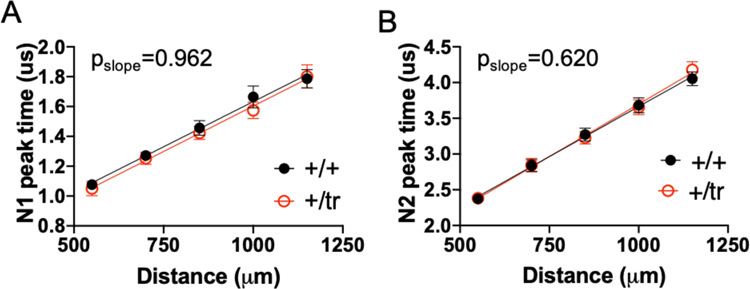
The peak time of N1 and N2 waveform (y-axis) is the amount of time between stimulation artifact and the amplitude peak of the compound action potential. The peak time is plotted against distance (x-axis) which is the distance between the stimulating electrode and recording electrode. The slope of the line generated from both N1(A) and N2 (B) does not differ between genotypes (N1 slope p=0.96, N2 slope p=0.36, N=30 slices from 4 Tcf4+/+ and 5 Tcf4+/tr mice) Center values indicate mean and errors bars are the S.E.M.
Extended Data Fig. 6. Tcf4 is abundantly expressed at all stages of oligodendrocyte development.
(A) Example images of fluorescent in situ hybridization showing Tcf4 transcript co-localizes with both Pdgfrα and Mbp. (B) Summary plots of single-cell RNA-seq data across oligodendrocyte development showing expression levels for Pdgfrα, Tcf4, Olig2, and Mbp. This data was adapted from Marques et al., 2016.
Extended Data Fig. 7. Primary OL cultures are devoid of neurons and astrocytes.
(A) Primary neuronal culture stained with CNP and GFAP as a positive control for antibody staining. (B1) Primary OL culture stained with CNP and GFAP. (B2) Cell counts showing primary OL cultures have very few neurons (Tuj1+) or astrocytes (GFAP+). Numbers indicate number of cells counted for that condition. (C) Primary neuronal cultures stained with OLIG2, NeuN, and GFAP as a positive control for antibody staining. (D) Primary OL culture stained with OLIG2, NeuN, and GFAP. (D1) Cell counts showing primary OL cultures have very few neurons (NeuN+) or astrocytes (GFAP+).
Extended Data Fig. 8. OPCs derived from Tcf4+/tr mice show inefficient maturation into oligodendrocytes.
(A) Representative images of OPCs (PDGFRα) and mature OLs (MBP, CNP) derived from Tcf4+/+ and Tcf4+/tr mice. To control for cell numbers all cell counts are normalized by the pan-OL marker Olig2 that labels both OPC and mature OLs. Tcf4+/tr produce significantly more OPCs (n=23 mice, two-tailed unpaired t-test, p<0.0001) and fewer MBP positive OLs (Tcf4+/+ 0.19±0.02 vs. Tcf4+/tr 0.05±0.01, n=23 mice, two-tailed unpaired t-test, p<0.0001). (B) Representative images of OPCs (PDGFRα) and mature OLs (CNP). Tcf4+/tr produce significantly more OPCs (two-tailed unpaired t-test, n=17 mice, two-tailed unpaired t-test, p<0.0001) and fewer CNP positive OLs (Tcf4+/+ 0.56±0.04 vs. Tcf4+/tr 0.22±0.02, n=17 mice, two-tailed unpaired t-test, p<0.0001). All scale bars equal 100µm. For all bar graphs, center values represent the mean and error bars are S.E.M.,***p<0.001, ****p<0.0001.
Extended Data Fig. 9. Concordant gene regulation between PTHS mice and human ASD.
Comparison of differential expression in adult PTHS mice with human ASD and 15q duplication (15q Dup) in postmortem frontal, temporal, and cerebellum. (NTemp =68, NFrontal = 73, NVermis =63, Human two-sided differential expression p<0.05, mouse DEGs, FDR<0.01). (A) Log2 fold-change comparison of adult PTHS mouse DEGs replicated in human ASD and 15q Dup in each tissue region (p<0.05). Gene regulation in PTHS mice cluster closest with ASD differential expression in cortex. (B) More than 50% of replicated PTHS DEGs had concordant fold-change directionality. Null permutation for empirical p-value significance of human-mouse gene fold-change concordance from 1000 permutations are reported (Two-sided Fisher’s exact test, *, padj<0.05; **, padj<0.01; *** padj<0.001). (C) Replicated DEGs in ASD and 15q Dup are significantly enriched in all tissues, mostly in the cortex (FDR-adjusted Fisher Exact test for overlap of Tcf4 mouse DEG with ASD DEG, padj<0.05). (D) Venn diagram showing overlap of PTHS mouse DEGs with human ASD or 15q Dup in cortical tissues. (E) Gene ontology analysis shows tissue-specific biological processes and cellular components between overlap of PTHS mouse and human ASD or 15q Dup (NASD = 10896 and N15qDup = 13149 DEGs at p < 0.01,s q-adjusted two-sided hypergeometric test). The gene sets are largely brain region specific and concordant between human ASD and 15q Dup. The color of the dot plots shows the q-adjusted hypergeometric test p-value for gene set enrichment of the DEG of each diagnosis group.
Extended Data Fig. 10. Mouse concordant ASD genes (CAGs) are not convergent with Schizophrenia or Down Syndrome.
(A) The eigengene of the CAGs found across the three models of syndromic ASD explains 65.8% of the gene expression variance and is not associated with Schizophrenia diagnosis (linear regression two-sided p-value=0.538). (B) The eigengene of the CAGs found across the three models of syndromic ASD explains 53.2% of the gene expression variance and is not associated with Down Syndrome diagnosis (linear regression two-sided p-value=0.34). (C)Estimated cellular composition differences between patients with schizophrenia and controls using reference-based deconvolution. There were significant increases of astrocytes (p=0.0002) and endothelial cells (p=0.0118) and decreases in microglia (p=0.0076) in patients with schizophrenia compared to controls using linear regression analysis.
Supplementary Material
Acknowledgements:
We are grateful for the vision and generosity of the Lieber and Maltz families, who made this work possible. We thank Daniel R. Weinberger for his helpful comments and feedback. We thank the Johns Hopkins School of Medicine Microscope Core Facility and specifically LaToya Roker for generating TEM images of CC used in this study. This work was supported by the Lieber Institute, the Pitt-Hopkins Research Foundation Award (B.J.M, B.D.P., C.T., D.S., and A.J.K), a NIMH grant R56MH104593 (B.J.M.), a NIMH grant R01MH110487 (B.J.M), a Johns Hopkins PURA grant (B.N.P), a UPenn Orphan Disease Center Million Dollar Bike Ride grant MDBR-15-108-PH (B.D.P. and C.T.), a NARSAD Young investigator grant #20653 from the Brain Behavior Research Foundation (C.T.), an NINDS grant P30NS045892 (J.M.S.), an NICHD grant P30HD03110 (J.M.S), an NIMH grant R01MH104158 (D.S. and A.J.K), an NIGMS training grant T32GM008208 (B.N.P), and a NIMH training grant T32MH015330 (B.A.D). The content is solely the responsibility of the authors and does not necessarily represent the official views of the National Institutes of Health.
Footnotes
Competing Interest Statement
The authors declare that they have no competing financial interests.
Data Availability
The data that support the findings of this study are available from the corresponding author upon request. R code used to analyze data in this study and analyzed data are available at https://github.com/LieberInstitute/PTHS_mouse. RNA-seq data from cortex and whole-brain of TCF4 mutant mice are available via Globus: http://research.libd.org/globus/NatNeuro_TCF4_Data/. Intermediary files or analyses generated with our RNA-seq processing pipeline are available upon request from authors.
References
- 1.Iossifov I et al. The contribution of de novo coding mutations to autism spectrum disorder. Nature 515, 216–221 (2014). [DOI] [PMC free article] [PubMed] [Google Scholar]
- 2.O’Roak BJ et al. Multiplex targeted sequencing identifies recurrently mutated genes in autism spectrum disorders. Science 338, 1619–1622 (2012). [DOI] [PMC free article] [PubMed] [Google Scholar]
- 3.Gaugler T et al. Most genetic risk for autism resides with common variation. Nat. Genet 46, 881–885 (2014). [DOI] [PMC free article] [PubMed] [Google Scholar]
- 4.Silverman JL, Yang M, Lord C & Crawley JN Behavioural phenotyping assays for mouse models of autism. Nat. Rev. Neurosci 11, 490–502 (2010). [DOI] [PMC free article] [PubMed] [Google Scholar]
- 5.Sweatt JD Pitt-Hopkins Syndrome: intellectual disability due to loss of TCF4-regulated gene transcription. Exp Mol Med 45, e21 (2013). [DOI] [PMC free article] [PubMed] [Google Scholar]
- 6.Rannals MD et al. Psychiatric risk gene transcription factor 4 regulates intrinsic excitability of prefrontal neurons via repression of scn10a and KCNQ1. Neuron 90, 43–55 (2016). [DOI] [PMC free article] [PubMed] [Google Scholar]
- 7.D’Rozario M et al. Type I bHLH Proteins Daughterless and Tcf4 Restrict Neurite Branching and Synapse Formation by Repressing Neurexin in Postmitotic Neurons. Cell Rep 15, 386–397 (2016). [DOI] [PMC free article] [PubMed] [Google Scholar]
- 8.Page SC et al. The schizophrenia- and autism-associated gene, transcription factor 4 regulates the columnar distribution of layer 2/3 prefrontal pyramidal neurons in an activity-dependent manner. Mol. Psychiatry 23, 304–315 (2018). [DOI] [PMC free article] [PubMed] [Google Scholar]
- 9.Sepp M et al. The intellectual disability and schizophrenia associated transcription factor TCF4 is regulated by neuronal activity and protein kinase A. J. Neurosci 37, 10516–10527 (2017). [DOI] [PMC free article] [PubMed] [Google Scholar]
- 10.Kennedy AJ et al. Tcf4 regulates synaptic plasticity, DNA methylation, and memory function. Cell Rep 16, 2666–2685 (2016). [DOI] [PMC free article] [PubMed] [Google Scholar]
- 11.Thaxton C et al. Common Pathophysiology in Multiple Mouse Models of Pitt-Hopkins Syndrome. J. Neurosci 38, 918–936 (2018). [DOI] [PMC free article] [PubMed] [Google Scholar]
- 12.Rubenstein JLR & Merzenich MM Model of autism: increased ratio of excitation/inhibition in key neural systems. Genes Brain Behav 2, 255–267 (2003). [DOI] [PMC free article] [PubMed] [Google Scholar]
- 13.Courchesne E & Pierce K Why the frontal cortex in autism might be talking only to itself: local over-connectivity but long-distance disconnection. Curr. Opin. Neurobiol 15, 225–230 (2005). [DOI] [PubMed] [Google Scholar]
- 14.Ismail MMT et al. Studying Autism Spectrum Disorder with Structural and Diffusion Magnetic Resonance Imaging: A Survey. Front. Hum. Neurosci 10, 211 (2016). [DOI] [PMC free article] [PubMed] [Google Scholar]
- 15.Pagnozzi AM, Conti E, Calderoni S, Fripp J & Rose SE A systematic review of structural MRI biomarkers in autism spectrum disorder: A machine learning perspective. Int. J. Dev. Neurosci 71, 68–82 (2018). [DOI] [PubMed] [Google Scholar]
- 16.Zikopoulos B & Barbas H Changes in prefrontal axons may disrupt the network in autism. J. Neurosci 30, 14595–14609 (2010). [DOI] [PMC free article] [PubMed] [Google Scholar]
- 17.Rannals MD et al. Neurodevelopmental models of transcription factor 4 deficiency converge on a common ion channel as a potential therapeutic target for Pitt Hopkins syndrome. Rare Dis 4, e1220468 (2016). [DOI] [PMC free article] [PubMed] [Google Scholar]
- 18.Willsey AJ et al. Coexpression networks implicate human midfetal deep cortical projection neurons in the pathogenesis of autism. Cell 155, 997–1007 (2013). [DOI] [PMC free article] [PubMed] [Google Scholar]
- 19.Tilot AK et al. Neural transcriptome of constitutional Pten dysfunction in mice and its relevance to human idiopathic autism spectrum disorder. Mol. Psychiatry 21, 118–125 (2016). [DOI] [PMC free article] [PubMed] [Google Scholar]
- 20.Gabel HW et al. Disruption of DNA-methylation-dependent long gene repression in Rett syndrome. Nature 522, 89–93 (2015). [DOI] [PMC free article] [PubMed] [Google Scholar]
- 21.Fraser MM, Bayazitov IT, Zakharenko SS & Baker SJ Phosphatase and tensin homolog, deleted on chromosome 10 deficiency in brain causes defects in synaptic structure, transmission and plasticity, and myelination abnormalities. Neuroscience 151, 476–488 (2008). [DOI] [PMC free article] [PubMed] [Google Scholar]
- 22.Sharma K, Singh J, Pillai PP & Frost EE Involvement of MeCP2 in Regulation of Myelin-Related Gene Expression in Cultured Rat Oligodendrocytes. J. Mol. Neurosci 57, 176–184 (2015). [DOI] [PubMed] [Google Scholar]
- 23.Olmos-Serrano JL et al. Down syndrome developmental brain transcriptome reveals defective oligodendrocyte differentiation and myelination. Neuron 89, 1208–1222 (2016). [DOI] [PMC free article] [PubMed] [Google Scholar]
- 24.Marques S et al. Oligodendrocyte heterogeneity in the mouse juvenile and adult central nervous system. Science 352, 1326–1329 (2016). [DOI] [PMC free article] [PubMed] [Google Scholar]
- 25.Chen Y et al. Isolation and culture of rat and mouse oligodendrocyte precursor cells. Nat. Protoc 2, 1044–1051 (2007). [DOI] [PubMed] [Google Scholar]
- 26.Sanders SJ et al. Insights into Autism Spectrum Disorder Genomic Architecture and Biology from 71 Risk Loci. Neuron 87, 1215–1233 (2015). [DOI] [PMC free article] [PubMed] [Google Scholar]
- 27.Satterstrom FK et al. Large-scale exome sequencing study implicates both developmental and functional changes in the neurobiology of autism. BioRxiv 484113 (2018). doi: 10.1101/484113 [DOI] [PMC free article] [PubMed] [Google Scholar]
- 28.Voineagu I et al. Transcriptomic analysis of autistic brain reveals convergent molecular pathology. Nature 474, 380–384 (2011). [DOI] [PMC free article] [PubMed] [Google Scholar]
- 29.Parikshak NN et al. Integrative functional genomic analyses implicate specific molecular pathways and circuits in autism. Cell 155, 1008–1021 (2013). [DOI] [PMC free article] [PubMed] [Google Scholar]
- 30.Parikshak NN et al. Genome-wide changes in lncRNA, splicing, and regional gene expression patterns in autism. Nature 540, 423–427 (2016). [DOI] [PMC free article] [PubMed] [Google Scholar]
- 31.Wright C et al. Altered expression of histamine signaling genes in autism spectrum disorder. Transl. Psychiatry 7, e1126 (2017). [DOI] [PMC free article] [PubMed] [Google Scholar]
- 32.Jaffe AE et al. Developmental and genetic regulation of the human cortex transcriptome illuminate schizophrenia pathogenesis. Nat. Neurosci 21, 1117–1125 (2018). [DOI] [PMC free article] [PubMed] [Google Scholar]
- 33.Petrelli F, Pucci L & Bezzi P Astrocytes and Microglia and Their Potential Link with Autism Spectrum Disorders. Front. Cell Neurosci 10, 21 (2016). [DOI] [PMC free article] [PubMed] [Google Scholar]
- 34.Suzuki K et al. Microglial activation in young adults with autism spectrum disorder. JAMA Psychiatry 70, 49–58 (2013). [DOI] [PubMed] [Google Scholar]
- 35.Velmeshev D et al. Single-cell genomics identifies cell type-specific molecular changes in autism. Science 364, 685–689 (2019). [DOI] [PMC free article] [PubMed] [Google Scholar]
- 36.Ercan E et al. Neuronal CTGF/CCN2 negatively regulates myelination in a mouse model of tuberous sclerosis complex. J. Exp. Med 214, 681–697 (2017). [DOI] [PMC free article] [PubMed] [Google Scholar]
- 37.Pacey LKK et al. Delayed myelination in a mouse model of fragile X syndrome. Hum. Mol. Genet 22, 3920–3930 (2013). [DOI] [PubMed] [Google Scholar]
- 38.Scott R et al. Loss of cntnap2 causes axonal excitability deficits, developmental delay in cortical myelination, and abnormal stereotyped motor behavior. Cereb. Cortex 29, 586–597 (2019). [DOI] [PubMed] [Google Scholar]
- 39.Jung H et al. Sexually dimorphic behavior, neuronal activity, and gene expression in Chd8-mutant mice. Nat. Neurosci 21, 1218–1228 (2018). [DOI] [PubMed] [Google Scholar]
- 40.Bagot RC et al. Circuit-wide Transcriptional Profiling Reveals Brain Region-Specific Gene Networks Regulating Depression Susceptibility. Neuron 90, 969–983 (2016). [DOI] [PMC free article] [PubMed] [Google Scholar]
- 41.Jin C et al. Integrative Brain Transcriptome Analysis Reveals Region-Specific and Broad Molecular Changes in Shank3-Overexpressing Mice. Front. Mol. Neurosci 11, 250 (2018). [DOI] [PMC free article] [PubMed] [Google Scholar]
- 42.Zhao C et al. Dual requirement of CHD8 for chromatin landscape establishment and histone methyltransferase recruitment to promote CNS myelination and repair. Dev. Cell 45, 753–768.e8 (2018). [DOI] [PMC free article] [PubMed] [Google Scholar]
- 43.Deoni SCL et al. White-matter relaxation time and myelin water fraction differences in young adults with autism. Psychol. Med 45, 795–805 (2015). [DOI] [PubMed] [Google Scholar]
- 44.Wang D et al. Comprehensive functional genomic resource and integrative model for the human brain. Science 362, (2018). [DOI] [PMC free article] [PubMed] [Google Scholar]
- 45.Modi ME & Sahin M Translational use of event-related potentials to assess circuit integrity in ASD. Nat. Rev. Neurol 13, 160–170 (2017). [DOI] [PubMed] [Google Scholar]
- 46.Carmody DP & Lewis M Regional white matter development in children with autism spectrum disorders. Dev. Psychobiol 52, 755–763 (2010). [DOI] [PubMed] [Google Scholar]
- 47.Broek JA, Guest PC, Rahmoune H & Bahn S Proteomic analysis of post mortem brain tissue from autism patients: evidence for opposite changes in prefrontal cortex and cerebellum in synaptic connectivity-related proteins. Mol. Autism 5, 41 (2014). [DOI] [PMC free article] [PubMed] [Google Scholar]
- 48.Butler MG et al. Subset of individuals with autism spectrum disorders and extreme macrocephaly associated with germline PTEN tumour suppressor gene mutations. J. Med. Genet 42, 318–321 (2005). [DOI] [PMC free article] [PubMed] [Google Scholar]
- 49.Renieri A et al. Diagnostic criteria for the Zappella variant of Rett syndrome (the preserved speech variant). Brain Dev 31, 208–216 (2009). [DOI] [PubMed] [Google Scholar]
- 50.Monje M Myelin plasticity and nervous system function. Annu. Rev. Neurosci 41, 61–76 (2018). [DOI] [PubMed] [Google Scholar]
- 51.Zhuang Y, Cheng P & Weintraub H B-lymphocyte development is regulated by the combined dosage of three basic helix-loop-helix genes, E2A, E2–2, and HEB. Mol. Cell. Biol 16, 2898–2905 (1996). [DOI] [PMC free article] [PubMed] [Google Scholar]
- 52.Bergqvist I et al. The basic helix-loop-helix transcription factor E2–2 is involved in T lymphocyte development. Eur. J. Immunol 30, 2857–2863 (2000). [DOI] [PubMed] [Google Scholar]
- 53.Zawadzka M et al. CNS-resident glial progenitor/stem cells produce Schwann cells as well as oligodendrocytes during repair of CNS demyelination. Cell Stem Cell 6, 578–590 (2010). [DOI] [PMC free article] [PubMed] [Google Scholar]
- 54.Goebbels S et al. Elevated phosphatidylinositol 3,4,5-trisphosphate in glia triggers cell-autonomous membrane wrapping and myelination. J. Neurosci 30, 8953–8964 (2010). [DOI] [PMC free article] [PubMed] [Google Scholar]
- 55.Maher BJ & LoTurco JJ Disrupted-in-schizophrenia (DISC1) functions presynaptically at glutamatergic synapses. PLoS One 7, e34053 (2012). [DOI] [PMC free article] [PubMed] [Google Scholar]
- 56.Kim D, Langmead B & Salzberg SL HISAT: a fast spliced aligner with low memory requirements. Nat. Methods 12, 357–360 (2015). [DOI] [PMC free article] [PubMed] [Google Scholar]
- 57.Liao Y, Smyth GK & Shi W featureCounts: an efficient general purpose program for assigning sequence reads to genomic features. Bioinformatics 30, 923–930 (2014). [DOI] [PubMed] [Google Scholar]
- 58.Love MI, Huber W & Anders S Moderated estimation of fold change and dispersion for RNA-seq data with DESeq2. Genome Biol 15, 550 (2014). [DOI] [PMC free article] [PubMed] [Google Scholar]
- 59.Leek JT svaseq: removing batch effects and other unwanted noise from sequencing data. Nucleic Acids Res 42, (2014). [DOI] [PMC free article] [PubMed] [Google Scholar]
- 60.Yu G, Wang L-G, Han Y & He Q-Y clusterProfiler: an R package for comparing biological themes among gene clusters. OMICS 16, 284–287 (2012). [DOI] [PMC free article] [PubMed] [Google Scholar]
- 61.Xu X, Wells AB, O’Brien DR, Nehorai A & Dougherty JD Cell type-specific expression analysis to identify putative cellular mechanisms for neurogenetic disorders. J. Neurosci 34, 1420–1431 (2014). [DOI] [PMC free article] [PubMed] [Google Scholar]
- 62.Zhang Y et al. An RNA-sequencing transcriptome and splicing database of glia, neurons, and vascular cells of the cerebral cortex. J. Neurosci 34, 11929–11947 (2014). [DOI] [PMC free article] [PubMed] [Google Scholar]
- 63.Newman AM et al. Robust enumeration of cell subsets from tissue expression profiles. Nat. Methods 12, 453–457 (2015). [DOI] [PMC free article] [PubMed] [Google Scholar]
- 64.Abrahams BS et al. SFARI Gene 2.0: a community-driven knowledgebase for the autism spectrum disorders (ASDs). Mol. Autism 4, 36 (2013). [DOI] [PMC free article] [PubMed] [Google Scholar]
- 65.Banerjee-Basu S & Packer A SFARI Gene: an evolving database for the autism research community. Dis. Model. Mech 3, 133–135 (2010). [DOI] [PubMed] [Google Scholar]
- 66.Durinck S, Spellman PT, Birney E & Huber W Mapping identifiers for the integration of genomic datasets with the R/Bioconductor package biomaRt. Nat. Protoc 4, 1184–1191 (2009). [DOI] [PMC free article] [PubMed] [Google Scholar]
- 67.Jaffe AE et al. qSVA framework for RNA quality correction in differential expression analysis. Proc. Natl. Acad. Sci. USA 114, 7130–7135 (2017). [DOI] [PMC free article] [PubMed] [Google Scholar]
- 68.Jaffe AE et al. Practical impacts of genomic data “cleaning” on biological discovery using surrogate variable analysis. BMC Bioinformatics 16, 372 (2015). [DOI] [PMC free article] [PubMed] [Google Scholar]
- 69.Darmanis S et al. A survey of human brain transcriptome diversity at the single cell level. Proc. Natl. Acad. Sci. USA 112, 7285–7290 (2015). [DOI] [PMC free article] [PubMed] [Google Scholar]
- 70.Houseman EA et al. DNA methylation arrays as surrogate measures of cell mixture distribution. BMC Bioinformatics 13, 86 (2012). [DOI] [PMC free article] [PubMed] [Google Scholar]
Associated Data
This section collects any data citations, data availability statements, or supplementary materials included in this article.


