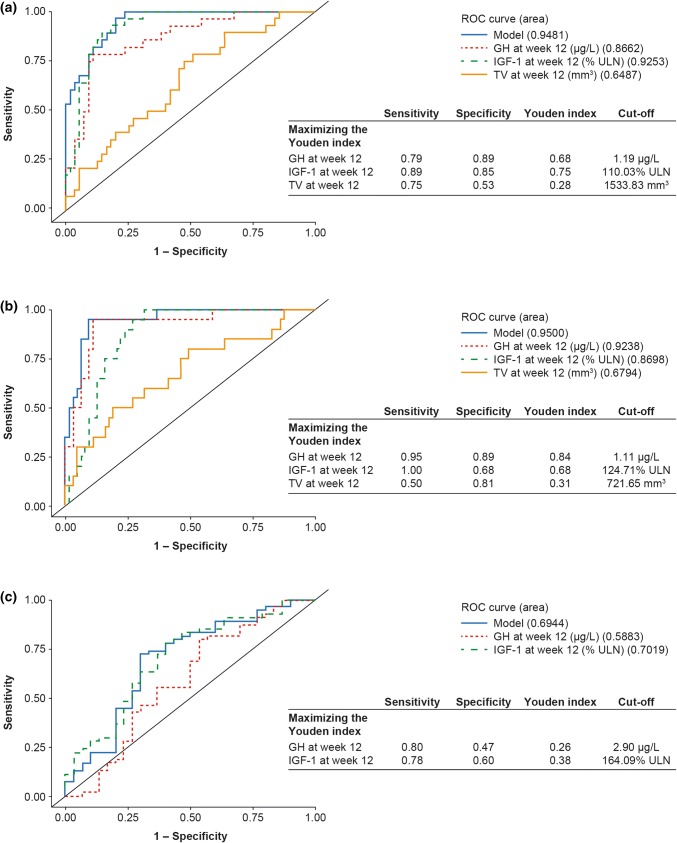
Fig. 3.
ROC curves drawn for the calculation of week-12 cut-off values for predicting hormonal control and TV responder status at LVA when a hormonal control is defined as GH ≤ 2.5 µg/L and IGF-1 levels within normal ranges at LVA, b tight hormonal control is defined as GH < 1.0 µg/L and IGF-1 levels within normal ranges at LVA, and c TV responder status is defined as ≤ 20% reduction in TV at LVA. GH growth hormone, IGF-1 insulin-like growth factor-1, LVA last post-baseline value available, ROC receiver operating characteristic, TV tumor volume, ULN upper limit of normal. Data are from the intention-to-treat population for patients with LVA data (n = 88)

