Abstract
Isoniazid is an important first-line antitubercular drug used in the treatment of all major clinical manifestations of tuberculosis, including both pulmonary and cerebral diseases. However, it is associated with significant drawbacks due to its inherent hydrophilic nature, including poor gut permeability and an inability to cross the lipophilic blood–brain barrier, which, in turn, limit its clinical efficacy. We hypothesized that the addition of a hydrophobic moiety to this molecule would help overcome these limitations and improve its bioavailability in the bloodstream. Therefore, we designed a stable, covalently linked lipid–drug conjugate of isoniazid with a short lipid chain of stearoyl chloride. Further, lipid–drug conjugate nanoparticles were synthesized from the bulk lipid–drug conjugate by a cold high-pressure homogenization method enabled by the optimized use of aqueous surfactants. The nanoparticle formulation was characterized systematically using in vitro physicochemical analytical methods, including atomic force microscopy, transmission electron microscopy, differential scanning calorimetry, X-ray diffraction, attenuated total reflectance, particle size, ζ-potential, and drug release studies, and the mechanism of drug release kinetics. These investigations revealed that the lipid–drug conjugate nanoparticles were loaded with an appreciable amount of isoniazid conjugate (92.73 ± 6.31% w/w). The prepared lipid–drug conjugate nanoparticles displayed a uniform shape with a smooth surface having a particle size of 124.60 ± 5.56 nm. In vitro drug release studies showed sustained release up to 72 h in a phosphate-buffered solution at pH 7.4. The release profile fitted to various known models of release kinetics revealed that the Higuchi model of diffusion kinetics was the best-fitting model (R2 = 0.9929). In addition, confocal studies showed efficient uptake of lipid–drug conjugate nanoparticles by THP-1 macrophages presumably because of increased lipophilicity and anionic surface charge. This was followed by progressive intracellular trafficking into endosomal and lysosomal vesicles and colocalization with intravesicular compartmental proteins associated with mycobacterium tuberculosis pathogenesis, including CD63, LAMP-2, EEA1, and Rab11. The developed lipid–drug conjugate nanoparticles, therefore, displayed significant ability to improve the intracellular delivery of a highly water-soluble drug such as isoniazid.
1. Introduction
Isoniazid (INH) is an important oral antitubercular drug (ATD) recommended by the World Health Organization for the first-line management of all major clinical manifestations of tuberculosis (TB). INH has an aqueous solubility of 230 mg/mL at 25 °C, the highest reported among all first-line oral ATDs. Unfortunately, as a consequence of this inherent hydrophilic nature, the drug is associated with significant drawbacks that limit its clinical efficacy.1 The most important among them are the poor gut permeability of the small molecule and its inability to cross the lipophilic blood–brain barrier, both of which limit the systemic bioavailability of the drug.2
Strategies for improving the permeability of hydrophilic drugs include encapsulation in hydrophobic matrices, such as lipophilic polymers or lipids, and subsequent formulation of the drug-encapsulated matrix at the nanoscale as colloidal or stably suspended nanoparticles. Among the so-called “lipid nanoparticle formulations” (LNFs), solid lipid nanoparticles and nanostructured lipid carriers have received considerable interest due to their ability to overcome the limitations of many colloidal carriers.3−7 However, it has also been shown that in comparison with lipophilic drugs these LNFs cannot incorporate extremely hydrophilic drugs in a stable and efficient manner.8−10 This is primarily because the drug tends to partition toward the aqueous phase during the process of production. Although an effort has already been made to tackle this problem in TB treatment, encapsulation of hydrophilic drugs into the hydrophobic core of most LNFs still remains a major challenge.11
A potentially more refined strategy is that of the design and synthesis of lipid–drug conjugate nanoparticles (LDC-NPs). Here, a hydrophilic drug is converted into a water-insoluble lipid–drug conjugate (LDC) by covalent linkage with lipid components,12 thereby creating an amphiphilic prodrug molecule. The selected drug moiety should ideally have a suitable terminal functional group, such as an amino or hydroxyl group. This would enable facile conjugation with the corresponding reactive species, such as a carboxyl group, present in the lipid component. The insoluble LDC is initially prepared either by salt formation or by covalent linking, following which the bulk LDC is reformulated into lipid nanoparticles, typically by using a cold high-pressure homogenization technique.13
LDC-NPs present a viable alternative drug carrier system to traditional colloidal carriers such as liposomes, nanoemulsions, and polymeric nano- and microparticles, as they possess advantages of controlled drug release, drug targeting, increased intestinal permeability, and enhanced bioavailability. It has been reported that drugs incorporated into lipids and stabilized by the use of various surfactants show high permeability because both lipids and surfactants act as good permeation enhancers of drugs in the gastrointestinal tract. This is mediated by the solubilization of the drug in the intestinal milieu and a reduction in the first-pass metabolism, by transport of the drug through the lymphatic route to the systemic circulation.14,15 The surfactant mixtures used for the stabilization of the LDC-NPs have their own role to play in increasing the permeability of the drug through the intestine by inhibiting the P-glycoprotein efflux pump present in the intestinal brush border region.16,17 Finally, from a translational perspective, LDC-NPs offer scalability and ease of production. When coupled with the use of lipid excipients having “generally regarded as safe” status, and avoidance of organic solvents for production,18 these formulations may also benefit from improved acceptance by regulatory agencies.
Bone-marrow-derived monocytes are the prime source of circulating monocytes in blood, which can differentiate into macrophages on demand in distinct tissue and represent the forefront of human innate immune defense. In the process of monocyte-to-macrophage differentiation, they expressed different cellular receptors to interact, sense, and internalize pathogenic bacteria as well as nanoparticles.19,20 Kinetics of cellular uptake and endocytic fusion, which mimic the engulfment of pathogenic bacteria by autophagy in macrophages, is the only way to replicate and represent the efficacy of engineered nanoparticles. On this account, THP-1 has a history of nanoparticle-mediated drug development in various diseases due to its availability, wide range of differentiation, expression of macrophage surface markers and phagocytic capability, which replicate human macrophages under laboratory conditions.21,22 It helps create an in vitro model to study the mechanistic approach of cellular uptake and cell–nanoparticle interactions. We have directed our molecular investigation and endocytic trafficking in THP-1 cells to counteract the large population of bacteria residing in macrophages during mycobacterium tuberculosis (MTb) infection.23
We hypothesized that the addition of a hydrophobic moiety, in particular a short-chain lipid such as stearoyl chloride (SC), to INH would create a novel formulation that could potentially overcome the limitations posed by the drug’s inherent hydrophilic nature. The low permeability (log P of −0.402 at 25 °C) of this drug makes it a good candidate for delivery via a lipid-based nanoparticulate system, as this would improve its gut permeability and, subsequently, its bioavailability in the bloodstream. Furthermore, INH contains a free terminal amino group, which may be employed in the formation of covalent linkages with the selected lipid moiety. A literature survey also revealed that there has been no report to date on the synthesis of LDC-NPs containing ATDs such as INH. Therefore, the specific objective of this study was to synthesize LDC-NPs for oral delivery of INH. Further, a thorough in vitro characterization and drug release study of the optimized LDC-NPs would be performed to assess their suitability for clinical translation for use in antitubercular therapy.
2. Results and Discussion
2.1. Characterization of Bulk LDC
2.1.1. Thin-Layer Chromatography (TLC)
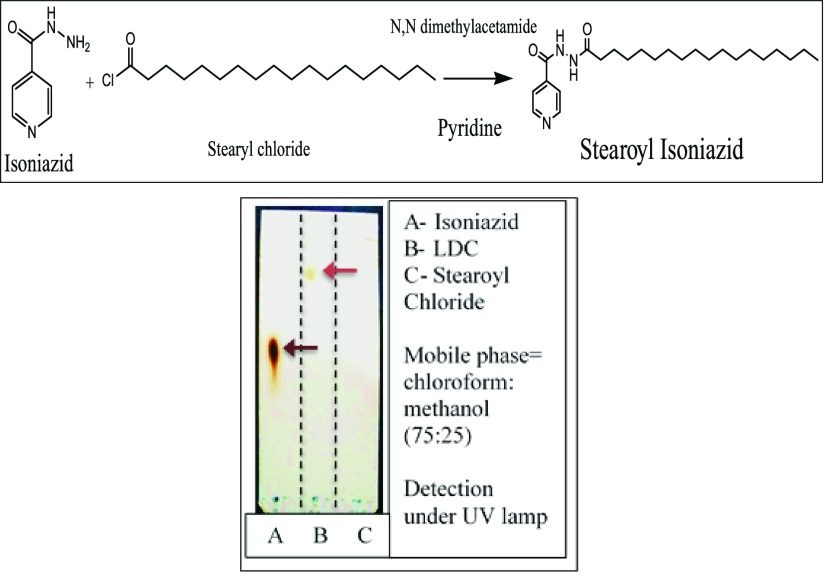
A possible synthetic reaction scheme and a representative TLC run of the optimized LDC are shown in Figure 1 (Top) and (Bottom), respectively. As seen in lane A, INH exhibited a spot at Rf value 0.6. In lane B, the LDC exhibited a spot at Rf value 0.84, and in lane C, the spot for stearoyl chloride exhibited a spot at Rf value 0. From the Rf values, it is evident that INH and LDC exhibit spots at different Rf values, thereby implying that the conjugation reaction was completed and no free INH was left in the LDC after washing. This confirmed that the entire mass of INH was utilized in the conjugation reaction, thereby also confirming the formation of the lipid–drug conjugate. It can also be inferred that the synthesized bulk LDC is less polar than INH, as it travels more distance on the TLC plate in comparison with INH.
Figure 1.
(Top) Chemical reaction for synthesis of the stearoyl–INH LDC. TLC runs for confirmation of the formation of the LDC (Bottom).
2.1.2. Attenuated Total Reflectance (ATR)
ATR spectra of pure INH, SC, and the synthesized LDC are presented in Figure 2. Pure INH (Figure 2A) shows characteristic peaks at wavenumbers 3208.42 and 3107.16 cm–1 corresponding to a primary amine (N–H stretch), 3739.67 cm–1 for the N–H stretch coupled with primary amide, 2987.69 cm–1 for the aromatic C–H stretching, 1663.16 cm–1 for the C=O stretching in a cyclic ring, and 1492.58 cm–1 for the aromatic C=C stretching. The peak at 1220.84 cm–1 is due to the aromatic C–N stretch present at the pyridine ring of INH. The ATR spectrum of SC (Figure 2B) indicates its characteristic peaks at 2922.87 cm–1 for the alkane C–H stretch present at the long chain, 1800.56 cm–1 for the C=O stretching, and 720.73 cm–1 for the characteristic C–Cl stretching.
Figure 2.
ATR spectra of (A) pure INH, (B) pure SC, and (C) bulk LDC.
The spectrum of the LDC (Figure 2C) shows an intense peak at 3218.85 cm–1 for the two N–H stretches coupled with two C=O attached with INH and the stearoyl moiety. Additional peaks were seen at 2954.85 cm–1 for the aromatic C–H stretching and at 1666.48 cm–1 for the C=O stretching attached with the pyridine ring of INH. The peak at 1496.96 cm–1 correlates well with the one from 1492.58 cm–1 in INH for the aromatic C=C stretching, while the one at 1222.05 cm–1 is due to the aromatic C–N stretch present at the pyridine ring of INH. A peak at 1792.47 cm–1 indicated C=O stretching attached with the long carbon chain from the lipid, whereas the one at 2917.01 cm–1 represents the alkane C–H stretch present at the long chain. No peaks were observed for C–Cl stretching and primary amine N–H stretching at 720.73 cm–1 and 3107.16 cm–1, respectively, as seen in the spectra for pure INH, indicating successful covalent bonding. Furthermore, an intense peak corresponding to the merging of N–H stretching (3218.85 cm–1) and the presence of two C=O peaks with the shifting of the C=O peak (1666.48 and 1792.47 cm–1) confirms the formation of an amide bond between INH and SC, thereby substantiating the formation of the LDC.
2.1.3. Proton NMR
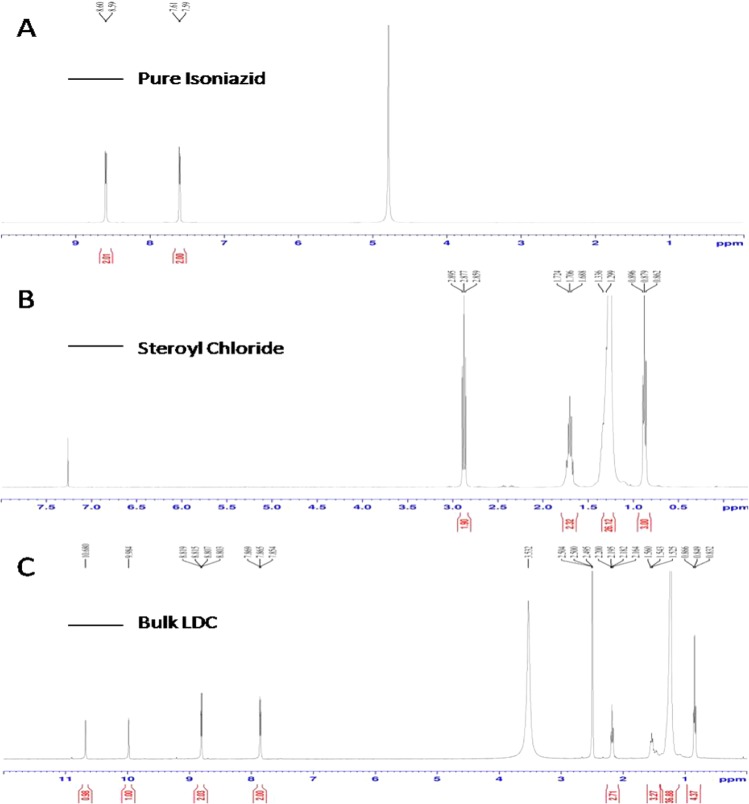
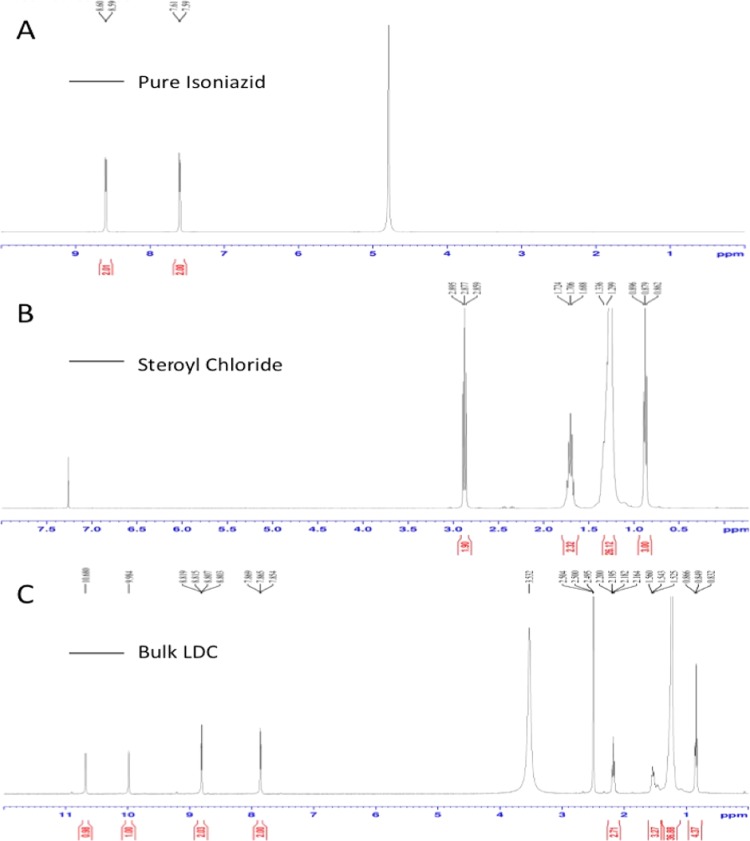
The proton NMR spectra of pure INH, pure SC, and bulk LDC are presented in Figure 3. The spectrum for INH, as presented in Figure 3A, shows a characteristic peak at a δ-value of 8.6 for the aromatic protons bound to the 2C atom, which is coupled with the nitrogen atom of the aromatic ring. The intensity of the peak was found to be 2, indicating the presence of two hydrogen atoms associated with this 2C atom. The peak at a δ-value of 7.6 and a peak intensity of 2 represent two aromatic protons bound to the carbon atoms present at the meta position of the aromatic ring.
Figure 3.
Proton NMR spectra of (A) pure INH, (B) pure SC, and (C) bulk LDC.
For pure SC (Figure 3B), a peak at a δ-value of 0.88 was observed for the CH3 proton of SC present at the end of the long chain, while the peak at a δ-value of 2.88 was representative of the CH2 protons coupled with C–O bonding. A peak at a δ-value of 1.706 may be attributed to the CH2 protons coupled with the C3 atom of the stearoyl moiety. The peak at a δ-value of 1.318 can be attributed to the CH2 protons from C4 to C17 of the stearoyl chloride chain.
For the synthesized stearoyl–isoniazid LDC (Figure 3C), the peak at a δ-value of 8.756 is analogous to that seen at a δ-value of 8.6 in the INH spectra, as discussed above. Similarly, the peak at a δ-value of 7.6 is the same as that described above, arising from the protons of the INH aromatic ring. The peak at a δ-value of 0.85 corresponds to the peak at 0.88 seen in the SC spectrum above. The peaks at δ-values of 2.178 and 1.542 arise from the CH2 protons coupled with C–O bonding and the following CH2 protons from the C3 atom of the stearoyl moiety, respectively. The peak at a δ-value of 1.193 arises from the CH2 protons present in the SC chain. The peak at a δ-value of 9.938 indicates the presence of N–H protons coupled with the C=O group of the isoniazid molecule. The characteristic peak at a δ-value of 10.588 indicates the presence of N–H protons, thereby confirming the formation of an amide bond between the aromatic INH and aliphatic stearic acid. A comparison of the three spectra, therefore, provides confirmation of an amide bond formation between the lipid and drug to produce the desired product (stearoyl–isoniazid conjugate).
2.1.4. Mass Spectroscopy
Mass spectra of pure INH and bulk LDC are presented in Figure 4. These spectra show intense (M + H)+ peaks at 138.011 and 404.287, reflecting molecular weights of INH (Figure 4A) and LDC (Figure 4B), respectively. This compares well with the reported molecular weight of 137.139 for INH, as mentioned in the monograph, and the theoretical molecular weight of 403 of the new compound. There was no major fragmentation of the compound as a soft ionization technique was used for estimating the molecular weight. The result reflects the success of the conjugation reaction, and the formation of the LDC with the amide bond is thus confirmed.
Figure 4.
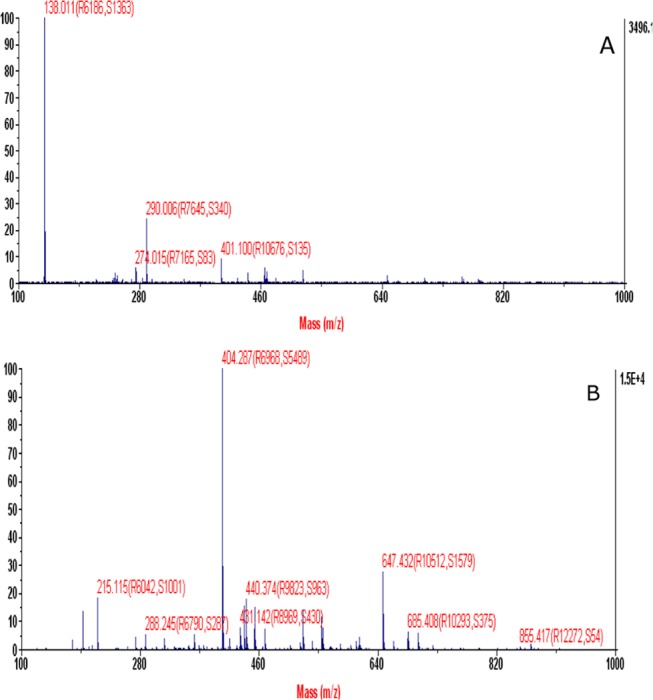
Mass spectroscopy of (A) pure INH and (B) bulk LDC.
2.1.5. Percentage Conjugation Efficiency and Percentage Yield Estimation
On the basis of the formulae described earlier, the percentage conjugation efficiency and percentage yield values obtained for the bulk LDC are 92.73% (±6.31) and 92.01% (±3.08), respectively.
2.2. Characterization of LDC-NPs
2.2.1. Atomic Force Microscopy (AFM)
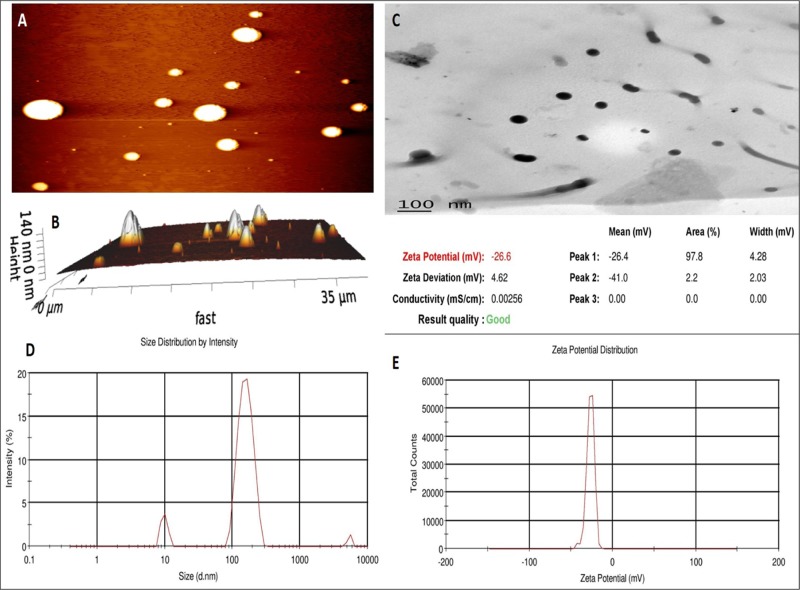
AFM tapping mode showed both planar images (Figure 5A) and 3D images (Figure 5B) in terms of LDC-NP height. The images show that the LDC-NPs have a smooth surface and a maximum height of 140 nm. Some earlier reports have suggested that particle size might increase due to flattening of lipid-based nanoparticles on mica sheets after deposition.24,25 However, in our observations, the surface morphology of LDC-NPs appears unaffected and the image appears to provide a realistic rendering of the particles.
Figure 5.
LDC-NPs: (A) planar AFM image, (B) 3D AFM image, (C) transmission electron microscopy (TEM) image of LDC-NPs, (D) particle size distribution of LDC-NPs, and (E) ζ-potential value of LDC-NPs.
2.2.2. Transmission Electron Microscopy (TEM)
Additional investigation of the surface morphology of LDC-NPs was performed by TEM analysis. Figure 5C represents the TEM image of LDC-NPs, which shows that the particles are discrete, spherical, smooth, nonaggregated, and uniformly sized, ranging from 100 to 200 nm. This showed good correlation with the particle size obtained from the dynamic light scattering (DLS) analysis. The presence of nonaggregated, discrete particles also correlated well with the high negative ζ-potential values reported above, suggesting that appropriate choices of lipid and surfactant combinations have produced stable, disperse LDC-NPs.
2.2.3. Particle Size, Polydispersity Index (PDI), and ζ-Potential
The LDC-NPs obtained were found to have an average particle size of 124.60 ± 5.56 nm with a PDI value of 0.443 ± 0.065 (Figure 5D) from the DLS analysis. The LDC-NPs are of the desired size range of less than 200 nm and are relatively monodisperse. Further, the average ζ-potential of these NPs was reported to be −26.6 ± 4.91 mV (Figure 5E). From the literature, it is reported that a ζ-potential of approximately −30 mV is optimal for ensuring maximum stability of NPs in a dispersed medium, suggesting that the synthesized LDC-NPs are likely to be stable in suspension.1
2.2.4. Attenuated Total Reflectance (ATR)
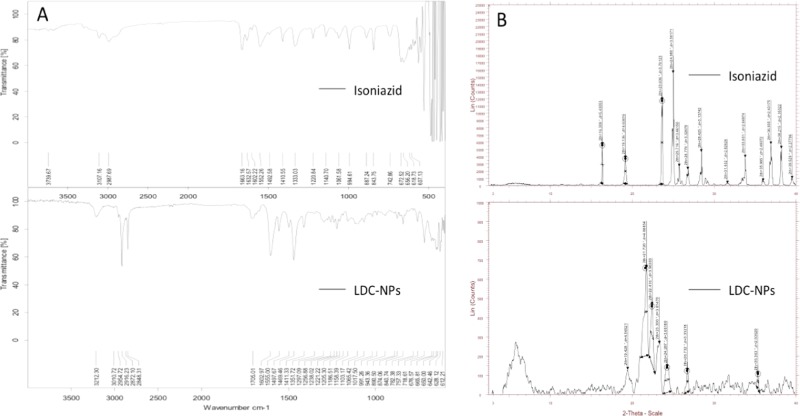
ATR spectra (Figure 6A, bottom panel) of LDC-NPs showed intense peaks at 3212.30, 3010.72, 1602.97, 1706.01, 1497, 1222.21, and 2916.69 cm–1, analogous to those seen in the ATR spectra of INH (Figure 6A, top panel) and of bulk LDC (Figure 2C). Moreover, the peak at 3212.30 cm–1 for merging of N–H stretching coupled with the amide bond and presence of two C=O peaks with the shifting of the C=O peak confirms the amide bond between INH and SC that previously substantiated the formation of the bulk LDC. This indicates that there is no structural dissimilarity in the matrix of the bulk LDC and the LDC-NPs after the homogenization technique and confirms that the NPs obtained are in pure LDC form.
Figure 6.
(A) ATR spectra of INH and LDC-NPs, and (B) X-ray diffraction (XRD) images of INH and LDC-NPs.
2.2.5. X-ray Powder Diffraction (XRD)
XRD spectra of pure INH and LDC-NPs are represented in Figure 6B. The XRD spectrum of pure INH showed peaks at diffraction angles 2θ of 16.309, 19.136, 23.626, 24.980, 25.716, 26.776, 28.425, 33.801, 36.935, 38.215, and 39.529 (Figure 6B, top panel). Again, the XRD spectrum of drug-loaded LDC-NPs showed a decrease in the peak intensity as compared to that of pure drug, indicating a decrease in crystallinity. However, the presence of INH peaks in LDC-NPs at 19.428, 23.300, 24.287, and 26.732 suggests either incorporation or conjugation of INH with SC (Figure 6B, bottom panel). The XRD spectrum of LDC-NPs did not show any other abundant peaks of INH and also showed no major peak shift, which suggested that there were no crystalline modifications of the LDC during the nanoparticle preparation.
2.2.6. Differential Scanning Calorimetry (DSC)
DSC curves of pristine INH (Figure 7, top panel) and LDC-NPs (Figure 7, bottom panel) showed endothermic peaks at 171.43 and 124.37 °C, respectively, which reflect their respective melting points. The sharp DSC peak of pristine INH indicates the crystalline structure of the drug and also correlates well with that in the literature.26 DSC curves of the LDC-NPs showed two endothermic peaks at 124.37 and 101.08 °C, whereas the corresponding endothermic peak of INH was found to be absent. Thus, the appearance of the two unrelated peaks, demonstrating a distinctly different heat capacity as compared to that of the parent compounds, confirms the formation of a new compound. The endothermic peaks of lyophilized LDC-NPs showed altered endothermic peaks as compared to those of the pure drug, indicating the thermal stability of the conjugate after conversion to nanoparticles. The peak of the lipid component of LDC-NPs is slightly wider and slightly greater at the melting point than the corresponding peak of the pure lipid (data not shown), which indicates a more stable crystalline form of the LDC.27
Figure 7.
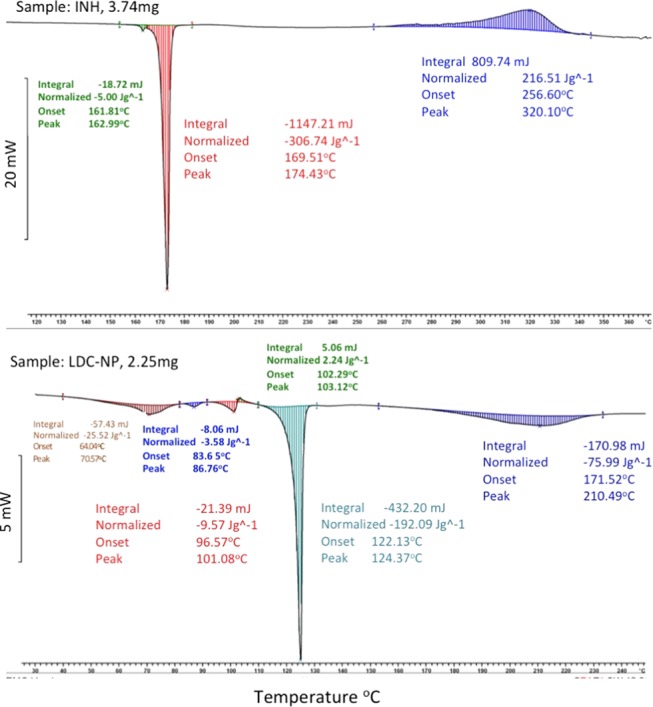
DSC thermogram of (Top Panel) pure INH and (Bottom Panel) LDC-NPs.
2.2.7. Molecular Environment of LNF-NPs
Nile red is a lipophilic fluorescent marker whose absorption bands vary in shape, position, and intensity with the nature of the environment. Nile red is highly soluble in organic solvents, such as acetone, and strongly fluorescent in a lipophilic environment. As shown in Figure 8, samples demonstrated an increasing trend of shift in emission wavelength as follows: NR (603 nm) > SC (601 nm) > LDC (602.8 nm) > LDC-NPs (631 nm). For samples suspended in highly lipophilic solvents, such as Nile red in acetone, and lipophilic samples, such as SC and LDC, in an aqueous medium, the emission maxima were found to be near around 600 nm with high fluorescence intensity. When incorporated into a nanoparticulate formulation, the probable reorientation of the surrounding water molecules around the LDC-NP surface led to emission shifts to longer wavelengths around 630 nm.
Figure 8.
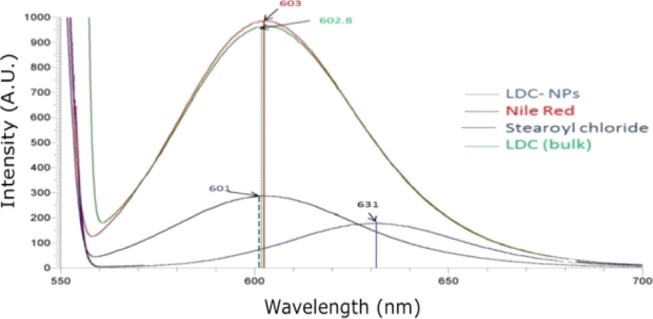
Fluorescence spectra of pure Nile red in acetone (red trace), and stearoyl chloride (black trace), bulk LDC (green trace), and LDC-NPs (blue trace) in an aqueous solution (1 ppm).
The lipophilicity also decreased following a decrease in the size content of the formulations. It should be noted that the bulk LDC (green line peaking at 601 nm), which is typically formulated as large irregular flakes or microparticles, showed a higher intensity compared with LDC-NPs (631 nm). A possible cause of the reduced intensity of LDC-NPs is the aggregation of Nile red and its relocation to a less nonpolar environment in the core of the nanoparticles. In contrast, crystallization in the inner phase of the bulk LDC may have reduced its capacity to accommodate foreign molecules and caused the expulsion and aggregation of Nile red on the surface, reflecting the higher signal intensity.
2.2.8. In Vitro Drug Release from LDC-NPs
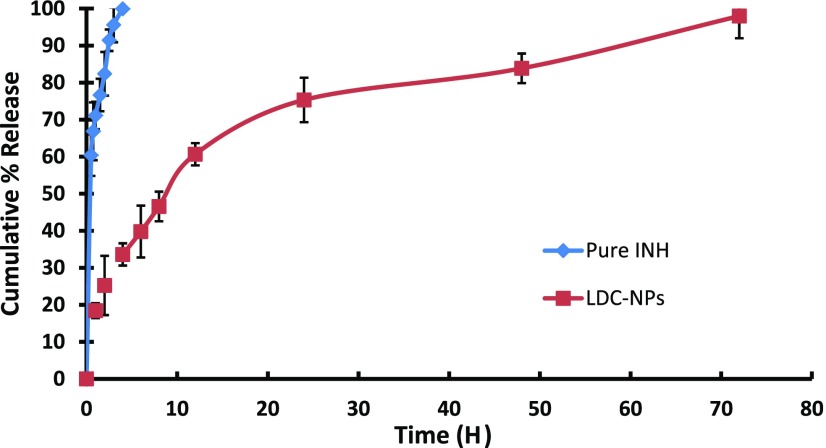
Figure 9 represents comparative in vitro INH release from its solution and LDC-NPs (after acid treatment) in simulated intestinal fluid (SIF) phosphate buffer at pH 7.4. From the drug release profile, it is observed that INH showed a monophasic release and was completely (99.65%) released from solution within 4 h. In comparison, LDC-NPs showed a biphasic drug release pattern; the formulation showed initial accelerated release up to 12 h (60.65% of cumulative release), followed by sustained release up to 72 h (97.97% of cumulative release). As such, although no burst-release effect was observed, the release rate of the primary phase was considerably faster than that of the steady release phase. The prolonged release of INH from LDC-NPs may have been mediated by initial dissolution of LDC molecules at the surface of LDC-NPs, followed by the cleavage of the amide bond during acid treatment of the conjugate. A decrease in the osmotic flux of the local environment over time and the corresponding increase in lipophilicity of the solvent system may have also contributed to the sustained release in the steady state.
Figure 9.
In vitro drug release profile of pure INH and INH from LDC-NPs in SIF at pH 7.4.
2.2.9. Mechanism of Drug Release Kinetics
As described earlier, the in vitro release data were fitted into various mathematical release kinetic models such as the zero-order model, first-order model, Higuchi model, and Hixson–Crowell model to determine the best-fit model on the basis of the regression coefficient (r2) value. The r2 values for each of the models are presented in Table 1. As the maximum regression coefficient of LDC-NPs was found to be 0.9929 in the Higuchi model, plotted as cumulative % drug release versus square root of time, it was concluded that INH release from LDC-NPs obeyed the Higuchi model of diffusion kinetics.
Table 1. In Vitro Release Model Fitting in Terms of Linear Regression Coefficient (r2) Values.
| model | r2 values |
|---|---|
| zero order | 0.9006 |
| first order | 0.9384 |
| Higuchi | 0.9929 |
| Hixson–Crowell | 0.8865 |
| Korsmeyer–Peppas | 0.9699 |
2.3. Characterization of in Vitro Safety, Uptake, and Intracellular Trafficking
2.3.1. Cell Viability Assay
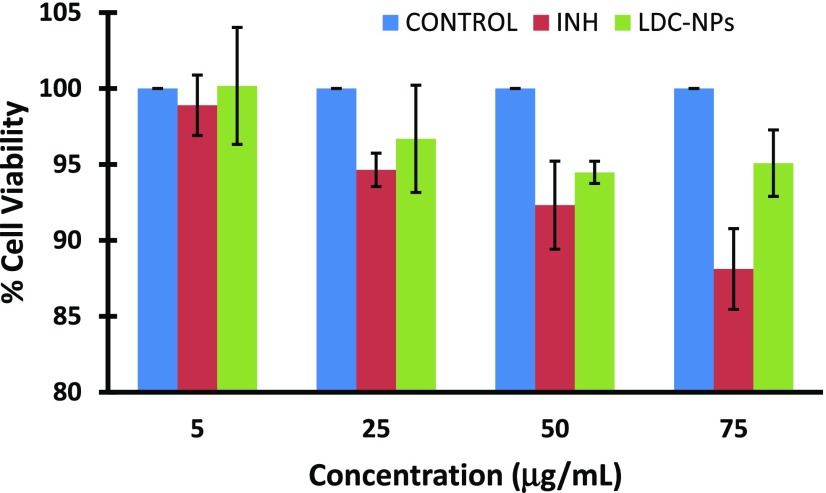
In this study, the evaluation of the toxicity of LDC-NPs and INH was evaluated using the alamarBlue assay; alamarBlue or resazurin provides weak fluorescence, until it is metabolically reduced by healthy live cells to a pink color and highly red fluorescent resorufin, which is detectable. Resazurin is effectively reduced in mitochondria, making it useful also to assess mitochondrial metabolic activity without any effect on the electron transport chain. For more sensitive detection with low cell numbers, we increased the incubation time up to 24 h. The experimental outcome indicates minimal toxicity from the LDC-NPs even at relatively high doses used in the cell viability study (Figure 10).
Figure 10.
Effect of LDC-NPs and INH on cell viability of the human differentiated monocytes THP-1.
2.3.2. Internalization of LDC-NPs in THP-1 Cells
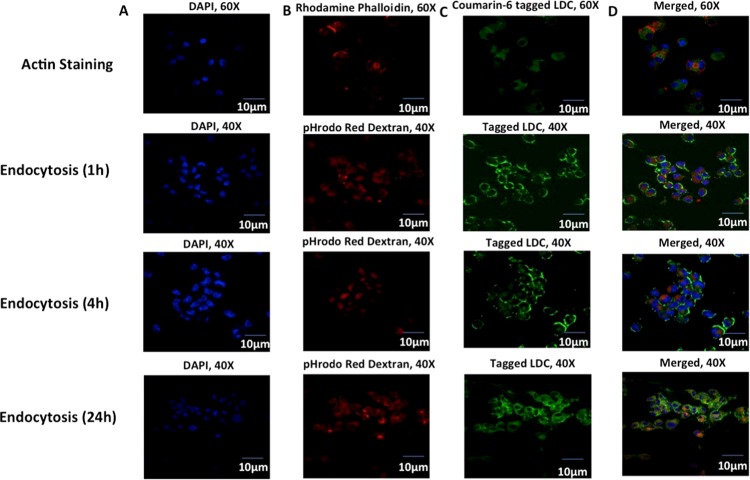
To establish preliminary uptake and localization of LDC-NPs in human macrophages, coumarin-6-tagged formulations were incubated with phorbol 12-myristate 13-acetate (PMA)-differentiated human macrophage-like THP-1 cells. For this purpose, LDC-NPs containing the fluorescent label coumarin-6 were tested at 75 μg/mL at 37 °C for 4 h. 4′,6-Diamidino-2-phenylindole (DAPI) was used to stain nucleus while rhodamine phalloidin was used to stain actin filaments and cell membranes in podosomes and membrane projections of cells, respectively (Figure 11, top row). Confocal microscopy provided preliminary confirmation of internalization of LDC-NPs in macrophages. Colocalization of green fluorescence with rhodamine phalloidin suggested that the nanoparticles were well distributed in the cytoplasm.
Figure 11.
(Top Row) Confocal imaging of actin staining using (A) DAPI-stained nucleus, (B) rhodamine phalloidin-stained actin filaments, (C) coumarin-6-labeled LDC-NPs, (D) merged imaging of particles’ internalization in fixed THP-1 cells at 60× magnifications (Rows 2–4): Confocal microscopy imaging of (A) DAPI-stained nucleus in the blue channel, (B) pHrodo Red dextran in the red channel, (C) coumarin-6-labeled LDC-NPs in differentiated THP-1 cells under the green channel, respectively. Merged imaging of all channels (D) with orange-yellow and faint yellow coloration signifying the colocalization of LDC-NPs in respective vesicle compartments at a fixed magnification scale.
2.3.3. Fluid-Phase Endocytosis of LDC-NP in THP-1 Cells
Fluid-phase endocytosis regulates a range of physiological functions and trafficking of endosomes, which carry the nanoparticles into intracellular compartments. To identify the alteration in membrane dynamics, we used pHrodo Red dextran that can stain the early endosome, while also trafficking with endosomal maturation to finally accumulate in the lysosomal compartment. The concentration of pHrodo Red dextran in the endosomal compartment is directly correlated with the endocytic uptake in THP-1 cells. It has been well established that anionic lipid formulations are less toxic than cationic ones.28 Cationic liposomes can cause cytotoxicity, through mitochondrial depolarization, generating reactive oxygen species, releasing cytochrome c, caspase-3, and caspase-8, limiting their safety for clinical use.29 In the present study, we developed anionic LDC-NPs to facilitate better uptake with minimal toxicity in differentiated macrophages.30,31 Our experimental design for evaluating endocytosis of coumarin-6-tagged LDC-NPs with pHrodo Red dextran with THP-1 cells (Figure 11) elucidated the mechanism of increased uptake of LDC-NPs in a time-dependent manner. Confocal microscopy confirmed that in as early as 1 h there is significant uptake of LDC-NPs localized primarily at the cell membrane (Figure 11, row 2). Subsequently, there is a progressive internalization through the cell membrane into the cytosol over 4 h (Figure 11, row 3), with increasing diffusion of signal in the cytoplasm. After the initial uptake, LDC-NPs accumulated in the endosomes over 24 h, as seen by the diffuse green signal throughout the cytoplasm and colocalization of the LDC-NPs with the pHrodo Red dextran staining (Figure 11, bottom row).
2.3.4. pH-Dependent Intracellular Trafficking within THP-1
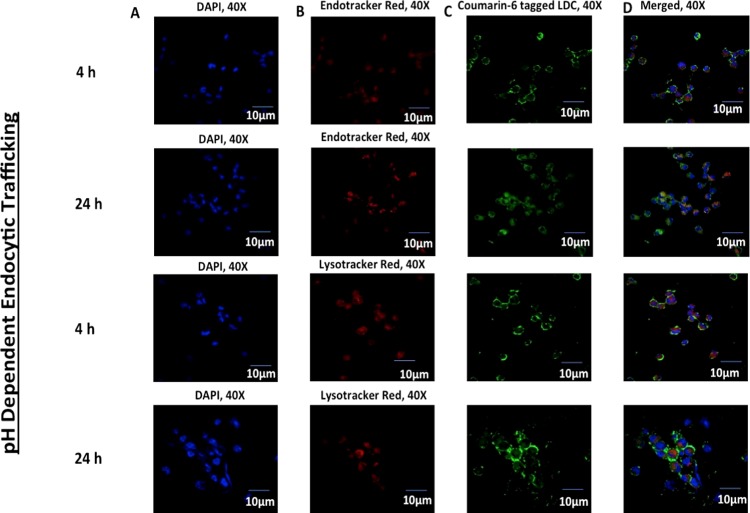
Confocal scanning microscopic imaging was used to follow the intracellular trafficking of coumarin-6-labeled LDC-NPs following their uptake in differentiated THP-1 cells (Figure 12). ER-Tracker Red and LysoTracker Red D99 dyes, which are highly selective for acidic organelles, were used as pH-dependent markers of endosomal and lysosomal compartments, respectively. After 4 and 24 h of incubation with coumarin-6-labeled LDC-NPs, significant colocalization in both endosomal and lysosomal compartments was observed.
Figure 12.
Confocal microscopy imaging of (A) DAPI-stained nucleus in the blue channel, (B) ER-Tracker Red and LysoTracker Red D99 in the red channel for lysosomes and endosomes, (C) coumarin-6-labeled LDC-NPs. Merged imaging of all channels (D) with pink and faint yellow coloration, signifying the colocalization of LDC-NPs in respective lysosomal and endosomal compartments at a fixed magnification scale.
As a majority of the bacteria reside in the arrested phagolysosomal compartment during MTb infection, it is necessary to deliver the NPs in this protease-rich acidic environment. Our data suggest that the anionic hydrophobic core provided by LDC-NPs promotes their facile uptake and subsequent trafficking deep into intracellular compartments.32 The in vitro drug release profile of the LDC-NPs validates that the amide linkage between INH and the stearoyl moiety can be cleaved at the lysosomal pH. This allows the release of the INH from the LDC-NPs on reaching these low-pH environments and ensures intracellular, pH-dependent delivery of INH to act against any pathogenic bacteria residing in the phagolysosomal compartment.
2.3.5. Colocalization of LDC-NPs with Intravesicular Compartmental Proteins
The effect of LDC-NPs on intracellular trafficking was elaborately investigated by mimicking the survival mechanism of MTb in the host cell. It is well established that MTb residing in endosomes evades macrophage-mediated degradation by preventing fusion of the endosome with the nascent phagosome, thereby arresting subsequent acidification of early and late endosomes into phagolysosomal pH.33 GTPases Rab5, Rab7, Rab11, Rab14, and EEA1 are the main group of proteins that are expressed ubiquitously on the surface of early and late endosomes. Among them, Rab11 and EEA1 control the interaction of the nascent phagosome with the early and recycling endosome through fusion–fission mechanisms. They also control the MHC class-II maturation by the formation of early, intermediate, late, and phagolysosomes.20,34−37 Hence, we chose to identify vesicles expressing Rab11 and EEA1, as they connect with the nascent endocytic vesicles and control their maturation to convert them into recycling vesicles.
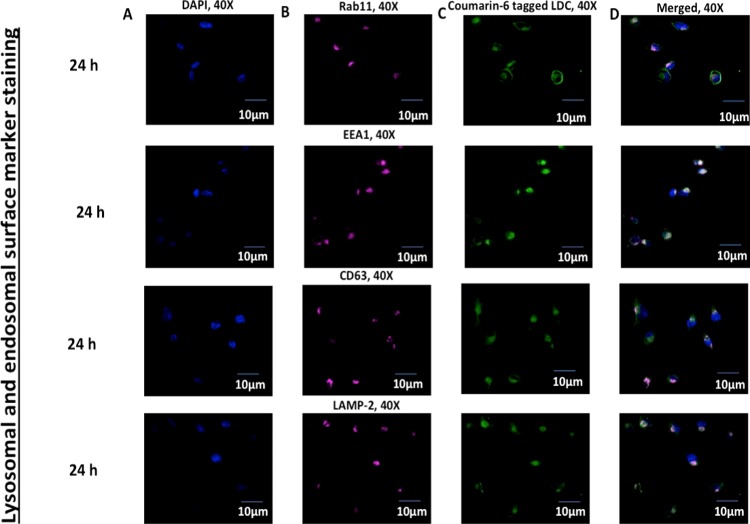
As seen in Figure 13 (rows 1 and 2), LDC-NPs effectively colocalized with fluorescently labeled antibodies against Rab11 and EEA1, indicating that our delivery system may be able to deliver INH into those intracellular compartments where the MTb pathogen resides and replicates.38,39
Figure 13.
Confocal microscopy imaging of (A) DAPI-stained nucleus in the blue channel, (B) Rab11, EEA1, CD63, and LAMP-2 are stained with the corresponding primary and Alexa Fluor 647 conjugate secondary antibody in the far red channel, respectively, and (C) denotes the uptake of coumarin-6-labeled LDC-NPs in differentiated THP-1 cells under the green channel. (D) Merged imaging of all channels with respective bleached pink and white coloration, signifying the colocalization of LDC-NPs in early and recycling endosomal and lysosomal compartments, respectively, at a fixed magnification scale.
The positive result from EEA1 and Rab11 colocalization encouraged us to further observe a couple of tetraspanin superfamily proteins, specifically CD63 and LAMP-2, that control different diversified cellular mechanisms and represent characteristics of the late compartments of the phagocytic route in differentiated macrophages. CD63 is well distributed in the endosome, lysosome, phagolysosomal complex, and trans-Golgi network.37 Similarly, LAMP-2 has direct recruitment in MTb-infected phagosomes to selectively fuse with lysosomal vesicles and initiate the phagolysosome biogenesis.38,39 As seen in Figure 13, colocalization of coumarin-6-tagged LDC-NPs in CD63 (Figure 13, row 3) and LAMP-2 (Figure 13, row 4) labeled vesicles confirms the presence of LDC-NPs with these intravesicular compartmental proteins, which indicate that they are well distributed to target MTb even in the phagolysosomal fusion process.
2.3.6. Quantization of Intracellular Colocalization of LDC-NPs
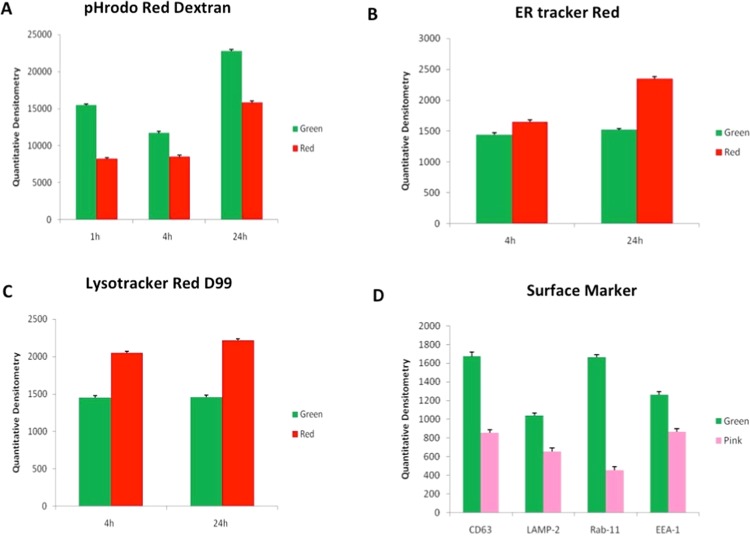
Quantitative densitometry was used to quantify the green fluorescence from uptake of coumarin-6-labeled LDC-NPs by THP-1 cells. These values were compared to fluorescence signals from pHrodo Red dextran from actin staining (Figure 14A), ER-Tracker Red staining of endosomes, LysoTracker Red D99-labeled lysosomes (Figure 14C), and fluorescently labeled antibodies against CD63, LAMP-2, Rab11, and EEA1 (Figure 14D). The results confirm the initial deposition of LDC-NPs on the cell membrane within 1 h, followed by subsequent cytosolic dispersion between, which appears to peak at 24 h (Figure 14A). Localization of the nanoparticles in the endosomal and lysosomal compartments appears to remain consistent between 4 and 24 h, even as the pH-activated fluorescence of the ER-Tracker and LysoTracker dyes increases with the progressive decrease in the intravesicular pH of the corresponding vesicles over this time interval (Figure 14B,C). Finally, significantly high values of green fluorescence with all fluorescently tagged antibodies evaluated in this study confirm the ability of this delivery system to colocate within the key intracellular compartments that the invading MTb pathogen is likely to reside in (Figure 14D).
Figure 14.
Quantitative densitometry of green fluorescence from coumarin-6-labeled LDC-NPs as compared to fluorescence signals from (A) pHrodo Red dextran, (B) ER-Tracker Red, (C) LysoTracker Red D99, and (D) antibodies against CD63, LAMP-2, Rab11, and EEA1.
3. Conclusions
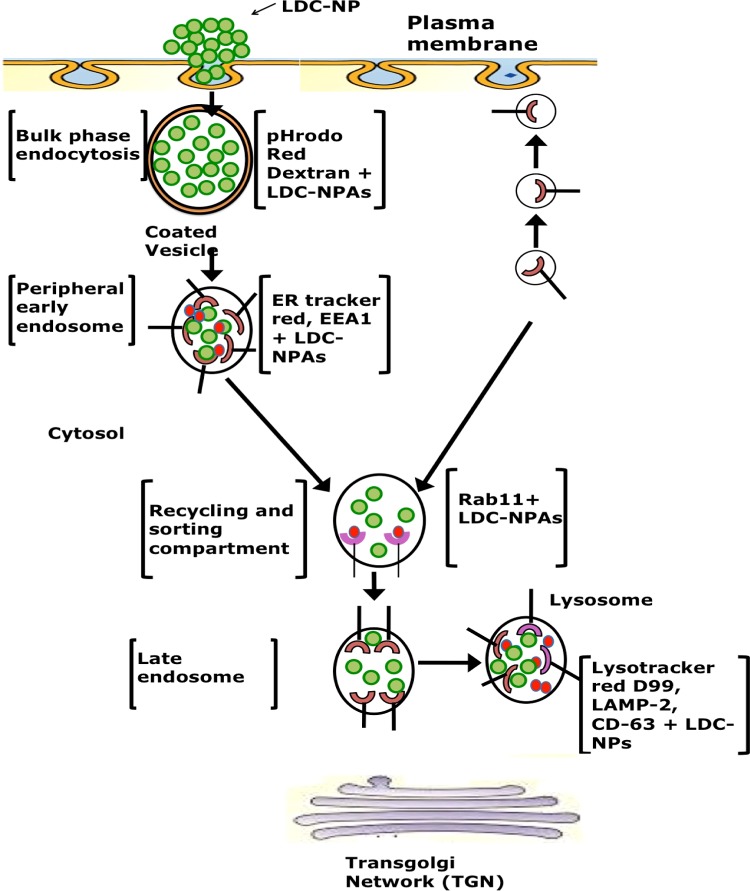
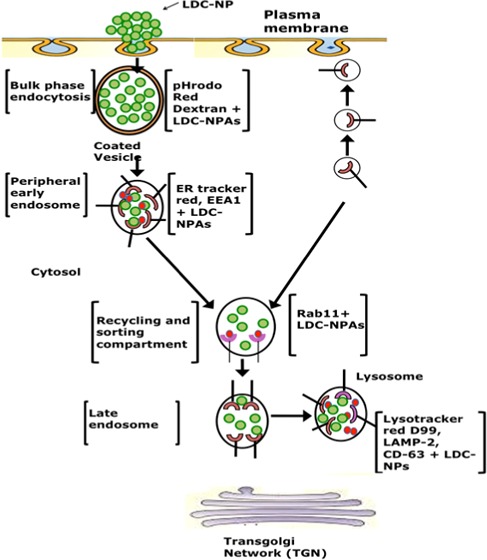
In this investigation, a novel lipid–drug conjugate of INH with SC was prepared by amide bond formation and was confirmed by TLC, NMR, ATR, and mass spectroscopy analysis. A cold high-pressure homogenization technique was employed to transform the synthesized bulk LDC into LDC-NPs, which were stabilized by aqueous surfactant mixtures. AFM and TEM images of the LDC-NPs exhibited discrete, spherical, smooth, nonaggregated, and uniformly sized particles, which agreed well with the particle size obtained from DLS measurements. Our LDC-NPs had an average particle size of 124.60 (±5.56) nm with a PDI value of 0.443 (±0.065); a ζ-potential value of −26.6 mV (±4.91) indicated that the formulation is likely to remain stable in suspension. ATR, DSC, XRD, mass spectroscopy, and fluorescence spectroscopy all confirmed the successful conjugation of the drug to the lipid moiety and revealed the integrity of formulation. In vitro drug release studies of optimized LDC-NPs showed biphasic release behavior with an initial phase of accelerated release followed by sustained release (97.97%) for 72 h; LDC-NPs obeyed the Higuchi model of drug release kinetics. These results are encouraging as the robustness of the synthesis scheme and the formulation has been validated by multiple analytical methods. Cell viability assessed by alamarBlue reduction assay indicated the safety of the LDC-NP formulation even at relatively high doses. The increased lipophilicity and the anionic surface charge of the LDC-NPs appeared to facilitate rapid uptake and uniform cytosolic distribution in THP-1 cells. In continuation of the above, confocal imaging also confirmed that the particles were progressively localized inside THP-1 macrophages. The uptake and intracellular journey of LDC-NPs were initiated through bulk-phase endocytosis by the formation of coated vesicles, as identified by pHrodo Red dextran staining (Figure 11). Further colocalization of LDC-NPs with ER-Tracker Red (Figure 12), EEA1, and Rab11 (Figure 13) indicates the continuing downstream movement of LDC-NPs in early, late, and recycling endosomes, with subsequent transport into the lysosomal and phagolysosomal complexes.
Quantification of fluorescence from these colocalized LDC-NPs (Figure 14) also indicates the stability of the LDC-NPs at a lysosomal pH and their ability to provide sustained release in these intracellular compartments over significantly longer durations. Further, colocalization of LDC-NPs with various compartmental proteins involved in MTb’s intracellular host response maturation process demonstrated their potential to facilitate drug delivery to the desired intracellular compartments inhabited by this evasive pathogen. Figure 15 partially summarizes the intracellular trafficking pathway for this novel INH delivery construct as uncovered thus far by this study. Further investigations are needed to determine the eventual intracellular fate of these LDC-NPs, including the time course of complete degradation and, most importantly, potential interaction with intracellular pathogens. Together, these promising results indicate the significant potential and justify further exploration of INH-loaded LDC-NPs for the treatment of intransigent extrapulmonary infections, such as TB meningitis, where the hydrophilicity of pure INH may pose a severe limitation in crossing the blood–brain barrier. However, broader in vivo investigations of the safety and efficacy of this new formulation are necessary before translation into clinical use.
Figure 15.
Schematic representation of the uptake and progressive distribution of LDC-NPs in various compartments of differentiated macrophages.
4. Materials and Methods
4.1. Materials
SC, INH, N,N′-dimethylacetamide (N-DMA), pyridine, Tween 80, Poloxamer-188 solution, sodium hydroxide, potassium dihydrogen orthophosphate, dialysis bags having a molecular weight cutoff (MWCO) of 12 000 Dalton, and Nile red dye were all procured from Sigma-Aldrich Chemicals, St. Louis. High-performance liquid chromatography (HPLC) grade solvents such as water, chloroform, methylene chloride, and methanol were obtained from Merck Specialties Pvt. Ltd., Mumbai, India. All chemicals and solvents were of HPLC and analytical reagent grade and were used as received. Double-distilled water was used throughout the experiment.
4.2. Synthesis of Bulk LDC
The hydrophilic drug, INH, was converted to an amphiphilic prodrug by conjugating its free amino group with a free chloride group of SC to form a stearoyl–INH LDC stabilized by an amide linkage,40−42 as per the reaction scheme given in Figure 1A. SC was used instead of stearic acid because the chloride group is considered to be a better leaving group in comparison with the hydroxyl group, and it reacts easily with the amino group of INH to form an amide bond. In this synthesis, N-DMA was used as a solvent and pyridine as a catalyst to accelerate the reaction. Briefly, SC was reacted with INH in an equimolar ratio in the presence of N-DMA and pyridine under magnetic stirring at 500 rpm at room temperature for 3–4 h. This was followed by the addition of an excess quantity of water to quench the reaction to form the bulk stearoyl–INH LDC. After quenching the reaction, the reaction mixture was filtered by vacuum filtration and thoroughly washed with water for the complete removal of N-DMA, pyridine, and unreacted reactants (INH and SC), as they are all soluble in water. Further, the obtained bulk LDC product was air-dried overnight and was stored at 4 °C until further analysis.
4.3. Characterization of Bulk LDC
4.3.1. TLC
TLC studies were carried out for the primary confirmation of the formation of the desired product after the conjugation process. This was done by spotting INH (after solubilizing it in water), LDC, and SC (solubilized in chloroform) with the help of a capillary on silica gel plates using chloroform:methanol (75:25) as a mobile phase. TLC plates were observed under UV light to confirm the completion of the conjugation reaction.43
4.3.2. ATR Analysis
Fourier transform infrared analysis of pure INH, pure SC, and the conjugated product was performed in the ATR mode on a Tensor-27 spectrophotometer (Bruker, India) scanning within an IR range of 4000–400 cm–1, as reported previously in the literature.44
4.3.3. NMR Spectroscopy
The proton NMR spectra of pure INH, pure SC, and stearoyl–INH LDC were obtained using an Ascend 400 NMR spectrometer (Bruker, India) and were used to determine the structural configuration and presence of hydrogen environment of the conjugated compounds as previously reported.45 For this purpose, pure INH was dissolved in deuterated water (D2O), pure SC in deuterated chloroform (CDCl3), and LDC in deuterated dimethyl sulfoxide (deuterated DMSO).
4.3.4. Mass Spectroscopy
Matrix-assisted lased desorption/ionization mass spectroscopy of pure INH and stearoyl–INH LDC was obtained using an AB SCIEX TOF/TOF 5800. The experiment was performed by dissolving pure INH in methanol and LDC in a mixture of chloroform and methanol to determine the exact molecular weight of the compounds by the soft ionization technique, as reported previously in the literature.46
4.3.5. Percentage Conjugation Efficiency and Percentage Yield Estimation
The percentage conjugation efficiency was determined by measuring the absorbance of unconjugated INH in aqueous washings using a UV spectrophotometer (UV-1700, Shimadzu, Japan) at 261 nm, after confirming that all other components of the reaction mixture and their byproducts did not interfere with the analysis of INH.43
The percent yield of the bulk LDC was calculated as a percentage of the total amounts of lipid and INH employed during preparation. The percentage yield of the bulk LDC was calculated using the following formula47
| 1 |
4.4. Preparation of LDC-NPs
The bulk LDC obtained in the previous step was further formulated as LDC-NPs by adopting a previously reported cold HPH technique48 and using a high-shear homogenizer (T-25 Digital Ultra-Turrax, IKA India Pvt. Ltd., India). The previously synthesized and air-dried bulk LDC was dispersed by magnetic stirring at 4 °C in an aqueous solution containing 0.5% w/v Tween 80 and 1.0% w/v Polaxomer 188 as surfactants. This cold aqueous LDC dispersion was further homogenized, using a high-shear homogenizer at 8000 rpm for 10 min, to produce LDC-NPs. The dispersion of homogenized LDC-NPs was kept at −80 °C overnight and then lyophilized in a lyophilizer (Coolsafe, Labogene, Denmark) for 48 h to obtain freeze-dried LDC-NPs. Finally, the freeze-dried LDC-NPs were stored at 4 °C until further analysis.
For in vitro characterization and future biological studies, two different dye-labeled versions of the nanoparticle formulation, namely, Nile red (0.1% w/w) and coumarin-6 (0.1%w/w)-labeled LDC-NPs, respectively, were also synthesized. For this purpose, these dyes were added (0.05%w/v) after LDCs were melted at 125 °C and homogenized further at 8000 rpm for 10 min for the production of dye-labeled LDC-NPs.
4.5. Characterization of LDC-NPs
4.5.1. Particle Size, PDI, and ζ-Potential
LDC-NPs were evaluated for mean particle size (Z-average), PDI, and ζ-potential by dynamic light scattering (DLS) using a Zetasizer (Nano ZS-90, Malvern Instruments, U.K.). Distilled water was used as a dispersion medium and a 1:99 w/v dilution of the lyophilized LDC-NPs was freshly made before analysis. The surface charge and stability of the LDC-NP systems in suspension was evaluated by ζ-potential values.
4.5.2. AFM
AFM images of LDC-NPs were recorded with an AFM microscope (Nano Wizard 3, Zeiss, Germany) to confirm the structural and topographical characteristics of these novel particles. For sample preparation, freeze-dried LDC-NPs were first dispersed in double-distilled water using bath sonication. The dispersion was spread as a thin film on the surface of a mica sheet and air-dried for 24 h under vacuum. The samples were then analyzed using a silicon nitrile probe in the tapping mode for visualizing the particles.
4.5.3. TEM
Particle morphology in terms of sphericity, aggregation, and electronic environment of the developed LDC-NPs was examined by high-resolution TEM (JEM-2100, Jeol, Japan). Samples were stained with phosphotungstic acid (PTA, 2%, 5 min and excess PTA removed), spread on a gold grid, and examined.
4.5.4. ATR
Drug–excipient interaction studies were performed by ATR analysis (Tensor-27, Bruker, Germany). Samples of pristine drugs, pure SC, bulk LDC, and LDC-NPs were all studied. The samples were subjected to spectral scanning in the wavenumber range of 4000–400 cm–1 at a resolution of 4 cm–1 and scan speed of 2 mm/sec.
4.5.5. DSC
Thermal data analyses of DSC thermograms of pristine drugs and LDC-NPs were recorded on a differential scanning calorimeter (DSC-60, Shimadzu, Japan). Samples were weighed accurately (5 mg) in aluminum pans and heated at a predefined rate of 20 °C per minute in the range of 10–350 °C. An inert nitrogen atmosphere was maintained at a flow rate of 20 mL/min.
4.5.6. XRD
XRD patterns of pristine drugs and LDC-NPs were collected using an X-ray diffractometer (Bruker AXS D8 Advance, Germany) with Cu Kα radiation generated at 40 mA and 35 kV. The diffraction angle 2θ was recorded from 1° to 40°/min with a scanning speed of 1°/min to estimate the crystallinity of the samples.
4.5.7. Molecular Environment of LDC-NPs
The lipophilic fluorescent marker, Nile red, was used as the model solute, and the molecular environment (polarity) was elucidated by fluorometric spectroscopy based on the solvatochromism of the dye. For this purpose, LDC-NPs with 1 ppm Nile red were prepared as described earlier. Emission fluorescence spectra of Nile red dye-loaded LDC-NPs were recorded with a fluorescence spectrophotometer (Hitachi F-7000 FL, Tokyo, Japan) at room temperature with both slit widths set to 5 nm. The excitation wavelength was fixed at 546 nm, and the emission spectra were recorded from 550 to 700 nm at a scanning speed of 240 nm/min.49
4.5.8. In Vitro Drug Release Study
The in vitro release of INH from LDC-NPs was determined by quantifying diffusion of the released drug through a dialysis membrane50 using an 8-station, automated dissolution test apparatus (Disso-8, Lab India, Mumbai, India). To simulate in vivo gastric conditions, the study was performed in simulated intestinal fluid (SIF, phosphate buffer, pH 7.4) as a dissolution test medium, using a dialysis membrane with a MWCO of 12 000 Da, activated by soaking in SIF for overnight. An aliquot of 100 mg of LDC-NPs was placed inside the dialysis bag, which was then clipped at both ends. The dialysis bag was fully immersed in 500 mL of dissolution test medium in one station of the dissolution test apparatus. Stirring was maintained at 100 rpm, at 37 °C (±0.2 °C) for the entire duration of the study. Sampling was done by extracting aliquots of 3 mL each at pre-set time intervals (15, 30, 45 min, 1, 2, 4, 6, 8, 12, 24, 48, and 72 h). The sample volume extracted was immediately replaced by an equal volume of fresh dissolution medium to maintain sink conditions. Aliquot samples were further treated with 0.1 N hydrochloric acid and centrifuged in 1.5 mL tubes (1.5 mL MCT) at 1000 rpm for 5 min to collect the supernatant.51 This was done to initiate acid hydrolysis of the lipid conjugate and to release the drug in the solution. This protocol simulates the degradation process due to the acid environment present in the secretory and endocytic pathways.52 This supernatant, expected to contain the drug cleaved from the released LDC molecules, was then analyzed using a UV spectrophotometer (UV 8+, Thermo Scientific Pvt. Ltd., Mumbai, India) at 262 nm. The cumulative percentage of drug released at different intervals of time was compared to a standard calibration curve of various concentrations of INH generated on the same instrument. The release of pure INH inside the dialysis membrane was also performed in the same manner, albeit without treatment of aliquots with acid.
4.5.9. Mechanism of Drug Release Kinetics
The mathematical modeling of drug release kinetics from LDC-NPs was performed by applying various known models of release kinetics to the data values obtained experimentally. The best fit of the experimental data was selected after fitting to the following equations:
| 2 |
where Qt is the amount of drug released in time t, Q0 is the initial amount of drug in the solution (most times, Q0 = 0), and k0 is the zero-order release rate.53
| 3 |
where Qt is the amount of drug released in time t, Q0 is the initial amount of drug in the solution, and k1 is the first-order release rate constant.54
| 4 |
where Qt is the amount of drug released at time t, and K is the Higuchi diffusion rate constant.55
| 5 |
4.5.10. Statistical Analysis
Graph Pad Instat Software (Graph Pad Software, version 3.05, San Diego, CA) was used for statistical analysis. All experimental data were reported as mean values with one standard deviation.
4.5.11. In Vitro Cell Culture Studies
A human monocyte cell line, THP-1, was maintained in RPMI 1640 medium supplemented with 10% fetal bovine serum and penicillin/streptomycin/gentamycin/amphotericin B. To transform the cells into macrophages, phorbol 12-myristate 13-acetate (PMA) was used at a concentration of 200 nM for differentiation. After 24 h, differentiated cells were dosed with coumarin-6-labeled LDC-NPs, and the plates were incubated in a 5% CO2 atmosphere at 37 °C for different time intervals.56,57
4.5.12. Cell Viability Assay
Toxicity of LDC-NPs in PMA-differentiated THP-1 cells was assessed using an alamarBlue (Invitrogen) reduction assay. Typically, 100 μL of cells (2 × 10⁵ cells/well) were seeded in 96-well plates with a serial dilution of LDC-NPs of 5, 25, 50, and 70 μg/mL in RPMI-1640 for a period of 24 h. After incubation with the test LDC-NP for 24 h, medium in all wells was replaced with fresh medium (100 μL) containing alamarBlue (10 μL). After 48 h following the initial addition of LDC-NPs and a further 24 h incubation in alamarBlue for more readout sensitivity, measurements of reduction of alamarBlue were taken as absorbance readings following excitation at 570 and emission at 595 nm using a microplate reader.
4.5.13. Internalization of LDC-NPs in THP-1 Cells through Confocal Microscopy
PMA-differentiated THP-1 cells were grown on 12-well plates containing poly-d-lysine-coated sterile coverslips of 12 mm diameter (Corning BioCoat). After 4 h of incubation with LDC-NPs, the cells were washed and fixed before staining cytosolic actin filaments with rhodamine phalloidin. For staining, 5 μL of the 6.6 mM methanolic stock rhodamine phalloidin solution was diluted up to 200 μL in phosphate-buffered saline (PBS) with 1% bovine serum albumin before applying to each coverslip. Cells were then incubated for 45 min in the dark, following which cells were rinsed two times with 10 mM PBS. Cell-containing coverslips were air-dried, mounted with ProLong Gold antifade reagent (Thermo Fisher Scientific) with DAPI on a one-end frosted glass slide (Corning, Germany), and their fluorescence was observed and recorded on fluorescein isothiocyanate and tetramethylrhodamine channels under a confocal microscope (FV 3000, Olympus, Germany).
4.5.14. Fluid-Phase Uptake of LDC-NP in THP-1 Cells
PMA-differentiated THP-1 cells were incubated with LDC-NPs (75 μg/mL) and 50 ng/mL of pHrodo Red dextran (Thermo Fisher Scientific) for varying time periods of 1, 4, and 24 h. Coverslips were fixed and mounted with ProLong Gold antifade reagent (Thermo Fisher Scientific) with DAPI on a one-end frosted glass slide as before, and their fluorescence was observed and recorded on a confocal microscope (FV 3000, Olympus, Germany).
4.5.15. pH-Dependent and Antibody-Mediated Intracellular Trafficking with THP-1
To study whether nanoparticles were internalized into the differentiated macrophages and simultaneously delivered into the lysosomal compartment, we seeded human differentiated macrophages on poly-l-lysine-coated coverslips and incubated the cells with coumarin-6-labeled LDC-NPs for 4 and 24 h at 37 °C in 5% CO2. To determine the uptake of coumarin-6-labeled LDC-NPs in the lysosomal compartment of differentiated macrophages, we incubated macrophages with 50 nM LysoTracker Red D99 (Molecular Probes) or ER-Tracker Red (BODIPY, Molecular Probes) and with primary antibody against CD63 (Origene, TA802751), LAMP-2 (Origene, TA336932), EEA1 (BD Bioscience, 610456), and Rab11 (ST John, STJ111613) at 37 °C for 2 h. The methodology of staining was elaborated previously.58−60
4.5.16. Quantitative Densitometry of Intracellular Trafficking with THP-1
Quantitative densitometry of LDC-NPs dosed to THP-1 was performed to correlate with fluorescence from pHrodo Red dextran, LysoTracker Red D99, ER-Tracker, and fluorescently labeled antibodies to Rab11, EEA1, CD63, and LAMP-2. Each experiment was performed in triplicate. The data are represented as mean ±SD and statistically analyzed by one-way ANOVA followed by Bonferroni multiple tests.
Acknowledgments
Jonathan Pillai gratefully acknowledges THSTI for funding this research through a faculty grant. The authors wish to express their appreciation to the faculty and student members of the Regional Center for Biotechnology and THSTI for providing access to various research instrumentation and cell culture facilities and inputs in analyzing and interpreting results. The authors are also grateful to the Sophisticated Analytical Instrumentation Facilities (SAIF), Cochin, Kerala, India, for providing XRD, TEM, and DSC facilities. Finally, the authors sincerely thank Dr. Pallavi Kshetrapal, Assistant Professor, THSTI, for her valuable advice and assistance with the cell-line study.
Author Contributions
∥ S.P. and S.R. are contributed equally to this work.
Author Contributions
The paper was written through contributions of all authors. All authors have given approval to the final version of the paper.
The authors declare no competing financial interest.
References
- Bhandari R.; Kaur I. P. Pharmacokinetics, tissue distribution and relative bioavailability of isoniazid-solid lipid nanoparticles. Int. J. Pharm. 2013, 441, 202–212. 10.1016/j.ijpharm.2012.11.042. [DOI] [PubMed] [Google Scholar]
- Mariappan T.; Singh S. Regional gastrointestinal permeability of rifampicin and isoniazid (alone and their combination) in the rat. Int. J. Tuberc. Lung Dis. 2003, 7, 797–803. [PubMed] [Google Scholar]
- Kang K.-C.; Lee C.-I.; Pyo H.-B.; Jeong N.-H. Preparation and characterization of nano-liposomes using phosphatidylcholine. J. Ind. Eng. Chem. 2005, 11, 847–851. 10.1016/j.jiec.2008.06.008. [DOI] [Google Scholar]
- Kaur I. P.; Bhandari R.; Bhandari S.; Kakkar V. Potential of solid lipid nanoparticles in brain targeting. J. Controlled Release 2008, 127, 97–109. 10.1016/j.jconrel.2007.12.018. [DOI] [PubMed] [Google Scholar]
- Lee G.-S.; Lee D.-H.; Kang K.-c.; Lee C.-I.; Pyo H.-B.; Choi T.-B. Preparation and characterization of bis-ethylhexyloxyphenolmethoxyphenyltriazine (BEMT) loaded solid lipid nano-particles (SLN). J. Ind. Eng. Chem. 2007, 13, 1180–1187. [Google Scholar]
- Schwarz C.; Mehnert W.; Lucks J.; Müller R. Solid lipid nanoparticles (SLN) for controlled drug delivery. I. Production, characterization and sterilization. J. Controlled Release 1994, 30, 83–96. 10.1016/0168-3659(94)90047-7. [DOI] [Google Scholar]
- Yang H. J.; Cho W. G.; Park S. N. Stability of oil-in-water nano-emulsions prepared using the phase inversion composition method. J. Ind. Eng. Chem. 2009, 15, 331–335. 10.1016/j.jiec.2009.01.001. [DOI] [Google Scholar]
- Hu L.; Tang X.; Cui F. Solid lipid nanoparticles (SLNs) to improve oral bioavailability of poorly soluble drugs. J. Pharm. Pharmacol. 2004, 56, 1527–1535. 10.1211/0022357044959. [DOI] [PubMed] [Google Scholar]
- Lim S.-J.; Lee M.-K.; Kim C.-K. Altered chemical and biological activities of all-trans retinoic acid incorporated in solid lipid nanoparticle powders. J. Controlled Release 2004, 100, 53–61. 10.1016/j.jconrel.2004.07.032. [DOI] [PubMed] [Google Scholar]
- Tabatt K.; Kneuer C.; Sameti M.; Olbrich C.; Müller R. H.; Lehr C.-M.; Bakowsky U. Transfection with different colloidal systems: comparison of solid lipid nanoparticles and liposomes. J. Controlled Release 2004, 97, 321–332. 10.1016/j.jconrel.2004.02.029. [DOI] [PubMed] [Google Scholar]
- Cortesi R.; Esposito E.; Luca G.; Nastruzzi C. Production of lipospheres as carriers for bioactive compounds. Biomaterials 2002, 23, 2283–2294. 10.1016/S0142-9612(01)00362-3. [DOI] [PubMed] [Google Scholar]
- Müller R.; Olbrich C.. Arzneistoffträger zur kontrollierten Wirkstoffapplikation hergestellt aus nicht-kovalenten Lipidmatrix-Arzneistoff-Konjugaten. German Patent Application, 1999, p 64.
- Attama A. A.; Momoh M. A.; Builders P. F. Lipid nanoparticulate drug delivery systems: a revolution in dosage form design and development. Recent Adv. Novel Drug Carrier Syst. 2012, 5, 107–140. [Google Scholar]
- Emeje M. O.; Obidike I. C.; Akpabio E. I.; Ofoefule S. I. Nanotechnology in drug delivery. Recent Adv. Novel Drug Carrier Syst. 2012, 69–106. [Google Scholar]
- Porter C. J.; Trevaskis N. L.; Charman W. N. Lipids and lipid-based formulations: optimizing the oral delivery of lipophilic drugs. Nat. Rev. Drug Discovery 2007, 6, 231 10.1038/nrd2197. [DOI] [PubMed] [Google Scholar]
- Lin Y.; Shen Q.; Katsumi H.; Okada N.; Fujita T.; Jiang X.; Yamamoto A. Effects of Labrasol and other pharmaceutical excipients on the intestinal transport and absorption of rhodamine123, a P-glycoprotein substrate, in rats. Biol. Pharm. Bull. 2007, 30, 1301–1307. 10.1248/bpb.30.1301. [DOI] [PubMed] [Google Scholar]
- Zhang H.; Yao M.; Morrison R. A.; Chong S. Commonly used surfactant, Tween 80, improves absorption of P-glycoprotein substrate, digoxin, in rats. Arch. Pharm. Res. 2003, 26, 768–772. 10.1007/BF02976689. [DOI] [PubMed] [Google Scholar]
- Weyhers H.; Ehlers S.; Hahn H.; Souto E.; Müller R. Solid lipid nanoparticles (SLN)–effects of lipid composition on in vitro degradation and in vivo toxicity. Die Pharm.-Int. J. Pharm. Sci. 2006, 61, 539–544. [PubMed] [Google Scholar]
- Xia T.; Kovochich M.; Liong M.; Zink J. I.; Nel A. E. Cationic polystyrene nanosphere toxicity depends on cell-specific endocytic and mitochondrial injury pathways. ACS Nano 2007, 2, 85–96. 10.1021/nn700256c. [DOI] [PubMed] [Google Scholar]
- Lunov O.; Syrovets T.; Loos C.; Beil J.; Delacher M.; Tron K.; Nienhaus G. U.; Musyanovych A.; Mailander V.; Landfester K. Differential uptake of functionalized polystyrene nanoparticles by human macrophages and a monocytic cell line. ACS Nano 2011, 5, 1657–1669. 10.1021/nn2000756. [DOI] [PubMed] [Google Scholar]
- Abrink M.; Gobl A.; Huang R.; Nilsson K.; Hellman L. Human cell lines U-937, THP-1 and Mono Mac 6 represent relatively immature cells of the monocyte-macrophage cell lineage. Leukemia 1994, 8, 1579–1584. [PubMed] [Google Scholar]
- Besra S. E.; Ray M.; Dey S.; Roy S.; Deb N. Apoptogenic activity of secretion extract of Bellamya Bengalensis f. annandalei via mitochondrial mediated caspase cascade on human leukemic cell lines. Int. J. Pharm. Sci. Rev. Res. 2013, 20, 146–152. [Google Scholar]
- Clemens D. L.; Lee B.-Y.; Xue M.; Thomas C. R.; Meng H.; Ferris D.; Nel A. E.; Zink J. I.; Horwitz M. A. Targeted intracellular delivery of antituberculosis drugs to Mycobacterium tuberculosis-infected macrophages via functionalized mesoporous silica nanoparticles. Antimicrob. Agents Chemother. 2012, 56, 2535–2545. 10.1128/AAC.06049-11. [DOI] [PMC free article] [PubMed] [Google Scholar]
- Benita S.; Levy M. Submicron emulsions as colloidal drug carriers for intravenous administration: comprehensive physicochemical characterization. J. Pharm. Sci. 1993, 82, 1069–1079. 10.1002/jps.2600821102. [DOI] [PubMed] [Google Scholar]
- Chen H.; Chang X.; Du D.; Liu W.; Liu J.; Weng T.; Yang Y.; Xu H.; Yang X. Podophyllotoxin-loaded solid lipid nanoparticles for epidermal targeting. J. Controlled Release 2006, 110, 296–306. 10.1016/j.jconrel.2005.09.052. [DOI] [PubMed] [Google Scholar]
- Vitorino C.; Carvalho F. A.; Almeida A. J.; Sousa J. J.; Pais A. A. The size of solid lipid nanoparticles: An interpretation from experimental design. Colloids Surf., B 2011, 84, 117–130. 10.1016/j.colsurfb.2010.12.024. [DOI] [PubMed] [Google Scholar]
- Nair R.; Priya K. V.; Kumar K. A.; Badivaddin T. M.; Sevukarajan M. Formulation and evaluation of solid lipid nanoparticles of water soluble drug: isoniazid. J. Pharm. Sci. 2011, 3, 1256. [Google Scholar]
- Pardeike J.; Weber S.; Haber T.; Wagner J.; Zarfl H.; Plank H.; Zimmer A. Development of an itraconazole-loaded nanostructured lipid carrier (NLC) formulation for pulmonary application. Int. J. Pharm. 2011, 419, 329–338. 10.1016/j.ijpharm.2011.07.040. [DOI] [PubMed] [Google Scholar]
- Lv H.; Zhang S.; Wang B.; Cui S.; Yan J. Toxicity of cationic lipids and cationic polymers in gene delivery. J. Controlled Release 2006, 114, 100–109. 10.1016/j.jconrel.2006.04.014. [DOI] [PubMed] [Google Scholar]
- Iwaoka S.; Nakamura T.; Takano S.; Tsuchiya S.; Aramaki Y. Cationic liposomes induce apoptosis through p38 MAP kinase–caspase-8–Bid pathway in macrophage-like RAW264. 7 cells. J. Leukocyte Biol. 2006, 79, 184–191. 10.1189/jlb.0405181. [DOI] [PubMed] [Google Scholar]
- Aramaki Y.; Takano S.; Tsuchiya S. Cationic liposomes induce macrophage apoptosis through mitochondrial pathway. Arch. Biochem. Biophys. 2001, 392, 245–250. 10.1006/abbi.2001.2458. [DOI] [PubMed] [Google Scholar]
- Arisaka M.; Nakamura T.; Yamada A.; Negishi Y.; Aramaki Y. Involvement of protein kinase Cδ in induction of apoptosis by cationic liposomes in macrophage-like RAW264. 7 cells. FEBS Lett. 2010, 584, 1016–1020. 10.1016/j.febslet.2010.01.055. [DOI] [PubMed] [Google Scholar]
- Khalil I. A.; Futaki S.; Niwa M.; Baba Y.; Kaji N.; Kamiya H.; Harashima H. Mechanism of improved gene transfer by the N-terminal stearylation of octaarginine: enhanced cellular association by hydrophobic core formation. Gene Ther. 2004, 11, 636 10.1038/sj.gt.3302128. [DOI] [PubMed] [Google Scholar]
- Hmama Z.; Sendide K.; Talal A.; Garcia R.; Dobos K.; Reiner N. E. Quantitative analysis of phagolysosome fusion in intact cells: inhibition by mycobacterial lipoarabinomannan and rescue by an 1α, 25-dihydroxyvitamin D3–phosphoinositide 3-kinase pathway. J. Cell Sci. 2004, 117, 2131–2140. 10.1242/jcs.01072. [DOI] [PubMed] [Google Scholar]
- Gillespie E. J.; Ho C.-L. C.; Balaji K.; Clemens D. L.; Deng G.; Wang Y. E.; Elsaesser H. J.; Tamilselvam B.; Gargi A.; Dixon S. D. Selective inhibitor of endosomal trafficking pathways exploited by multiple toxins and viruses. Proc. Natl. Acad. Sci. U.S.A. 2013, 110, E4904–E4912. 10.1073/pnas.1302334110. [DOI] [PMC free article] [PubMed] [Google Scholar]
- Saftig P.; Klumperman J. Lysosome biogenesis and lysosomal membrane proteins: trafficking meets function. Nat. Rev. Mol. Cell Biol. 2009, 10, 623 10.1038/nrm2745. [DOI] [PubMed] [Google Scholar]
- Fernando L. P.; Kandel P. K.; Yu J.; McNeill J.; Ackroyd P. C.; Christensen K. A. Mechanism of cellular uptake of highly fluorescent conjugated polymer nanoparticles. Biomacromolecules 2010, 11, 2675–2682. 10.1021/bm1007103. [DOI] [PMC free article] [PubMed] [Google Scholar]
- Kobayashi T.; Vischer U. M.; Rosnoblet C.; Lebrand C.; Lindsay M.; Parton R. G.; Kruithof E. K.; Gruenberg J. The tetraspanin CD63/lamp3 cycles between endocytic and secretory compartments in human endothelial cells. Mol. Biol. Cell 2000, 11, 1829–1843. 10.1091/mbc.11.5.1829. [DOI] [PMC free article] [PubMed] [Google Scholar]
- van der Wel N.; Hava D.; Houben D.; Fluitsma D.; van Zon M.; Pierson J.; Brenner M.; Peters P. J. M. tuberculosis and M. leprae translocate from the phagolysosome to the cytosol in myeloid cells. Cell 2007, 129, 1287–1298. 10.1016/j.cell.2007.05.059. [DOI] [PubMed] [Google Scholar]
- Hermanson G. T.Bioconjugate Techniques; Academic Press, 2013. [Google Scholar]
- Nakajima N.; Ikada Y. Mechanism of amide formation by carbodiimide for bioconjugation in aqueous media. Bioconjugate Chem. 1995, 6, 123–130. 10.1021/bc00031a015. [DOI] [PubMed] [Google Scholar]
- Pignatello R.; Spampinato G.; Sorrenti V.; Di Giacomo C.; Vicari L.; McGuire J. J.; Russell C. A.; Puglisi G.; Toth I. Lipophilic methotrexate conjugates with antitumor activity. Eur. J. Pharm. Sci. 2000, 10, 237–245. 10.1016/S0928-0987(00)00062-2. [DOI] [PubMed] [Google Scholar]
- Sharma P.; Dube B.; Sawant K. Synthesis of cytarabine lipid drug conjugate for treatment of meningeal leukemia: development, characterization and in vitro cell line studies. J. Biomed. Nanotechnol. 2012, 8, 928–937. 10.1166/jbn.2012.1464. [DOI] [PubMed] [Google Scholar]
- Ren S.; Yang S.; Zhao Y.; Yu T.; Xiao X. Preparation and characterization of an ultrahydrophobic surface based on a stearic acid self-assembled monolayer over polyethyleneimine thin films. Surf. Sci. 2003, 546, 64–74. 10.1016/j.susc.2003.09.018. [DOI] [Google Scholar]
- Knothe G.; Kenar J. A. Determination of the fatty acid profile by 1H-NMR spectroscopy. Eur. J. Lipid Sci. Technol. 2004, 106, 88–96. 10.1002/ejlt.200300880. [DOI] [Google Scholar]
- Thomas A. l.; Patterson N. H.; Marcinkiewicz M. M.; Lazaris A.; Metrakos P.; Chaurand P. Histology-driven data mining of lipid signatures from multiple imaging mass spectrometry analyses: application to human colorectal cancer liver metastasis biopsies. Anal. Chem. 2013, 85, 2860–2866. 10.1021/ac3034294. [DOI] [PubMed] [Google Scholar]
- Banerjee S.; Siddiqui L.; Bhattacharya S. S.; Kaity S.; Ghosh A.; Chattopadhyay P.; Pandey A.; Singh L. Interpenetrating polymer network (IPN) hydrogel microspheres for oral controlled release application. Int. J. Biol. Macromol. 2012, 50, 198–206. 10.1016/j.ijbiomac.2011.10.020. [DOI] [PubMed] [Google Scholar]
- Neupane Y. R.; Sabir M.; Ahmad N.; Ali M.; Kohli K. Lipid drug conjugate nanoparticle as a novel lipid nanocarrier for the oral delivery of decitabine: ex vivo gut permeation studies. Nanotechnology 2013, 24, 415102 10.1088/0957-4484/24/41/415102. [DOI] [PubMed] [Google Scholar]
- Huang Z. R.; Hua S. C.; Yang Y. L.; Fang J. Y. Development and evaluation of lipid nanoparticles for camptothecin delivery: a comparison of solid lipid nanoparticles, nanostructured lipid carriers, and lipid emulsion. Acta Pharmacol. Sin. 2008, 29, 1094–1102. 10.1111/j.1745-7254.2008.00829.x. [DOI] [PubMed] [Google Scholar]
- Banerjee S.; Kundu A. Lipid-drug conjugates: a potential nanocarrier system for oral drug delivery applications. DARU, J. Pharm. Sci. 2018, 26, 65–75. 10.1007/s40199-018-0209-1. [DOI] [PMC free article] [PubMed] [Google Scholar]
- Liu S.-Q.; Wiradharma N.; Gao S.-J.; Tong Y. W.; Yang Y.-Y. Bio-functional micelles self-assembled from a folate-conjugated block copolymer for targeted intracellular delivery of anticancer drugs. Biomaterials 2007, 28, 1423–1433. 10.1016/j.biomaterials.2006.11.013. [DOI] [PubMed] [Google Scholar]
- Paroutis P.; Touret N.; Grinstein S. The pH of the secretory pathway: measurement, determinants, and regulation. Physiology 2004, 19, 207–215. 10.1152/physiol.00005.2004. [DOI] [PubMed] [Google Scholar]
- Wyatt D. Taking poorly water soluble compounds through discovery. Bull. Tech. 1999, 31–39. [Google Scholar]
- Bhattacharya S. S.; Banerjee S. Design, Development, and Delivery of Salbutamol Sulfate from an Adhesive Matrix System. J. Adhes. 2016, 92, 147–169. 10.1080/00218464.2015.1005837. [DOI] [Google Scholar]
- Higuchi T. Rate of release of medicaments from ointment bases containing drugs in suspension. J. Pharm. Sci. 1961, 50, 874–875. 10.1002/jps.2600501018. [DOI] [PubMed] [Google Scholar]
- Chakraborty J.; Roy S.; Murab S.; Ravani R.; Kaur K.; Devi S.; Singh D.; Sharma S.; Mohanty S.; Dinda A. K. Modulation of macrophage phenotype, maturation, and graft integration through chondroitin sulfate cross-linking to decellularized cornea. ACS Biomater. Sci. Eng. 2018, 5, 165–179. 10.1021/acsbiomaterials.8b00251. [DOI] [PubMed] [Google Scholar]
- Dey S.; Roy S.; Deb N.; Sen K. K.; Besra S. E. Anti-carcinogenic activity of Ruellia tuberosa L.(Acanthaceae) leaf extract on hepatoma cell line & increased superoxide dismutase activity on macrophage cell lysate. Int. J. Pharm. Pharm. Sci. 2013, 5, 854–861. [Google Scholar]
- Banerjee S.; Roy S.; Nath Bhaumik K.; Kshetrapal P.; Pillai J. Comparative study of oral lipid nanoparticle formulations (LNFs) for chemical stabilization of antitubercular drugs: physicochemical and cellular evaluation. Artif. Cells, Nanomed., Biotechnol. 2018, 46, 540–558. 10.1080/21691401.2018.1431648. [DOI] [PubMed] [Google Scholar]
- Banerjee S.; Roy S.. Polysaccharide Installed Lipid Nanoparticles in Targeted Antituberculosis Drug Delivery Applications. In Polysaccharide Carriers for Drug Delivery; Elsevier, 2019; pp 397–411. [Google Scholar]
- Banerjee S.; Roy S.; Bhaumik K. N.; Pillai J. Mechanisms of the effectiveness of lipid nanoparticle formulations loaded with anti-tubercular drugs combinations toward overcoming drug bioavailability in tuberculosis. J. Drug Targeting 2020, 28, 55–69. 10.1080/1061186X.2019.1613409. [DOI] [PubMed] [Google Scholar]


