

Abstract
Objective
To determine the prevalence of diabetic retinopathy (DR) and diabetic macular oedema (DME) and their associated risk factors in patients recently diagnosed with type 2 diabetes.
Methods and analysis
We carried out a cross-sectional study from April 2014 to August 2017. We included patients aged ≥18 years. Diabetes was defined as fasting plasma glucose of >7.8 mmol/L or 2-hour postload plasma glucose of >11.1 mmol/L. Non-mydriatic fundus examination with a digital-fundus camera was performed. Three images centred in the macula, optic disc and temporal to the macula were obtained and graded according to the Scottish Scale Classification of Diabetic Retinopathy.
Results
1232 patients (mean age 51.5 years) with a diabetes duration of 0–5 years were examined. Age-adjusted and sex-adjusted prevalence of DR and DME was 17.4% (95% CI 15.3% to 19.6%) and 6.6% (95% CI 5.4% to 8.2%), respectively. DR was associated with diabetes duration (OR per year=1.20, p<0.001), haemoglobin A1c (HbA1c) from 7.0 to 8.9 (OR=2.19, p<0.001), HbA1c≥9 (OR=2.98, p<0.001) and systolic blood pressure (SBP) (OR=1.16 per 5 mm Hg, p<0.001). DME was associated with diabetes duration (OR per year=1.26, p<0.01), HbA1c from 7.0 to 8.9 (OR=2.26, p<0.05), HbA1c≥9 (OR=2.38, p<0.01), SBP (OR per mm Hg=1.15, p<0.001) and albuminuria (OR=2.45, p<0.01).
Conclusion
Our study contributes to the evidence of progressive increase in DR and DME risk in early stages of diabetes, supporting the urgent need for early screening.
Keywords: macula, retina, epidemiology
Key messages.
What is already known about this subject?
Available evidence shows a high prevalence of diabetic retinopathy (DR) and diabetic macular oedema (DME) in patients with recent diagnosis.
What are the new findings?
This study demonstrates a constant increment on the prevalence of DR from 0 to 5 years of diabetes duration, whereas for DME, the increment was more evident from 0 to 3 years of diabetes duration.
How might these results change the focus of research or clinical practice?
In subjects with recent diagnosis of diabetes and without incapacitant complications due to this condition, haemoglobin A1c, albuminuria and hypertension constitute key factors in the development of DR and DME. Strategies to optimise the metabolic control in these group are required to prevent or delay retinal complications opportunely.
Introduction
Diabetes is an increasingly prevalent global health problem. Worldwide nearly 8.8% of adults (ie, 412 million people) have diabetes.1 Mexico is among the countries most affected by the diabetes epidemic, with a prevalence of type 2 diabetes of 9.4% in 2016.2 Estimations show that the prevalence of diabetes roughly doubles every decade. Projected rates on three age-specific incidence scenarios suggest that diabetes prevalence among adults older than 20 years may reach 13.7%–22.5% by 2050, thus affecting 15–25 million individuals, with a lifetime risk of one in three to one in two.3 As in other low-income countries, in Mexico, for each person with known diabetes diagnosis there is about one person who has the disease but does not know it; then there is a wide time interval between the onset of type 2 diabetes and its detection, which in turn increases the likelihood of diabetes complications, such as DR.
Diabetic retinopathy (DR) is one of the most common and severe microvascular complications of diabetes and the leading cause of irreversible blindness. The estimated global prevalence of DR is 34.6%4; however, according to estimations, it will develop in more than 75% of persons within 15–20 years of diagnosis of diabetes. The prevalence of DR is expected to increase, and the number of people at risk of vision loss is predicted to double by the year 2030, along with the increasing rate of the diabetes epidemic. In Mexico, the prevalence of DR varies between 38.9%5 and 60.1%6; yet, none of the national studies have focused on DR and diabetic macular oedema (DME) prevalence in recently diagnosed type 2 diabetes.
Several studies support the evidence that diabetes duration, haemoglobin A1c (HbA1c) and blood pressure are the key factors in the development of DR; nevertheless, keeping normal glycaemic levels does not guarantee that the disease will stop progressing.4 7–9 Thus, additional factors may potentially have a causal role. Recent evidence supports the idea that non-traditional lipid measures are stronger risk markers of DR than total cholesterol (TC) and triglyceride (TG) levels.10 Others systemic risk factors for DR include diabetic nephropathy, obesity, anaemia, and markers of systemic inflammation and endothelial dysfunction. Ocular risk factors for DR include previous cataract surgery, which is associated with the progression of DR and the development of DME, and myopic refractive error, which appears to be protective.11 12 In terms of genetic factors, heritability estimates of 25%–50% have been reported in patients with type 1 diabetes who have proliferative DR, and epigenetic mechanisms may play a role in this pathogenesis.13
While DME can occur independently of DR, it appears to be strongly associated with the severity of DR. Systemic risk factors for DME are hyperglycaemia, diabetes duration, hypertension and dyslipidaemia. Genetic factors have also been implicated and many candidate genes have been proposed.13 14 In this study, we aimed to estimate the prevalence of DR and DME and their associated risk factors in patients recently diagnosed with type 2 diabetes.
Methods
Study population
Individuals were enrolled at a comprehensive care centre for patients with diabetes (Centro de Atención Integral del Paciente con Diabetes) from April 2014 to August 2017. Details about the implementation and operation of this diabetes care centre have been published elsewhere.15 Briefly, inclusion criteria are diagnosis of type 2 diabetes within the past 5 years and ages 18–70 years. Exclusion criteria are cognitive impairment, presence of chronic kidney disease, coronary heart disease, stroke, foot ulcers or amputations, psychiatric disorders, current smoking, drug or alcohol abuse, and immediate surgical treatment that limits moderate physical activity. Elimination criteria are pregnancy and morbidities requiring hospitalisation.
Data collection
All participants underwent a standardised examination. Data on age, history of diabetes and hypertension, anthropometric parameters, diet and physical activity were obtained through a standardised questionnaire. Anthropometric measurements were taken with each subject wearing light clothing and no shoes. Body mass index (BMI) was calculated as weight (kg) divided by squared height (m). Waist circumference (WC) was measured at the level of the umbilicus (cm). Systolic blood pressure (SBP) and diastolic blood pressure (DBP) were measured three times while participants were seated, and the average of the last two measurements was used. Type 2 diabetes was defined as fasting plasma glucose of ≥7.0 mmol/L or 2-hour postload plasma glucose of ≥11.1 mmol/L or previous diagnosis by a health professional.16 Diabetes duration was defined as years from diagnosis at the time the patient was included in the study. For analytical purposes, duration was further stratified into <1 year, 1–2 years and 3–5 years. Hypertension was defined as SBP of ≥140 mm Hg or DBP of ≥90 mm Hg or taking antihypertensive medication.17 Visual acuity was defined according to the following pinhole-corrected visual acuity thresholds: normal vision of <0.26 LogMAR (Snellen scale score of <20/40), mild impairment of <0.26 to<0.44 (Snellen scale score of ≥20/40 to <20/60), severe impairment of ≥0.44 to<0.96 (Snellen scale score of ≥20/60 to <20/200) and blindness of ≥0.96 (Snellen scale score of ≥20/200).18 Blood samples were collected after an overnight fast of 8–12 hours for the determination of plasma glucose, HbA1c, TC, TG, high-density lipoprotein cholesterol and low-density lipoprotein cholesterol, and creatinine concentrations. Urine albumin-to-creatinine ratio (ACR) was determined and microalbuminuria (ACR >30–300 mg/g) and macroalbuminuria ACR >300 mg/g) were defined. All analyses were performed at the Central Laboratory at the National Institute of Medical Sciences and Nutrition, Salvador Zubiran, in Mexico City, Mexico.
Assessment of retinopathy and macular oedema
All cases with DR and DME were evaluated by a retina specialist. Examination included visual acuity, non-mydriatic photographs and biomicroscopic examination to assess the macula. Visual capacity was measured with a digital screen using a LogMAR chart, and anterior segment examination was carried out with an SL-D2 Topcon (Tokyo, Japan) slit lamp. Non-mydriatic photographs were taken with a digital retinal (DRS) non-mydriatic camera (Centervue, Padova, Italy), and three 45° images centred in the macula, optic disc and temporal to the macula, respectively, were obtained. If the quality of photographs was not appropriate, a pharmacological dilation with one drop of tropicamide 0.8% and phenylephrine 5% was performed.
Grading of retinal photographs
Two standardised readers graded the retinal photographs. Previously, a subset of photographs of 60 eyes (by duplicate) was assessed for intraobserver and interobserver variations, obtaining a kappa of 0.88. The photographs were evaluated in a masked manner to minimise any possible classification bias. The final diagnosis for each patient was determined from the grading of the worse eye. The minimum criterion for the diagnosis of DR was the presence of at least one definite microaneurysm in any field photographed. DR was classified according to the Scottish Diabetic Retinopathy Grading Scale as follows: R0 (no visible retinopathy), R1 (mild retinopathy), R2 (observable background retinopathy), R3 (referable background retinopathy), R4 (proliferative retinopathy) and R6 (inadequately assessed retinopathy). DME was classified as M0 (no maculopathy), M1 (observable maculopathy), M2 (referable maculopathy) and M6 (inadequately assessed maculopathy) according to the same grading scale.19 20
Patient and public involvement
Patients were not involved in the design, recruitment or conduction of the study.
Statistical analysis
Comparisons of different risk factors between persons with and without DR and with and without DME were performed using χ2 for categorical variables, Student’s t-test for mean (with SDs), comparison of rank-sum Wilcoxon’s tests for medians (with IQRs) and comparison for continuous variables, when appropriate. The main variables included in the analysis were age at diagnosis of diabetes (as continuous and dichotomous (<40 and ≥40 years) variables), diabetes duration (as continuous and ordinal (<1, from 1 to 2 and ≥3 years) variables), HbA1c (as continuous and ordinal (<7%, 7%–8.9% and ≥9%) variables), BMI (as a continuous variable), WC (as continuous and dichotomous (men≥102, women≥88 and men<102, women<88) variables), SBP and DBP (as continuous variables), albuminuria (as categorical (normal, microalbuminuria and macroalbuminuria) and dichotomous (normal and albuminuria) variables), visual capacity in the better eye (as nominal (normal, moderate visual impairment, severe visual impairment and blindness) variable), and hypoglycaemic and antihypertensive medications. Unadjusted, stratified, and age-adjusted and sex-adjusted prevalences of DR and DME and their 95% CIs) were estimated by logistic regression analysis. To compare the differences on prevalence, χ2 and χ2 for trend were used when appropriate. The associated risk factors for DR and DME were examined by multiple robust logistic regression analysis, calculating ORs and their 95% CIs. Models with the whole sample and stratified by diabetes duration were done. The model fits were tested by Hosmer-Lemeshow goodness of fit. The evaluation of outliers and influence statistics was also performed. All analyses were performed using STATA/MP V.15.1.
Results
Description of the study population
Of 1232 patients included in this study, 544 (44.2%) were men (mean age 51.5 years, SD 10) with a median duration of diabetes of 1 year (range 0–5). DR occurred in at least one eye in 17.3% (n=213) and DME in 6.7% (n=82) of patients, whereas bilateral DR was observed in 54.5% (116/213) and bilateral DME in 50.0% (41/82) of patients. Comparison of patients with and without DR showed that the proportion of hypertension and albuminuria was significantly higher among those with DR than among those without. Patients with DR also had longer diabetes duration and higher HbA1c compared with patients without DR (table 1). As for patients with DME, they had longer diabetes durations (median 3 (IQR 1–4) vs 1 (IQR 0–3) years, respectively), had more hypertension (45.1% vs 34.9%, respectively) and had more albuminuria (38.3% vs 14.4%, respectively) compared with patients without DME. Individuals with DME also had higher HbA1c between 7% and 8.9% (31.7% vs 25.6%, respectively) and HbA1c of ≥9% (50.0% vs 34.3%, respectively) than persons without DME.
Table 1.
Comparison of clinical and metabolic variables in subjects with recently diagnosed type 2 diabetes by retinopathy
| DR n=213, n (%) |
No DR n=1019, n (%) |
P value* | |
| Age at recruitment (years), mean (SD) | 50.9 (9.2) | 51.6 (10.2) | 0.343 |
| Age at diabetes diagnosis (years), mean (SD) | 48.7 (9.1) | 50.0 (10.2) | 0.069 |
| Sex (men) | 120 (56.3) | 424 (41.6) | <0.001 |
| Diabetes duration (years)† | 2 (0–4) | 1 (0–3) | 0.0001 |
| Diabetes duration (years) | |||
| <1 | 62 (29.1) | 408 (40.0) | <0.001 |
| 1–2 | 47 (22.1) | 306 (30.0) | |
| 3–5 | 104 (48.8) | 305 (29.9) | |
| Hypertension‡ | 95 (44.6) | 343 (33.7) | 0.002 |
| SBP (mm Hg) | 133.1 (16.5) | 126.2 (15.3) | <0.0001 |
| DBP (mm Hg) | 80.8 (7.8) | 77.9 (7.7) | <0.0001 |
| BMI (kg/m2), media (SD) | 29.2 (4.7) | 29.5 (4.9) | 0.276 |
| WC (cm)† | |||
| Men | 98.9 (89.8–106.0) | 100.0 (92.6–109.0) | 0.031 |
| Women | 99.0 (91.2–108.0) | 96.5 (89.0–104.4) | 0.0001 |
| Daily intake total calories (kcal) | 1568.0 (1347.0–1885.0) | 1532.5 (1266.0–1842.0) | 0.136 |
| HbA1c (%)† | 9.0 (7.2–11.1) | 7.4 (6.3–10.1) | 0.0001 |
| HbA1c (mmol/mol)† | 74.9 (55.2–97.8) | 57.4 (45.4–86.9) | 0.0001 |
| HbA1c (%) | |||
| <7 | 44 (20.7) | 433 (42.5) | <0.001 |
| 7.0–8.9 | 62 (29.1) | 258 (25.3) | |
| ≥9 | 107 (50.2) | 328 (32.2) | |
| Fasting plasma glucose (mmol/L)† | 9.2 (6.8–13.2) | 7.0 (5.8–9.8) | 0.0001 |
| Triglycerides (mmol/L)† | 2.1 (1.5–3.2) | 2.0 (1.4–2.8) | 0.074 |
| Total cholesterol (mmol/L)† | 5.0 (4.3–5.7) | 4.9 (4.2–5.6) | 0.352 |
| LDL-C (mmol/L)† | 3.1 (2.4–3.6) | 2.9 (2.4–3.5) | 0.395 |
| HDL-C (mmol/L)† | |||
| Men | 2.8 (2.2–3.4) | 2.8 (2.2–3.3) | 0.301 |
| Women | 3.3 (2.7–3.9) | 3.1 (2.5–3.7) | 0.858 |
| Albuminuria | |||
| Normal | 155 (74.2) | 856 (86.0) | <0.001 |
| Microalbuminuria | 43 (20.7) | 121 (12.2) | |
| Macroalbuminuria | 10 (4.8) | 18 (1.8) | |
| Hypoglycaemic medication | |||
| None | 37 (17.4) | 159 (15.6) | 0.324 |
| Oral drugs | 169 (79.3) | 841 (82.5) | |
| Insulin with or without oral drugs | 7 (3.3) | 19 (1.9) | |
| Antihypertensive medication§ | 53 (55.8) | 239 (69.7) | 0.011 |
| Statins use | 21 (9.9) | 151 (14.8) | 0.058 |
| Fibrate use | 22 (10.3) | 107 (10.5) | 0.941 |
| Visual capacity in the better eye | |||
| Normal | 184 (86.4) | 861 (84.5) | 0.634 |
| Mild impairment | 23 (10.8) | 120 (11.8) | |
| Severe impairment | 6 (2.8) | 31 (3.0) | |
| Blindness | 0 (0.0) | 7 (0.7) | |
Missing values: BMI, 1; WC, 5; LDL-C, 2; total calorie intake, 27; albuminuria, 29.
*Pearson’s χ2 or Fisher’s test was used when appropriate. Student’s t-test or Kruskal-Wallis test was used when appropriate.
†Median and 25 and 75 percentiles were calculated.
‡From 438 patients with hypertension, 327 (74.7%) were uncontrolled.
§Only for hypertensive subjects.
BMI, body mass index; DBP, diastolic blood pressure; DR, diabetic retinopathy; HbA1c, haemoglobin A1c; HDL-C, high-density lipoprotein cholesterol; LDL-C, low-density lipoprotein cholesterol; SBP, systolic blood pressure; WC, waist circumference.
Prevalence of DR and macular oedema
Prevalence of both DR and DME increased per each year of diabetes duration (figure 1). The prevalence of DR increased significantly with HbA1c level: 9.2% (95% CI 6.9% to 12.2%) for HbA1c<7%, 19.4% (95% CI 15.4% to 24.1%) for HbA1c 7%–8.9% and 24.6% (95% CI 20.8% to 28.9%) for HbA1c≥9% (ptrend<0.001). After stratification by diabetes duration, the prevalence of DR was greater in the presence of higher levels of HbA1c, hypertension and albuminuria (table 2).
Figure 1.
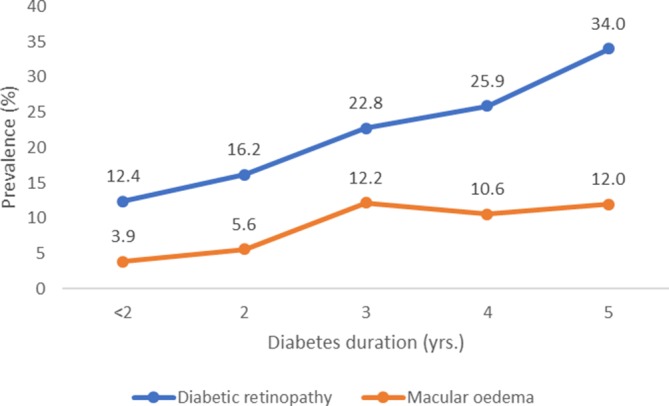
Prevalence of diabetic retinopathy and diabetic macular oedema per year after diabetes diagnosis.
Table 2.
Prevalence of DR and ME by several risk factors in subjects with recently diagnosed type 2 diabetes
| DR n=213 |
ME n=1019 |
|||
| Cases | Prevalence (95% CI) |
Cases | Prevalence (95% CI) |
|
| Grading of DR | ||||
| Mild | 170 | 13.8 (12.0 to 15.8) | – | – |
| Moderate | 30 | 2.4 (1.7 to 3.5) | – | – |
| Severe | 9 | 0.7 (0.4 to 1.4) | – | – |
| Proliferative | 4 | 0.3 (0.1 to 0.9) | – | – |
| Any type of DR | 213 | 17.3 (15.3 to 19.5) | – | – |
| Grading of ME | ||||
| Observable (M1) | – | – | 12 | 1.0 (0.6 to 1.7) |
| Referable (M2) | – | – | 70 | 5.7 (4.5 to 7.2) |
| Any type of ME | – | – | 82 | 6.7 (5.4 to 8.2) |
| DR without ME | 131 | 10.6 (9.0 to 12.5) | – | – |
| Combined DR+ME | 82 | 6.7 (5.4 to 8.2) | – | – |
| Diabetes duration (years) | ||||
| <1 | 62 | 13.9 (10.4 to 16.6) | 17 | 3.6 (2.3 to 5.7) |
| 1–2 | 47 | 13.3 (10.2 to 17.3) | 18 | 5.1 (3.2 to 7.9) |
| 3–5 | 104 | 25.4 (21.4 to 29.9) | 47 | 11.5 (8.7 to 15.0) |
| Ptrend value | <0.001 | <0.001 | ||
| HbA1c (%) | ||||
| <7 | 44 | 9.2 (6.9 to 12.2) | 15 | 3.1 (1.9 to 5.2) |
| 7.0–8.9 | 62 | 19.4 (15.4 to 24.1) | 26 | 8.1 (5.6 to 11.7) |
| ≥9 | 107 | 24.6 (20.8 to 28.9) | 41 | 9.4 (7.0 to 12.6) |
| Ptrend value | <0.001 | <0.001 | ||
| Hypertension | ||||
| No | 118 | 14.9 (12.6 to 17.5) | 45 | 5.7 (4.3 to 7.5) |
| Yes | 95 | 21.7 (18.1 to 25.8) | 37 | 8.4 (6.2 to 11.4) |
| P value | 0.003 | 0.063 | ||
| Albuminuria | ||||
| No | 155 | 15.3 (13.2 to 17.7) | 50 | 4.9 (3.8 to 6.5) |
| Yes | 53 | 27.6 (21.7 to 34.3) | 31 | 16.1 (11.6 to 22.0) |
| P value | <0.001 | <0.001 | ||
| Waist circumference (men≥102, women≥88) | ||||
| No | 76 | 14.3 (11.6 to 17.6) | 32 | 6.0 (5.5 to 8.4) |
| Yes | 137 | 19.7 (16.9 to 22.8) | 50 | 7.2 (5.5 to 9.4) |
| P value | 0.014 | 0.422 | ||
| Diabetes duration and HbA1c (%) | ||||
| Diabetes duration <1 year | ||||
| <7 | 18 | 9.1 (5.8 to 14.0) | 5 | – |
| 7.0–8.9 | 17 | 14.7 (9.3 to 22.3) | 7 | – |
| ≥9 | 27 | 17.2 (12.1 to 23.9) | 5 | – |
| Ptrend value | 0.026 | – | ||
| Diabetes duration 1–2 years | ||||
| <7 | 15 | 8.9 (5.5 to 14.3) | 7 | – |
| 7.0–8.9 | 17 | 19.3 (12.4 to 28.9) | 7 | – |
| ≥9 | 15 | 15.5 (9.5 to 24.1) | 4 | – |
| Ptrend value | 0.081 | – | ||
| Diabetes duration 3–5 years | ||||
| <7 | 11 | 9.8 (5.5 to 16.9) | 3 | 2.7 (0.9 to 8.0) |
| 7.0–8.9 | 28 | 24.1 (17.2 to 32.7) | 12 | 10.3 (6.0 to 17.3) |
| ≥9 | 65 | 35.9 (29.3 to 43.2) | 32 | 17.7 (12.8 to 23.9) |
| Ptrend value | <0.001 | <0.001 | ||
| Diabetes duration and hypertension (%) | ||||
| Diabetes duration <1 year | ||||
| No | 40 | 12.5 (9.3 to 16.6) | 11 | 3.4 (1.9 to 6.1) |
| Yes | 22 | 14.6 (9.8 to 21.1) | 6 | 4.0 (1.8 to 8.6) |
| P value | 0.544 | 0.776 | ||
| Diabetes duration 1–2 years | ||||
| No | 28 | 11.6 (8.1 to 16.2) | 11 | 4.5 (2.5 to 8.0) |
| Yes | 19 | 17.1 (11.2 to 25.3) | 7 | 6.3 (3.1 to 12.6) |
| P value | 0.157 | 0.487 | ||
| Diabetes duration 3–5 years | ||||
| No | 50 | 21.5 (16.7 to 27.2) | 23 | 9.9 (6.6 to 14.4) |
| Yes | 54 | 30.7 (24.3 to 38.9) | 24 | 13.6 (9.3 to 19.5) |
| P value | 0.035 | 0.239 | ||
| Diabetes duration and albuminuria (%) | ||||
| Diabetes duration <1 year | ||||
| Non-albuminuria | 53 | 13.1 (10.1 to 16.7) | 12 | 3.0 (1.7 to 5.1) |
| Albuminuria | 9 | 16.4 (8.7 to 28.6) | 5 | 9.1 (3.8 to 20.0) |
| P value | 0.505 | 0.032 | ||
| Diabetes duration 1–2 years | ||||
| Non-albuminuria | 32 | 11.3 (8.1 to 15.6) | 10 | 3.5 (1.9 to 6.5) |
| Albuminuria | 15 | 23.4 (14.7 to 35.3) | 8 | 12.5 (6.4 to 23.1) |
| P value | 0.013 | 0.006 | ||
| Diabetes duration 3–5 years | ||||
| Non-albuminuria | 70 | 21.6 (17.5 to 26.4) | 28 | 8.6 (6.0 to 12.2) |
| Albuminuria | 29 | 39.7 (29.2 to 51.3) | 18 | 24.7 (16.1 to 35.8) |
| P value | 0.001 | <0.001 | ||
| Age-adjusted and sex-adjusted | 213 | 17.4 (15.3 to 19.6) | 82 | 6.6 (5.4 to 8.2) |
Prevalence and its 95% CI were estimated by logistic regression models. DR: unilateral in 97 cases, bilateral in 116 cases. Diabetic macular oedema: unilateral in 41 cases, bilateral in 41 cases.
Missing values: albuminuria, 29.
DR, diabetic retinopathy; HbA1c, haemoglobin A1c; ME, macular oedema.
With respect to DME, the prevalence increased with level of HbA1c: 3.1% (95% CI 1.9% to 5.2%) for HbA1c<7%, 8.1% (95% CI 5.6% to 11.7%) for HbA1c 7%–8.9%, and 9.4% (95% CI 7.0% to 12.6%) for HbA1c≥9% (ptrend<0.001). Prevalence was also higher in persons with albuminuria. After stratification by diabetes duration, the prevalence of DME was higher in the presence of albuminuria for all categories of diabetes duration (table 2).
Risk factors associated with diabetic retinopathy and macular oedema
In multiple logistic regression, the probability of DR increased 20% per each year of diabetes duration (95% CI 1.10% to 1.32%) and was higher in patients with HbA1c of 7.0%–8.9% (OR=2.19, 95% CI 1.43% to 3.35%) and in those with HbA1c of ≥9% (OR=2.98, 95% CI 2.01% to 4.42%) compared with patients with HbA1c of <7%. The probability of DR in persons with higher SBPs increased significantly (OR per 5 mm Hg=1.16, 95% CI 1.10 to 1.22) after adjustment for age at the time of diabetes diagnosis, sex and use of antihypertensive medication. In stratified analysis by diabetes duration, the magnitude of association between DR and HbA1c categories was stronger in patients with a duration of 3–5 years (OR for HbA1c 7%–8.9%=3.37, 95% CI 1.52% to 7.50% and OR for HbA1c≥9%=6.22, 95% CI 2.96% to 13.09%) compared with patients with a duration <3 years (OR=6.75, 95%IC 2.98–15.30). The association was similar with SBP in both strata (table 3).
Table 3.
Risk factors associated with the prevalence of diabetic retinopathy in subjects with recently diagnosed type 2 diabetes stratified by diabetes duration
| Whole sample | Stratified by duration of diabetes | |||
| <1–2 years | 3–5 years | |||
| Unadjusted OR (95% CI) |
Adjusted OR (95% CI) |
Adjusted OR (95% CI) |
Adjusted OR (95% CI) |
|
| Age at diabetes diagnosis (per 5 years) | 0.93 (0.88 to 0.99) * | 0.93 (0.85 to 1.00) | 0.89 (0.82 to 0.98) * | 1.00 (0.86 to 1.16) |
| Sex (men) | 1.81 (1.34 to 2.44) *** | 1.81 (1.33 to 2.46) *** | 1.80 (1.18 to 2.73) ** | 1.83 (1.14 to 2.95) * |
| Duration of diabetes (per year) | 1.27 (1.16 to 1.40) *** | 1.20 (1.10 to 1.32) *** | – | – |
| Duration of diabetes (years) | ||||
| <1 | Reference | – | – | – |
| 1–2 | 1.01 (0.67 to 1.52) | – | – | – |
| 3–5 | 2.24 (1.58 to 3.18) *** | – | – | – |
| HbA1c (mmol/mol) | 1.15 (1.09 to 1.21) *** | – | – | – |
| HbA1c (%) | ||||
| <7 | Reference | Reference | Reference | Reference |
| 7.0–8.9 | 2.17 (1.33 to 3.53)** | 2.19 (1.43 to 3.35)*** | 1.86 (1.11 to 3.12)* | 3.37 (1.52 to 7.50)** |
| ≥9 | 3.07 (2.13 to 4.42)*** | 2.98 (2.01 to 4.42)*** | 1.94 (1.18 to 3.19)** | 6.22 (2.96 to 13.09)*** |
| Hypertension | 1.59 (1.18 to 2.14)** | – | – | – |
| SBP (per 5 mm Hg) | 1.14 (1.09 to 1.19) *** | 1.16 (1.10 to 1.22) *** | 1.13 (1.06 to 1.21) *** | 1.21 (1.11 to 1.32) *** |
| DPB (per 5 mm Hg) | 1.28 (1.16 to 1.40) *** | – | ||
| Triglycerides≥1.68 mmol/L | 1.25 (0.91 to 1.71) | – | – | – |
| Albuminuria | 2.11 (1.47 to 3.02) *** | – | – | – |
| Antihypertensive drugs | 1.08 (0.77 to 1.52) | 0.95 (0.64 to 1.41) | 1.03 (0.60 to 1.77) | 0.85 (0.47 to 1.55) |
| Statin use | 1.21 (0.70 to 2.11) | – | – | – |
Simple and multiple robust logistic regression analysis was used to estimate ORs and their 95% CIs.
Whole sample, n=1232; subsample with diabetes duration of <1–2 years, n=823; and subsample with a diabetes duration from 3 to 5 years, n=409. Missing values: albuminuria, 29.
*P<0.05, **P<0.01, ***P<0.001.
DBP, diastolic blood pressure; HbA1c, haemoglobin A1c; SBP, systolic blood pressure.
As for DME, the probability of this condition increased with diabetes duration (OR=1.26, 95% CI 1.10 to 1.45) and was higher in patients with HbA1c of 7%–8.9% (OR=2.26, 95% CI 1.15% to 4.41%) and in those with HbA1c of ≥9% (OR=2.38, 95% CI 1.25% to 4.50%) compared with patients with HbA1c of <7%. The probability of DME was higher in individuals with higher SBP (OR per 5 mm Hg=1.15, 95% CI 1.07 to 1.23) and in those with albuminuria (OR=2.45, 95% CI 1.46 to 4.09) after adjustment for age at the time of diabetes diagnosis and use of antihypertensive drugs. In the stratified analysis by diabetes duration, the association between DME and HbA1c categories, SBP and albuminuria remained significant in both strata (table 4).
Table 4.
Risk factors associated with prevalence of diabetic macular oedema in patients with recently diagnosed type 2 diabetes stratified by diabetes duration
| Whole sample | Stratified by duration of diabetes | |||
| Unadjusted OR (95% CI) |
Adjusted OR (95% CI) |
<1–2 years | 3–5 years | |
| Adjusted OR (95% CI) |
Adjusted OR (95% CI) |
|||
| Age at diabetes diagnosis (per 5 years) | 1.02 (0.92 to 1.12) | 1.00 (0.88 to 1.13) | 0.92 (0.82 to 1.03) | 1.10 (0.88 to 1.38) |
| Sex (men) | 1.59 (1.01 to 2.49) * | – | – | – |
| Duration of diabetes (per year) | 1.36 (1.19 to 1.55) *** | 1.26 (1.10 to 1.45) ** | – | – |
| Duration of diabetes (years) | ||||
| <1 | Reference | – | – | – |
| 1–2 | 1.43 (0.73 to 2.82) | – | – | – |
| 3–5 | 3.46 (1.95 to 6.13) *** | – | – | – |
| HbA1c (mmol/mol) | 1.16 (1.08 to 1.25) *** | – | – | – |
| HbA1c (%) | – | |||
| <7 | Reference | Reference | Reference | Reference |
| 7.0–8.9 | 2.36 (1.10 to 5.05) * | 2.26 (1.15 to 4.41) * | 1.33 (0.64 to 2.76) | 6.36 (1.88 to 21.56) ** |
| ≥9 | 3.21 (1.79 to 5.77) *** | 2.38 (1.25 to 4.50) ** | ||
| Hypertension | 1.54 (0.98 to 2.41) | – | – | – |
| SBP (per 5 mm Hg) | 1.18 (1.11 to 1.25) *** | 1.15 (1.07 to 1.23) *** | 1.11 (1.01 to 1.22) * | 1.18 (1.06 to 1.31) ** |
| DPB (per 5 mm Hg) | 1.19 (1.05 to 1.35) ** | – | – | – |
| Triglycerides≥1.68 mmol/L | 1.06 (0.66 to 1.69) | – | – | |
| Microalbuminuria | 3.70 (2.29 to 5.97) *** | 2.45 (1.46 to 4.09) ** | 2.95 (1.41 to 6.19) ** | 2.09 (1.04 to 4.21) * |
| Antihypertensive drugs | 1.04 (0.62 to 1.76) | 0.76 (0.43 to 1.36) | – | – |
| Statin use | 0.38 (0.15 to 0.96) * | – | – | – |
Simple and multiple robust logistic regression analysis was used to estimate ORs and their 95% CIs. In models stratified by diabetes duration, HbA1c categories were <7 and ≥7.
Whole sample, n=1203; subsample with diabetes duration <1–2 years, n=806; and subsample with a diabetes duration from 3 to 5 years, n=397. Missing values: microalbuminuria, 29.
*P<0.05, **P<0.01, ***P<0.001.
DBP, diastolic blood pressure; HbA1c, haemoglobin A1c; SBP, systolic blood pressure.
Finally, in a model comparing the magnitude of the association of the same risk factors mentioned previously with DR alone and DR with concomitant DME, similar results for HbA1c of 7%–8.9% (OR=1.96, 95% CI 1.17% to 3.27% and OR=2.65, 95% CI 1.35% to 5.19%, respectively) and HbA1c of ≥9% (OR=2.75, 95% CI 1.72% to 4.40% and OR=3.46, 95% CI 1.86% to 6.44%, respectively) were observed.
Discussion
In this paper, we describe the prevalence of DR and DME in patients with recent diagnosis of diabetes, specifically a highly selected group of individuals with time since diagnosis of 5 years or less and no chronic microvascular and macrovascular complications, among other inclusion criteria. Because of the comprehensive ophthalmological approach (fundus photography and clinical examination by an expert grader), a highly accurate and detailed diagnosis was made in comparison with the conventional screening programme that include only non-mydriatic fundus photography.20
We found that 17.3% of patients had some degree of DR; this percentage is similar to that reported by Lee and Sum,21 who described an 18.2% prevalence in patients from Hong Kong with a recent (≤1 year) diabetes diagnosis. However, in that population, nine dilated images of each eye were taken; with this approach, more retinal area was examined, and thus, retinal findings in the periphery of the retina, not detected in our study, may account for a higher DR prevalence in that study. In other paper, Yau et al4 described a prevalence of 21.1% in patients with diabetes diagnosis shorter than 10 years in a population including patients from the USA, Australia, Europe and Asia. This prevalence agrees with the prevalence reported in our study; nevertheless, a specific analysis of patients with diagnosis shorter than 5 years was not performed.
The global prevalence of chronic diseases is increasing and seriously threatening low-income countries' ability to improve the health of their populations. The increase of lifestyle-related chronic diseases in these countries is the result of a complex combination of social, economic and behavioural factors. In addition, with limited resources and less awareness about chronic diseases, diagnosis of diabetes is often made late, so there is a long time span between onset of diabetes and detection of complications, which accounts for the high rate of DR an DME observed in our study.22 Genetic factors may also play a role, as Mexican individuals have been shown to have greater prevalence of RD compared with non-Hispanics, particularly in studies conducted in the USA.
The prevalence of DME in our study was 6.7%, ranging between 3.9% in persons at <1 year and 12.0% in those at 5 years from diabetes diagnosis. This subgroup is important because it highlights the fact that even with an early diagnosis, the risk of visual impairment in subsequent stages of life does not disappear. In this population, an early detection may prompt both the clinical team and the patient to improve the metabolic control and thus reduce the probability of further microvascular damage to the retina that might lead to visual loss. In 2014, Pezzullo et al23 estimated an overall prevalence of DR in Mexico was 3.3% (2 681 562 individuals), of whom 0.1% were blind.
DME is the most important cause of visual impairment in persons with diabetes, and this fact is particularly relevant in our population for the healthcare system, as the access and cost of treatment is substantial. The direct costs of DR treatment were calculated at over 120 million dollars and the indirect costs, at nearly 30 million, most of which are attributable to informal care. Published data on DME prevalence in early diabetes show some variation. Yau et al4 reported a 3.2% prevalence of DME in patients with diabetes diagnosis shorter than 10 years, whereas Martinell et al reported a 11% prevalence in a group of Swedish patients at the time of diagnosis.24 As for our study, differences with other populations could be partially accounted by genetic predisposition to DME and higher risk of proliferative DR in Hispanics, particularly of Mexican ancestry.25
In general, risk factors for DR can be broadly divided into modifiable and non-modifiable factors. Some modifiable risk factors are hyperglycaemia, hypertension, hyperlipidaemia and obesity, whereas duration of diabetes, sex, ethnicity, puberty and pregnancy are non-modifiable risk factors.26 DME shares many risk factors with DR; nevertheless, there are some differences. DME is more common in people with type 2 diabetes than in those with type 1 diabetes27; also, diabetes duration may not be as strongly associated, and so is the case for puberty and pregnancy.28
Among the risk factors associated with DR and DME in our study, diabetes duration, HbA1c and albuminuria were observed.29 Hyperglycaemia is the key modifiable risk factor for DR and DME. Hyperglycaemia results in the accumulation of advanced glycation end products and free oxygen radicals, which activate the inflammatory pathways involved.30 A longer duration of diabetes increases the amount of time the retina is exposed to hyperglycaemia-induced damage.31 After stratification by diabetes duration, those with 3–5 years from diagnosis had about a twofold probability of having DR by high levels of HbA1c compared with those with <3 years. Several studies have consistently shown that hyperglycaemia is the main risk factor for DR and DME in both type 1 and type 2 diabetes.8 32–36 Additionally, higher HbA1c has been associated with both incidence and progression of DR over a 4-year follow-up in patients with type 2 diabetes, including proliferative DR.37 Other studies have stressed that tight glycaemic control may be effective in preventing or delaying the onset of DR, but rapid reductions in HbA1c should be avoided because of the adverse effects of hypoglycaemia.38 Early intensive glycaemic control can reduce the risk of DME by almost half, and the effect is long lasting, thus underscoring the importance of early and effective intervention. However, the reduction in risk of DME was less than that for progression to proliferative DR and decreased with time. This may occur most likely because the pathophysiology of proliferative DR is related to ischaemia, and hyperglycaemia might have stronger epigenetic effects on ischaemic-related pathways.39
Regarding hypertension and SBP, they were steadily associated with both DR and DME, and the association for SBP was slightly higher in those with longer diabetes duration. Hypertension leads to additional damage to retinal vessels by hyperperfusion, shearing forces and increased oedema formation.40 Several clinical trials have shown the effectiveness of blood pressure control in the reduction on the risk of DR in both type 1 and type 2 diabetes. Specifically, in the UK Prospective Diabetes Study (UKPDS),41 patients with type 2 diabetes who were subjected to strict blood pressure control reduced their risk of DR up to 34%. Other clinical trials as the EURODIAB (European Diabetes Centres Study) 42 and DIRECT (Diabetes Remission Clinical Trial) obtained as well a significant reduction on the progression of DR (50% and 18%, respectively).43
As for albuminuria, it was strongly associated with DME in those with either shorter or longer diabetes duration. There is evidence about the increased prevalence of proliferative DR with presence of microalbuminuria or macroalbuminuria compared with normoalbuminuria in patients with type 1 diabetes.44 Other studies have shown that DR is related to urine albumin excretion and lower glomerular filtration rate in patients with type 2 diabetes even after adjustment for diabetes duration.45
Our study has some limitations. It was performed in an outpatient hospital-based population, so results are not representative of other clinical settings. Also, there was a selection bias due to the strict inclusion criteria, which precluded patients with microvascular complications from joining the comprehensive care programme; the probability of DR or DME may be even greater in persons recently diagnosed with diabetes. These facts highlight the urgent need to implement cost-efficient screening strategies to increase coverage of eye examination in people with type 2 diabetes and the necessity to construct an adequate infrastructure for prompt referral and treatment of these individuals who may otherwise suffer lifelong disability. In addition, using the worse eye in terms of retinopathy severity to assign a diagnosis for an individual patient may represent another limitation. However, doing so provides an estimate of the prevalence of the disease severity in this particular set of patients, whereas doing the opposite may underestimate it.
In summary, knowledge of prevalence of DR and DME and of their associated risk factors in recently diagnosed persons may contribute to developing more cost-effective diabetic eye disease screening programmes. Interventions in persons with recent diabetes diagnosis are fundamental, particularly in countries like Mexico, where the prevalence of diabetes is increasing. Large efforts are needed to prevent the visual impairment and blindness secondary to DR and DME, which in turn could reduce health expenditure costs, increase the efficiency of existing infrastructure and human resources, and finally improve the clinical care and quality of life of patients with diabetes.
Acknowledgments
The authors thank the National Institute of Medical Sciences and Nutrition, Salvador Zubiran, and the Institute of Ophthalmology Conde de Valenciana in Mexico for their technical assistance and administrative support, and are indebted to all persons who agreed to participate in the study.
Footnotes
Presented at: Part of this study was presented as an oral presentation at the 2016 World Ophthalmology Meeting, 5–9 February 2016, Guadalajara, Mexico.
Contributors: EOG-H and AJ-C designed the study, researched the data, conducted the data analysis and wrote the manuscript. DR-D-L-P researched the data, reviewed and edited the manuscript and contributed to the discussion. CAA-S, SH-J and DK-S reviewed the manuscript and contributed to the discussion. AJ-C is the guarantor of this work and, as such, had full access to all the data in the study and takes responsibility for the integrity of the data and the accuracy of the data analysis.
Funding: This study was supported by the National Institute of Medical Sciences and Nutrition, Salvador Zubiran, by the Institute of Ophthalmology Conde de Valenciana in México City, México, and by the Fondo Sectorial de Investigación en Salud y Seguridad Social SS/IMSS/ISSSTE-CONACYT, National Council of Science and Technology from Mexico (grant FOSISS-SALUD-2014-01-234409).
Competing interests: None declared.
Patient consent for publication: Not required.
Ethics approval: The institutional review boards of research, ethics, and biosecurity from the National Institute of Medical Sciences and Nutrition, Salvador Zubiran, and the Institute of Ophthalmology Conde de Valenciana approved the study protocol. All participants signed written informed consent.
Provenance and peer review: Not commissioned; externally peer reviewed.
References
- 1.International Diabetes Federation IDF diabetes atlas. 8th edn Brussels, Belgium: International Diabetes Federation. Brussels, Belgium, 2017: 1–147. [Google Scholar]
- 2.Rojas-Martínez R, Basto-Abreu A, Aguilar-Salinas CA, et al. [Prevalence of previously diagnosed diabetes mellitus in Mexico.]. Salud Publica Mex 2018;60:224–32. 10.21149/8566 [DOI] [PubMed] [Google Scholar]
- 3.Meza R, Barrientos-Gutierrez T, Rojas-Martinez R, et al. Burden of type 2 diabetes in Mexico: past, current and future prevalence and incidence rates. Prev Med 2015;81:445–50. 10.1016/j.ypmed.2015.10.015 [DOI] [PMC free article] [PubMed] [Google Scholar]
- 4.Yau JWY, Rogers SL, Kawasaki R, et al. Global prevalence and major risk factors of diabetic retinopathy. Diabetes Care 2012;35:556–64. 10.2337/dc11-1909 [DOI] [PMC free article] [PubMed] [Google Scholar]
- 5.Polack S, Yorston D, López-Ramos A, et al. Rapid assessment of avoidable blindness and diabetic retinopathy in Chiapas, Mexico. Ophthalmology 2012;119:1033–40. 10.1016/j.ophtha.2011.11.002 [DOI] [PubMed] [Google Scholar]
- 6.Lima-Gómez V, Blanco-Hernández DMR, Muñoz-Ibarra P, et al. Severity distribution of diabetic macular edema at the time of diagnosis. Cir Cir 2011;79:491–7. [PubMed] [Google Scholar]
- 7.Tapp RJ, Shaw JE, Harper CA, et al. The prevalence of and factors associated with diabetic retinopathy in the Australian population. Diabetes Care 2003;26:1731–7. 10.2337/diacare.26.6.1731 [DOI] [PubMed] [Google Scholar]
- 8.Wong TY, Cheung N, Tay WT, et al. Prevalence and risk factors for diabetic retinopathy: the Singapore Malay eye study. Ophthalmology 2008;115:1869–75. 10.1016/j.ophtha.2008.05.014 [DOI] [PubMed] [Google Scholar]
- 9.Magliah SF, Bardisi W, Al Attah M, et al. The prevalence and risk factors of diabetic retinopathy in selected primary care centers during the 3-year screening intervals. J Family Med Prim Care 2018;7:975–81. 10.4103/jfmpc.jfmpc_85_18 [DOI] [PMC free article] [PubMed] [Google Scholar]
- 10.Sasongko MB, Wong TY, Nguyen TT, et al. Serum apolipoprotein AI and B are stronger biomarkers of diabetic retinopathy than traditional lipids. Diabetes Care 2011;34:474–9. 10.2337/dc10-0793 [DOI] [PMC free article] [PubMed] [Google Scholar]
- 11.Squirrell D, Bhola R, Bush J. A prospective, case controlled study of the natural history of diabetic retinopathy and maculopathy after uncomplicated phacoemulsification cataract surgery in patients with type 2 diabetes. Br J Ophthalmol 2002;86:565–71. 10.1136/bjo.86.5.565 [DOI] [PMC free article] [PubMed] [Google Scholar]
- 12.Lim LS, Lamoureux E, Saw SM, et al. Are myopic eyes less likely to have diabetic retinopathy? Ophthalmology 2010;117:524–30. 10.1016/j.ophtha.2009.07.044 [DOI] [PubMed] [Google Scholar]
- 13.Wong TY, Cheung CMG, Larsen M, et al. Diabetic retinopathy. Nat Rev Dis Primers 2016;2:16012 10.1038/nrdp.2016.12 [DOI] [PubMed] [Google Scholar]
- 14.Keech AC, Mitchell P, Summanen PA, et al. Effect of fenofibrate on the need for laser treatment for diabetic retinopathy (field study): a randomised controlled trial. Lancet 2007;370:1687–97. 10.1016/S0140-6736(07)61607-9 [DOI] [PubMed] [Google Scholar]
- 15.Hernandez-Jimenez S, Garcia-Ulloa C, Mehta R, et al. Innovative models for the Empowerment of patients with type 2 diabetes: the CAIPaDi program. Recent Pat Endocr Metab Immune Drug Discov 2014;8:202–9. 10.2174/1872214808999141110155515 [DOI] [PubMed] [Google Scholar]
- 16.Expert Committee on the Diagnosis and Classification of Diabetes Mellitus Report of the expert Committee on the diagnosis and classification of diabetes mellitus. Diabetes Care 2003;26 Suppl 1:5–20. 10.2337/diacare.26.2007.s5 [DOI] [PubMed] [Google Scholar]
- 17.Chobanian AV, Bakris GL, Black HR, et al. The seventh report of the joint National Committee on prevention, detection, evaluation, and treatment of high blood pressure: the JNC 7 report. JAMA 2003;289:2560–72. 10.1001/jama.289.19.2560 [DOI] [PubMed] [Google Scholar]
- 18.Dandona L, Dandona R. Revision of visual impairment definitions in the International statistical classification of diseases. BMC Med 2006;4:1–7. 10.1186/1741-7015-4-7 [DOI] [PMC free article] [PubMed] [Google Scholar]
- 19.National Health Service (NHS) Scottish diabetic retinopathy screening collaborative. Available: http://www.ndrs-wp.scot.nhs.uk/
- 20.National Health Service (NHS) The NHS diabetic eye screening programme revised grading definitions, 2012. Available: http://www.diabeticeye.screening.nhs.uk/gradingcriteria
- 21.Lee KMC, Sum WMR. Prevalence of diabetic retinopathy in patients with recently diagnosed diabetes mellitus. Clin Exp Optom 2011;94:371–5. 10.1111/j.1444-0938.2010.00574.x [DOI] [PubMed] [Google Scholar]
- 22.Nugent R. Chronic diseases in developing countries: health and economic burdens. Ann N Y Acad Sci 2008;1136:70–9. 10.1196/annals.1425.027 [DOI] [PubMed] [Google Scholar]
- 23.Pezzullo L, Cheung S, Tay-Teo K, et al. El costo económico Y carga de las Enfermedades oculares Y de la ceguera evitable en México. Rev Mex Oftalmol 2014;88:2–30. [Google Scholar]
- 24.Martinell M, Dorkhan M, Stålhammar J, et al. Prevalence and risk factors for diabetic retinopathy at diagnosis (DRAD) in patients recently diagnosed with type 2 diabetes (T2D) or latent autoimmune diabetes in the adult (LADA). J Diabetes Complications 2016;30:1456–61. 10.1016/j.jdiacomp.2016.08.009 [DOI] [PubMed] [Google Scholar]
- 25.Chen JL, Luviano DM, Chen JC, et al. Comparison of diabetic retinopathy phenotype between Latinos and blacks. J Diabetes Complications 2009;23:371–5. 10.1016/j.jdiacomp.2008.05.001 [DOI] [PubMed] [Google Scholar]
- 26.Ting DSW, Cheung GCM, Wong TY. Diabetic retinopathy: global prevalence, major risk factors, screening practices and public health challenges: a review. Clin Experiment Ophthalmol 2016;44:260–77. 10.1111/ceo.12696 [DOI] [PubMed] [Google Scholar]
- 27.Klein R, Klein BE, Moss SE, et al. The Wisconsin epidemiologic study of diabetic retinopathy. XV. The long-term incidence of macular edema. Ophthalmology 1995;102:7–16. 10.1016/s0161-6420(95)31052-4 [DOI] [PubMed] [Google Scholar]
- 28.Klein R, Knudtson MD, Lee KE, et al. The Wisconsin epidemiologic study of diabetic retinopathy XXIII: the twenty-five-year incidence of macular edema in persons with type 1 diabetes. Ophthalmology 2009;116:497–503. 10.1016/j.ophtha.2008.10.016 [DOI] [PMC free article] [PubMed] [Google Scholar]
- 29.Antonetti DA, Barber AJ, Bronson SK, et al. Diabetic retinopathy: seeing beyond glucose-induced microvascular disease. Diabetes 2006;55:2401–11. 10.2337/db05-1635 [DOI] [PubMed] [Google Scholar]
- 30.Behl T, Kaur I, Kotwani A. Implication of oxidative stress in progression of diabetic retinopathy. Surv Ophthalmol 2016;61:187–96. 10.1016/j.survophthal.2015.06.001 [DOI] [PubMed] [Google Scholar]
- 31.Klein R, Klein BE, Moss SE, et al. The Wisconsin epidemiologic study of diabetic retinopathy. III. prevalence and risk of diabetic retinopathy when age at diagnosis is 30 or more years. Arch Ophthalmol 1984;102:527–32. 10.1001/archopht.1984.01040030405011 [DOI] [PubMed] [Google Scholar]
- 32.Klein R, Klein BE, Moss SE, et al. The Wisconsin epidemiologic study of diabetic retinopathy: XVII. The 14-year incidence and progression of diabetic retinopathy and associated risk factors in type 1 diabetes. Ophthalmology 1998;105:1801–15. 10.1016/S0161-6420(98)91020-X [DOI] [PubMed] [Google Scholar]
- 33.Jin P, Peng J, Zou H, et al. The 5-year onset and regression of diabetic retinopathy in Chinese type 2 diabetes patients. PLoS One 2014;9:e113359 10.1371/journal.pone.0113359 [DOI] [PMC free article] [PubMed] [Google Scholar]
- 34.Pradeepa R, Anjana RM, Unnikrishnan R, et al. Risk factors for microvascular complications of diabetes among South Indian subjects with type 2 Diabetes—The Chennai urban rural epidemiology study (cures) eye Study-5. Diabetes Technol Ther 2010;12:755–61. 10.1089/dia.2010.0069 [DOI] [PubMed] [Google Scholar]
- 35.Tam VHK, Lam EPK, Chu BCY, et al. Incidence and progression of diabetic retinopathy in Hong Kong Chinese with type 2 diabetes mellitus. J Diabetes Complications 2009;23:185–93. 10.1016/j.jdiacomp.2008.03.001 [DOI] [PubMed] [Google Scholar]
- 36.Cheng YJ, Gregg EW, Geiss LS, et al. Association of A1c and fasting plasma glucose levels with diabetic retinopathy prevalence in the U.S. population: implications for diabetes diagnostic thresholds. Diabetes Care 2009;32:2027–32. 10.2337/dc09-0440 [DOI] [PMC free article] [PubMed] [Google Scholar]
- 37.Harris Nwanyanwu K, Talwar N, Gardner TW, et al. Predicting development of proliferative diabetic retinopathy. Diabetes Care 2013;36:1562–8. 10.2337/dc12-0790 [DOI] [PMC free article] [PubMed] [Google Scholar]
- 38.Shurter A, Genter P, Ouyang D, et al. Euglycemic progression: worsening of diabetic retinopathy in poorly controlled type 2 diabetes in minorities. Diabetes Res Clin Pract 2013;100:362–7. 10.1016/j.diabres.2013.03.018 [DOI] [PMC free article] [PubMed] [Google Scholar]
- 39.Tan GS, Cheung N, Simó R, et al. Diabetic macular oedema. Lancet Diabetes Endocrinol 2017;5:143–55. 10.1016/S2213-8587(16)30052-3 [DOI] [PubMed] [Google Scholar]
- 40.Guan K, Hudson C, Wong T, et al. Retinal hemodynamics in early diabetic macular edema. Diabetes 2006;55:813–8. 10.2337/diabetes.55.03.06.db05-0937 [DOI] [PubMed] [Google Scholar]
- 41.Matthews DR, Stratton IM, Aldington SJ, et al. Risks of progression of retinopathy and vision loss related to tight blood pressure control in type 2 diabetes mellitus: UKPDS 69. Arch Ophthalmol 2004;122:1631–40. 10.1001/archopht.122.11.1631 [DOI] [PubMed] [Google Scholar]
- 42.Chaturvedi N, Sjolie AK, Stephenson JM, et al. Effect of lisinopril on progression of retinopathy in normotensive people with type 1 diabetes. The EUCLID Study Group. EURODIAB controlled trial of lisinopril in insulin-dependent diabetes mellitus. Lancet 1998;351:28–31. 10.1016/s0140-6736(97)06209-0 [DOI] [PubMed] [Google Scholar]
- 43.Chaturvedi N, Porta M, Klein R, et al. Effect of candesartan on prevention (DIRECT-Prevent 1) and progression (DIRECT-Protect 1) of retinopathy in type 1 diabetes: randomised, placebo-controlled trials. The Lancet 2008;372:1394–402. 10.1016/S0140-6736(08)61412-9 [DOI] [PubMed] [Google Scholar]
- 44.Parving H-H, Hommel E, Mathiesen E, et al. Prevalence of microalbuminuria, arterial hypertension, retinopathy, and neuropathy in patients with insulin dependent diabetes. BMJ 1988;296:156–60. 10.1136/bmj.296.6616.156 [DOI] [PMC free article] [PubMed] [Google Scholar]
- 45.Trevisan R, Vedovato M, Mazzon C, et al. Concomitance of diabetic retinopathy and proteinuria accelerates the rate of decline of kidney function in type 2 diabetic patients. Diabetes Care 2002;25:2026–31. 10.2337/diacare.25.11.2026 [DOI] [PubMed] [Google Scholar]