

Abstract

Two-dimensional paper networks (2DPNs) have enabled the use of paper-based platforms to perform multistep immunoassays for detection of pathogenic diseases at the point-of-care. To date, however, detection has required the user to provide multiple signal enhancement solutions and been limited to protein targets. We solve these challenges by using mathematical equations to guide the device design of a novel 2DPN, which leverages multiple fluidic inputs to apply fully dried solutions of hydrogen peroxide, diaminobenzidine, and horseradish peroxidase signal enhancement reagents to enhance the limit-of-detection of numerous nucleic acid products. Upon rehydration in our unique 2DPN design, the dried signal enhancement solution reduces the limit-of-detection (LOD) of the device to 5 × 10¹¹ nucleic acid copies/mL without increasing false positive detection. Our easy-to-use device retains activity after 28 days of dry storage and produces reliable signal enhancement 40 min after sample application. The fully integrated device demonstrated versatility in its ability to detect double-stranded and single-stranded DNA samples, as well as peptide nucleic acids.
Introduction
While plate-based enzyme-linked immunosorbent assays (ELISAs) or polymerase chain reaction (PCR) is still the gold standard to detect viral pathogens,1−3 paper-based point-of-care (POC) diagnostics have revolutionized global health care by improving access and efficiency of these otherwise complex laboratory assays. Lateral flow immunoassays (LFIAs), which are single-channel microfluidic paper devices that detect a pathogen antigen or host antibody response, have miniaturized, automated, and simplified much of the diagnostic process necessary for bacterial and viral pathogen detection.4 The low-cost, long-term stability, and ease-of-use of LFIAs make them advantageous in low-resource settings.5,6 However, LFIAs have limited sensitivity and POC accessibility due to the inability to easily perform signal enhancement via multistep assays. This is because the one-dimensional flow from a single sample pad in LFIAs dictates that the user manually pipettes each fluid sequentially at precisely timed intervals. The need to perform more complex reactions has given rise to two-dimensional paper networks (2DPNs), which typically consist of more than one fluidic input and multiple carefully designed channels to control fluid flow in the paper-based device.5,6 2DPNs have shown potential for conducting multistep assays in the paper, such as amplifying nucleic acids,7 detecting more than one target of interest,8 or enhancing the visual signal at the detection zone compared to LFIA alone.9
Previous works have set a promising precedent by using 2DPNs as a platform to perform ELISAs for protein detection. By tagging nucleic acid (NA) amplicons with proteins, ELISAs have been translated for detection of NA samples for improved signal clarity as well.5,7,10 Recent developments in chemical ligation assays resulting in enzyme-free NA amplification and CRISPR-based diagnostics have created exciting new molecular platforms for rapid pathogenic detection at low-temperatures and have the potential for improved sensitivities at the POC. However, many of these processes, including template-assisted rapid assay (TARA), produce low product yields (102 amplicons of the initial target concentration) when compared to loop-mediated isothermal amplification (LAMP) or PCR (109 amplicons).11,12 To improve this, we have integrated an ELISA into a 2DPN to provide secondary signal enhancement in the detection zone. This enables us to maintain a high sensitivity for these low-yield samples.
The design of a fully integrated 2DPN ELISA requires optimization of the reagent delivery to improve performance and produce reliable signal enhancement.13 Existing 2DPN devices are categorized by the location of fluidic inputs: the “leg” design, where reagent pads are placed at the far end of the leg, which then extends and intersects with the main lateral flow body (typically at a 90° angle),14 or the “linear” design, where the reagent pads are placed directly on the main lateral flow body.5 Previous 2DPN ELISAs required as many as five to six fluid inputs with one or more wet reagents that had to be prepared fresh.5,10 By analyzing these linear and leg designs and performing mathematical modeling of capillary flow through various nitrocellulose channel widths, we designed a device that utilizes a combination of the leg and linear design, as well as a unique delay valve, to sequentially deliver reagents to the detection zone for a fully automated 2DPN ELISA. This enabled us to incorporate the enzymatic signal amplification more effectively in our sequential flow, reduce the number and volume of washes, and allow the user to add only a single rehydrating buffer rather than storing and mixing refrigerated reagents in the field.
Here, we present the development and integration of several innovations that improve reagent flow and 2DPN usability, as well as expand 2DPN applicability to detect nucleic acid amplification products. Our device (Figure 1) builds upon the previous literature to incorporate fully dried ELISA reagents: horseradish peroxidase (HRP)-conjugated antibody label, its colorimetric substrate diaminobenzidine (DAB), and redox activator hydrogen peroxide (H2O2), which are all hydrated by the application of a single solution: phosphate-buffered saline with 0.05% Tween 20 (PBST). We utilize the high affinity of streptavidin–biotin binding, protein conjugation to gold nanoparticles (AuNPs), and ELISA-based signal enhancement to optimize the signal output. By using AuNPs that are conjugated with both streptavidin and HRP and incorporating all reagents as dried source pads, we reduced the number of fluidic inputs to four (one sample and three sites of buffer addition), in comparison to six used in current paper-based ELISAs.15 Our device demonstrates a limit-of-detection (LOD) of 5 × 10¹¹ NA copies/mL, which is comparable to other RNA-based assays quantified in one-dimensional LFIAs with an enhancement solution.16 Our platform can detect single-stranded DNA (ssDNA), double-stranded DNA (dsDNA), and peptide nucleic acid (PNA) samples at or above this concentration. This platform is currently intended for use with amplified NA samples tagged with carboxyfluorescein (FAM) and biotin and can be used to detect any amplification product with these tags.
Figure 1.

(A) Schematic of fully assembled 2DPN and location of dried reagent pads. (B) Target binding: fresh nucleic acid samples with fluorescein isothiocyanate (FITC) and biotin tags applied to the dried SA–HRP–AuNP pad. Nucleic acid binding to SA–HRP–AuNPs occurs, followed by capture at the test line in the main lateral flow channel. Unbound AuNPs bind to the biotin-tagged control line. Signal enhancement: DAB and hydrogen peroxide solution flows from the signal enhancement leg to the main lateral flow channel and is oxidized by AuNP-bound poly-HRP at test and control lines, producing a visually darkened (enhanced) signal.
Results and Discussion
Flow Parameter Change with Nitrocellulose Geometry
In hollow glass capillary channels, as studied in Berthier’s capillary flow resistors,17 the surface tension is primarily indicative of the physical properties of the fluid, and the cohesion describes fluid interaction with the surrounding glass. Nitrocellulose, however, is a porous membrane. As such, the environment surrounding the fluid varies greatly and can change depending on the geometry of the channel.
Our one-dimensional flow testing results (Table S3) demonstrate that in nitrocellulose legs with very small widths, as the width of the channel decreases, the apparent surface tension of a solution containing DAB or AuNPs in nitrocellulose decreases. This is indicated by a channel width-dependent change in the k parameter (defined in Computational Methods) for a given fluid. For example, AuNP flow testing showed a decreasing trend of k = 230.3, k = 126.1, and k = 75.2 for 5, 2, and 1 mm, respectively. A similar trend was seen in DAB flow testing results, which had k values of 326.4, 137.2, and 52.76 for the 5, 2, and 1 mm channels, respectively.
As the width of the nitrocellulose channel decreases, a reduction in the surface tension is observed. This indicates a reduction in capillary pressure, and therefore a decrease in fluid velocity in the channel. While these results contradict findings from Berthier, they do agree with Dharmaraja et al.’s work, which discusses the decreasing channel width as a method to increase “resistance” of flow on wetted nitrocellulose when the sequential flow is occurring.18 This more closely matches our reagent delivery in the constructed 2DPN. The R2 values for thinner channels (<5 mm) (Table S3) indicate flow that is less consistent than in wider channels. This inconsistency was particularly prevalent in the first 15 mm of the channels.
Optimizing 2DPN Flow
We made design choices based on the results of our component characterizations and one-dimensional flow tests (described in Experimental Methods). The width of the main lateral flow channel for the AuNP-bound sample solution was chosen to be 5 mm because it produced the fastest and most consistent flow (Figure 2A). The width of the signal enhancement leg for the DAB solution was set at 2 mm (Figure 2B) because the fluidic resistance of the smaller channel was designed to reduce the backflow of the fluid from the main channel into the signal enhancement leg. In initial experiments, when the fluid from the main channel flowed back into the enhancement leg, reaction of SA–HRP–AuNP-bound sample with the DAB began before sample binding in the detection region. This resulted in reduced sample binding at the detection zone and increase smearing or background noise. We found the 2 mm channel alone was not enough to prevent backflow. Therefore, we added a 5 μL “delay valve”19 (2 × 5 mm2) near the intersection of the 2 mm channel and the 5 mm channel. The capillary pressure exerted by the saturation of the signal enhancement leg prevented the backflow of the sample from the main channel.
Figure 2.
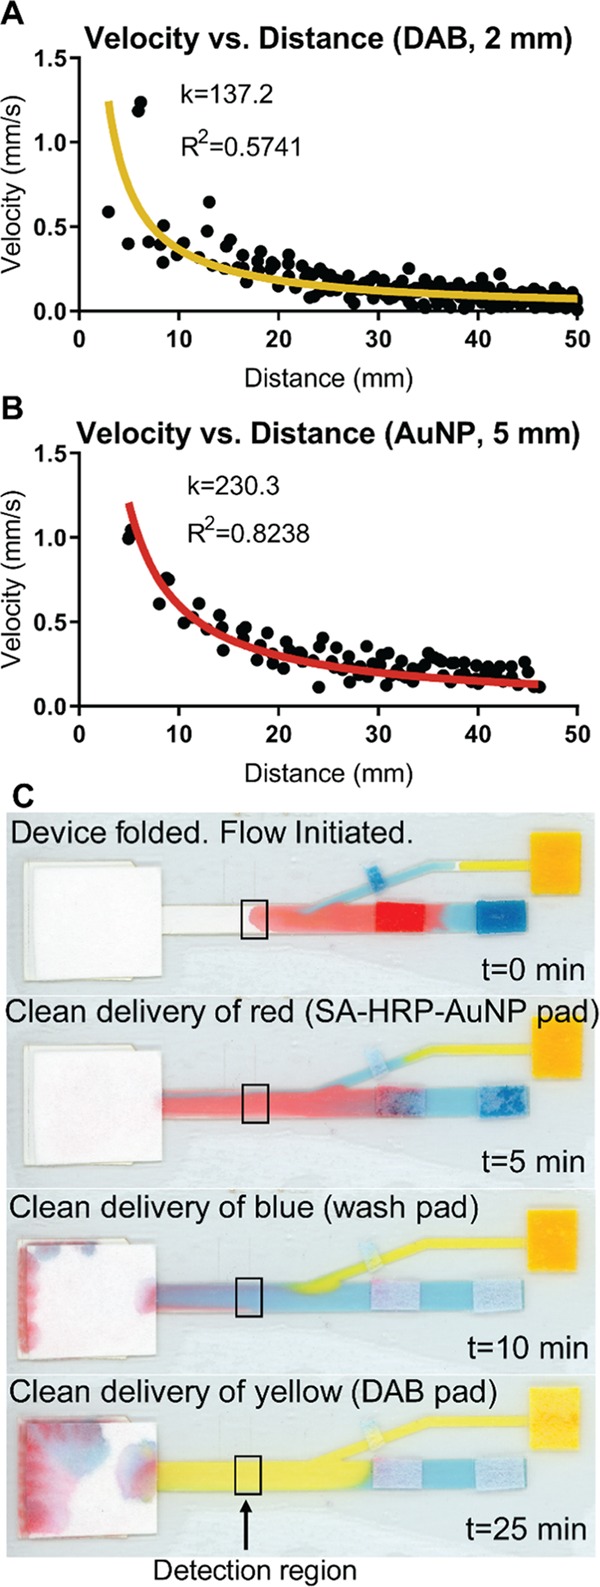
2DPN flow optimization. (A, B) Experimental data (circles) fit with eq 1 (line). k refers to the parameter from eq 1 and R2 is the coefficient of determination for the fit of eq 1 to the data shown. (A) AuNP solution velocity over distance in a 5 mm wide channel. (B) DAB solution velocity over distance in a 2 mm wide channel. (C) Proof-of-concept 2DPN flow with food coloring in PBST demonstrating the sequential delivery of reagents to the detection region (boxed).
A unique aspect of our design compared to the previous literature is the location of the leg–channel intersection downstream of the sample pad. Importantly, this allows us to deliver the DAB and H2O2 upstream from the detection zone but downstream from the sample pad to prevent premature signal development and high background signal at the detection zone. Additionally, the intersection is set at a 20° angle from the main channel to ensure flow in only one direction. Previously, inferior performance for leg devices was reported due to parallel reagent delivery, which results in a signal appearing only in the middle of the test zone.5 To ensure this would not be a problem, we assessed the “clean delivery” of each reagent. Clean delivery was defined as each model fluid (food coloring) being delivered across a minimum of 90% of the 5 mm channel width at the detection zone (Figure 2C). We established that the DAB leg intersection must be a minimum of 10 mm upstream of the detection zone for this clean delivery to occur (Figure S4).
The length of the leg was chosen based on distance and time results from flow testing to ensure that the DAB and H2O2 arrived at the detection zone after the sample and wash fluids. The volume of the DAB and H2O2 pads was then adjusted to compensate for the volume capacity of the nitrocellulose leg. Similarly, sample and wash volumes were adjusted based on the volume capacity of the nitrocellulose platform (Table S3).
Several innovations set this work apart from previous 2DPNs. We performed rigorous assessment of nine different parameters of the device design to ensure optimal signal development (Table S4). We did not use a final wash upstream of the DAB because DAB does not require a “stop solution” to arrest color development, unlike most other colorimetric enhancement reactions including gold and silver enhancement and tetramethylbenzidine (TMB).20 Additionally, reducing the number of fluidic inputs also decreases the number of user steps.
2DPN Flow Timing
Following one-dimensional flow testing studies and 2DPN optimization, a food coloring timing study was performed in the final, fully optimized nitrocellulose design (Figure 2C). Based on the results of these flow studies, the SA–HRP–AuNP-bound sample reached the detection zone at approximately 5 min, followed by clean delivery of the wash solution at the detection zone at 10 min. Therefore, the pre-enhancement signal, occurring prior to DAB and H2O2 delivery, was defined as the signal intensity at 10 min. The DAB and H2O2 signal enhancement solution arrived at the detection zone at 25 min and produced a reliable signal increase at 40 min. To allow time for the signal enhancement reaction to complete, we measured the post-enhancement signal at 60 min although amplification remained stable between 40 and 90 min (Figure 3A). In the future, scaling down the device size and liquid volumes could reduce some of the total flow time. However, it is critical to ensure that the unbound SA–HR–AuNPs are fully rinsed to prevent background noise from nonspecific signal development.
Figure 3.
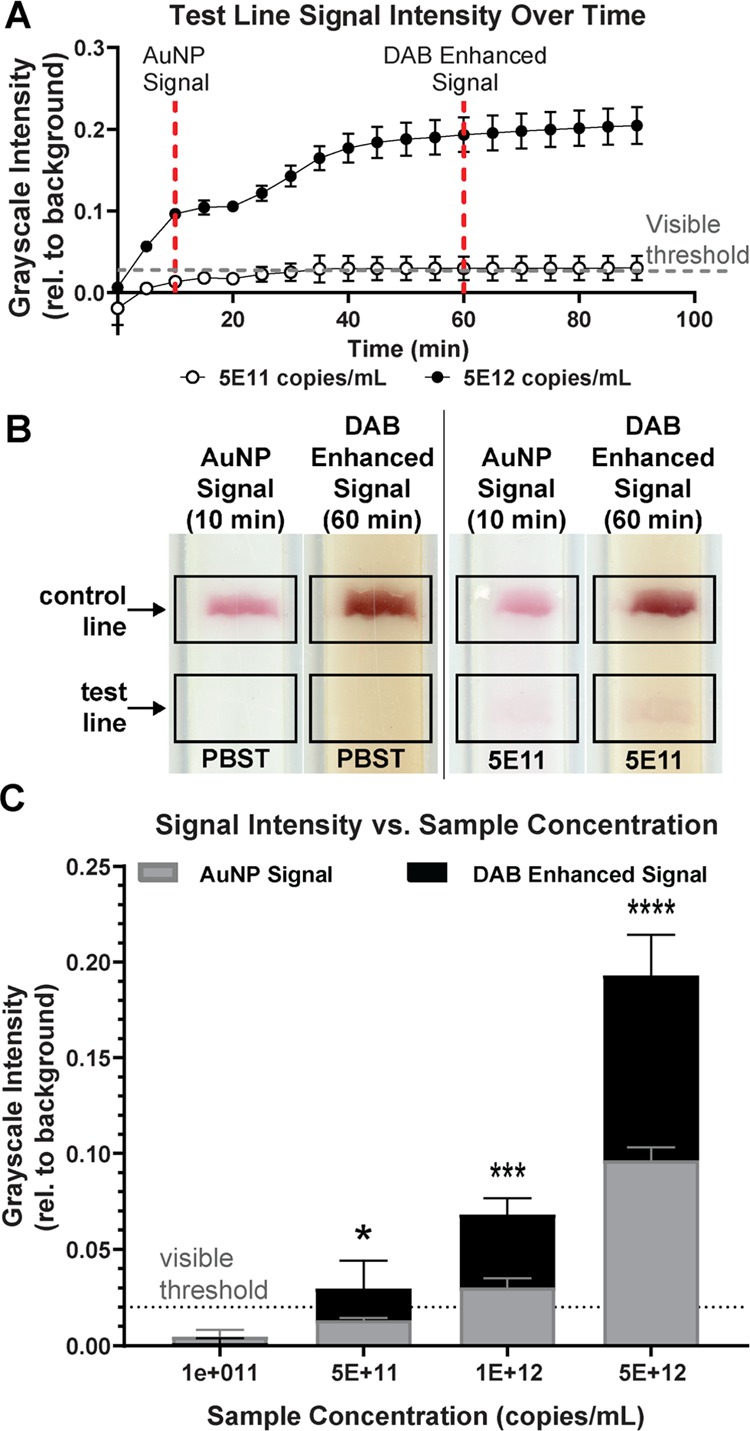
Signal development over time. (A) Signal intensity of the test line over time for 5 × 10¹² and 5 × 10¹¹ copies of ssDNA/mL. Dashed lines indicate time points when the AuNP signal and the DAB-enhanced signal data are compared. (B) Detection region of 2DPN imaged at 10 min (AuNP signal) and at 60 min (DAB-enhanced signal). (C) Normalized test line intensities at 10 min (AuNP signal) and at 60 min (DAB-enhanced signal) for varying ssDNA concentrations. The visible threshold at 0.02 is indicated by a dashed line. (Dunnett’s multiple comparison vs 0 copies/mL, *p < 0.05, ***p < 0.001, ****p < 0.0001, n = 3, replicates shown in Figure S5).
Signal Enhancement Stability Over Time
In Figure 3A, our signal is above the visible threshold and maintains steady contrast for consistent ease of reading at any time past the 40 min mark, up to our final measurement at 90 min. 2DPNs also maintained this steady-state contrast several hours after testing (not shown). Lathwal and Sikes have investigated a number of enzymatic colorimetric enhancement agents for the improvement of signal visualization on paper-based diagnostics.20 They found that many common visualization agents did not retain distinguishable positive or negative signals after 40 min and that specifically timed reagent additions, wash steps, stop solutions, and reading times would be necessary. A previous study showed that the visible threshold for an untrained user without instruction was quantified at 0.02 grayscale intensity when normalized to the background using a custom MATLAB program.21,22 Based on this, we used the 0.02 grayscale intensity as the visible threshold for a positive result in our experiments.
ELISA-Enhanced 2DPN Decreases LOD
In our experiments, in which all components had been dried within the last 7 days, DAB signal enhancement improves the LOD from 1 × 10¹² to 5 × 10¹¹ copies/mL (Figure 3C, replicates shown in Figure S5). For 5 × 10¹¹ copies/mL, the average AuNP signal is 0.01, which is well below the 0.02 visible threshold, while the average DAB-enhanced signal is 0.03. This LOD is comparable to that of RNA-based assays in one-dimensional LFIAs with an enhancement solution, which was found to be ∼1 × 10¹¹ copies/mL.16Figure 3B demonstrates the ability of our 2DPN enhancement solution to increase the intensity of the test line above the visible threshold when the AuNP signal alone was not visible. Additionally, this visual enhancement does not increase the visibility of a negative sample test line and does not create false positives with negative (PBST only) samples.
Others have presented improvements in signal intensity and visibility with viral detection platforms, but few have measured the true change in LOD in terms of copies/mL. For example, the Richards-Kortum group reports a visual signal increase of 15% with silver enhancement and 25% with gold enhancement.16 We achieved an average 122% increase in signal intensity for the dried 2DPN with our LOD sample of 25 μL containing 5 × 10¹¹ copies/mL ssDNA (Table S5). We detected an average signal enhancement of 116% for all samples above the LOD. Our device with signal enhancement can detect sample concentrations 5 times smaller than our device with AuNPs alone. Therefore, the signal enhancement translates to a five-fold reduction in the LOD.
Signal Intensity Varies with Sample Concentration
The signal output of the 2DPN showed test line intensity changes as a function of sample concentration. The fit of the ELISA (R2 = 0.9771) with our data indicates that our paper-based dried reagent ELISA assay can generate results like that of a traditional ELISA (Figure S7). This demonstrates the potential of this paper diagnostic to quantitatively determine sample loads, which is crucial for chronic disease monitoring applications.
Reagents Retain Activity After 28 Days of Dry Storage
Incorporating all necessary reagents predried on the 2DPN improves ease-of-use by eliminating reagent preparation steps. It also simplifies storing, packing, and shipping of the devices, which is critical for the translation of 2DPNs into clinical use. Other researchers have dried different individual components of the DAB/HRP/H2O2 reaction for LFIAs and 2DPNs, but prior to this work, no one had successfully demonstrated and measured LOD improvements of all components in a dry state.5,10
We tested the ability to dry and store all reagents to determine the practicality of this device for real-world use. After drying, assembling, and storing all components of the 2DPN device for 1, 7, and 28 days, we still observed similarly detectable signals. There were no statistically significant decreases in the signal intensity after 7 or 28 days of dry storage for a sample concentration of 5 × 10¹² dsDNA copies/mL (hybridized probes 1 and 2, Table S1). Although the high concentration sample of 1 × 10¹⁴ copies/mL on the 2DPN did show a significant decrease in signal intensity after 28 days, the intensity remained well above the visible threshold (Figure 4). These results show that our dried SA–HRP–AuNPs, DAB, and H2O2 retained activity for at least 28 days of dry storage on a fully assembled device. Because signal intensity at lower sample concentrations did not significantly degrade, we conclude that the sensitivity of our device is the same before and after 28 days of storage. In the future, lower sample concentrations and devices older than 28 days can be tested to establish the LOD of dried 2DPNs after long-term storage.
Figure 4.

Quantification of test line intensity. Background-subtracted grayscale test line intensity for hybridized DNA samples run on fully dried and assembled 2DPNs imaged after 60 min. The visible threshold at 0.02 is indicated by a dashed line. (n = 6, **p < 0.01 in Dunnett’s multiple comparison with 1 day dried storage 2DPN as the control).
2DPNs Detect Amplified MERS-CoV TARA Products
To extend the application of our device beyond the detection of a model probe, we tested diluted TARA product on our dried 2DPN (Figure 5A, replicates shown in Figure S6). The TARA reaction can produce detectable PNA strands at a concentration ∼100× higher than the initial target RNA concentration at room temperature in as little as 15 min.11 The average background-subtracted grayscale signal produced by the TARA-amplified sample (10× diluted) after 60 min on the dried 2DPN was 0.08 (Figure 5B). Based on the ELISA calibration curve, this translates to a sample concentration of 2.7 × 10¹² copies/mL (eq 2, Figure S7). Given that 2 × 10¹¹ copies/mL of target RNA was input into the TARA reaction and the TARA reaction was diluted 1:10, the estimated concentration of the TARA-amplified sample was 2.7 × 10¹³ copies/mL. This confirms that TARA amplifies concentrations ∼100-fold.
Figure 5.
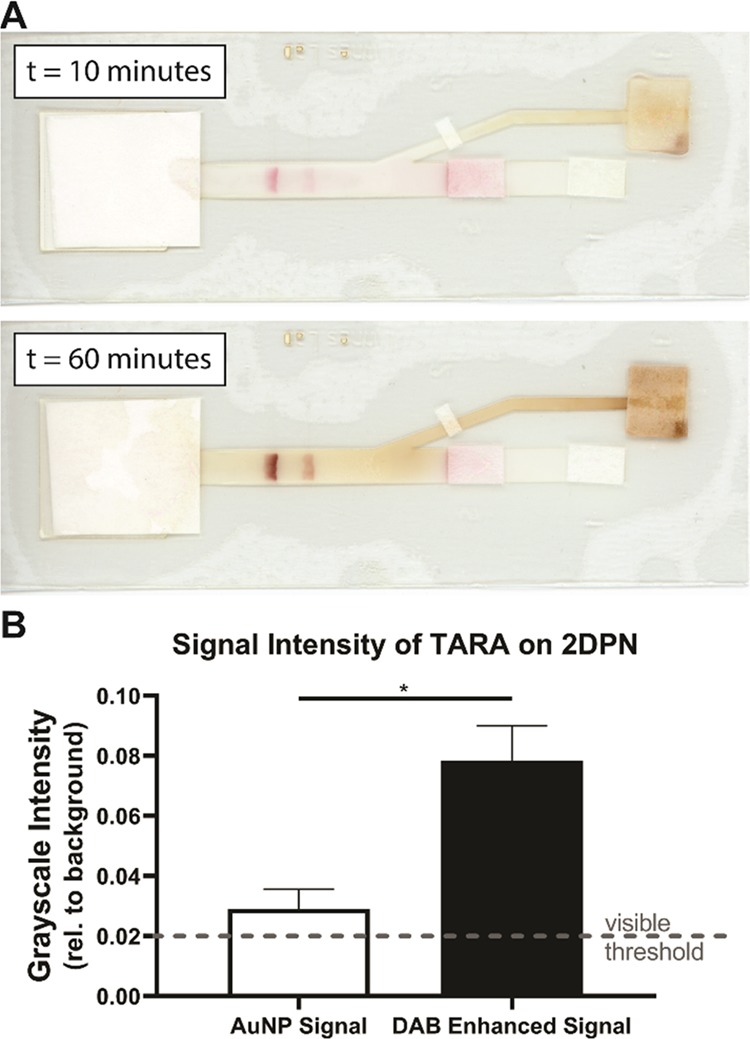
Results of TARA sample (1:10 dilution in PBST) on a dried 2DPN. (A) Scans taken of a representative test at 10 and 60 min. (B) Test line signal intensity analysis of the TARA sample on 2DPNs before and after signal enhancement (paired t-test, *p < 0.05, n = 3, replicates shown in Figure S6).
Based on these results, combining TARA and 2DPN technologies could result in a LOD as low as 5 × 10⁹ copies/mL. Clinical samples from lower respiratory samples (aspirate) of MERS-CoV-infected patients had a mean virus concentration/mL of 5.0 × 10⁶ (maximum 6.3 × 10¹⁰).23 With a combination of TARA and our 2DPN, we could detect samples in the upper range of clinically relevant concentrations without the need for heating or multiple pipetting steps. Test results can be produced within as little as 1 h (based on a 15 min amplification, 5 min sample and reagent application, and 40 min of signal enhancement on the 2DPN). Further optimization or increased amplification time of the TARA reaction and additional characterization of the AuNP–SA–HRP signal enhancement is feasible to further improve overall LOD. Specifically, the amount of signal enhancement on the 2DPN can be further improved by characterizing the HRP reagent, as the protein used in this assay was a preconjugated, proprietary SA–HRP product with an unspecified amount of HRP molecules attached.
We calculated the cost of materials for this platform, as seen in Table S6. We estimate that the total cost of goods for our 2DPN is approximately 1.82 USD. Commercially available one-dimensional LFIAs with an anti-FITC test line and a biotin control are available from 3.75 USD.24 Reported cost estimate calculations for other lab-based LFIAs for viral detection platforms to range from 0.8016 to 12.7025 USD. While the general cost of materials for any platform should be considered for theoretical commercial translation, over-reliance on cost reduction as a feature of POC designs without consideration of other cost factors is an issue we do not want to promote.26 While this platform is considered of low cost from a material perspective, we recognize that significant manufacturing costs may be a barrier to commercialization. Although the assembly of 2DPNs is not as straightforward as that of one-dimensional LFIAs, we anticipate that robotic advancements such as pick-n-place, cut-sheet manufacturing, and roll-to-roll will enable scale-up of devices.
Conclusions
We have demonstrated a 2DPN design that automates the flow of a signal enhancement solution to improve the LOD of nucleic acid samples labeled with FITC and biotin. We improved upon previous 2DPN designs that use DAB as a signal enhancer by reducing the number of fluidic inputs and detection time and by incorporating dry storage of all necessary reagents, including a source for reactive hydrogen peroxide. Our fully dried device has shown versatility in the ability to detect multiple types of nucleic acid samples, including PNA products from a room-temperature RNA amplification reaction, TARA. The applicability of this 2DPN can be extended to detect a variety of pathogens and incorporate other amplification reactions with FITC and biotin-tagged products. The HRP signal enhancement retains activity after 28 days of dry storage on a fully assembled device. The fully dried and assembled device (after a total of 60 min run time) achieved a LOD of 5 × 10¹¹ copies of ssDNA per mL, comparable to other hybridization-based nucleic acid detection devices. When combined with TARA, the LOD can reach as low as 5 × 10⁹ target copies/mL and can be further reduced by using other NA amplification methods with higher outputs. The signal in the detection zone is maintained well after the sample is run, reducing the need for the strictly timed reading of results.
These critical advancements enable sample detection and enhancement of amplified NA products with an average signal enhancement of 116% for samples above the LOD. Our 2DPN produces a signal intensity increase much greater than commercially available gold or silver enhancement solutions and requires only simple rehydration of pads and folding to perform. We determined not only the increase in signal intensity but also how that increase affects the true LOD (in copies/mL), a practice we believe should be applied to the design of all LFIAs incorporating signal enhancement agents. This proof-of-concept for a fully dried, deployable 2DPN shows promise for detecting many other pathogens beyond Mers-CoV and can be employed with other nucleic acid amplification techniques. Our fully dried, automated viral detection platform has shown to be a successful proof-of-concept with multiple types of NA samples. These results are promising for the future applications of this technology at the POC.
Computational Methods
To characterize capillary flow parameters necessary to establish channel widths and lengths in our 2DPN, we evaluated and modeled one-dimensional flow rates using an extension of the Lucas–Washburn and Darcy equations as previously demonstrated by Gosselin et al.27 The flow rate of each of the reagents was analyzed using mathematical models for capillary pressure. Capillary pressure (Pc) in a rectangular channel is described by the equation
where γ is the surface tension, θi is the contact angle of fluid on each i surface, h is the height of the membrane, and w is the width of the membrane.28 If we assume a rectangular cross-section of nitrocellulose and that particles are diluted in water, then Pc = γ(2 cos (θ)/h + 2 cos (θ)/w), where every surface i is nitrocellulose and θ is the advancing contact angle of pure water on nitrocellulose. Given that our nitrocellulose membrane, FF80HP (GE Healthcare), has pore size comparable to HF135 (Millipore),21 which can pass particles of up to 0.5 μm,29 we can assume an approximate pore size of 0.5 μm. For water on 0.45 μm pore size nitrocellulose, the advancing contact angle is measured to be approximately 40°.30 The capillary force is then equal to Fcap = Pc × hw. Substituting in the expression for Pc, the equation becomes Fcap = γ2 cos (θ) (w + h). Due to the low Reynold’s numbers in small capillary channels, the inertial effects can be neglected, and the capillary force can be equated to the drag force Fdrag = 6μVzC,27 where μ is the viscosity of the fluid, V is the velocity, z is the distance traveled in the capillary channel, and C is the geometric constant: C = 2h/w + w/h. Then, 6μVzC = γ2 cos (θ) (w + h). Then, rearranging to solve for velocity gives
| 1 |
where nitrocellulose width (w) and height (h) are maintained and k is defined as γ/μ and is determined experimentally for DAB and AuNP solutions.
Experimental Methods
Reagents and Materials
Reagents used throughout this work include PBST (0.05% Tween 20, Millipore Sigma, Inc., Burlington, MA), 40 kDa poly(vinylpyrrolidone) (PVP40) (Millipore Sigma, Inc., Burlington, MA), fraction V bovine serum albumin (BSA) (Biotium, Fremont, CA), sucrose (IBI Scientific, Dubuque, IA), poly(ethylene glycol) (PEG) (MW 3350 Da, 0.2% w/v), trehalose (Thermo Fisher Scientific, NJ), FeSO4-EDTA (Fe-EDTA) (Millipore Sigma, Inc.), and molecular biology water (Thermo Fisher Scientific). DAB and urea hydrogen peroxide SigmaFast tablets (#D4168, Millipore Sigma, Inc.) were rehydrated according to product specifications for initial dried enzymatic signal testing. For long-term storage tests, hydrogen peroxide urea-adduct (#95314-250G, Millipore Sigma, Inc.,) tablets were crushed into a powder.
Streptavidin poly-HRP (SA–HRP, #21140, Pierce Biotechnology, Rockford, IL) and 40 nm AuNPs (G-40-100, Cytodiagnostics Inc., Burlington, ON) for SA–HRP–AuNP conjugation (SA–HRP–AuNPs). Polyclonal goat anti-rabbit biotin conjugate (#31822, Thermo Fisher Scientific). A monoclonal anti-FITC antibody (1F8-1E4, Invitrogen, Rockford, IL) was used for long-term dry storage tests. Due to product changes and subsequent lack of binding for different lot numbers, we switched antibodies and used polyclonal anti-FITC antibody (20C-CR1056SP, Fitzgerald, Bath BA1 1BE, U.K.) for LOD dried tests and for the remainder of the investigation. All oligonucleotide probes were custom-ordered from IDT (Integrated DNA Technologies, Inc., Coralville, IA). Food coloring for one-dimensional flow testing (McCormick Assorted Food Color & Egg Dye).
2DPN materials for fabrication and storage include nitrocellulose (FF80HP) and the cellulose absorbent pad (#3001-861) from GE Healthcare Bio-Science Corp. (Pittsburgh, PA), Grafix Dura-Lar Clear Adhesive-Backed Film (Dick Blick Art Materials, Galesburg, IL), glass fiber reagent storage pads (#GFCP103000, Millipore Sigma, Inc.), and silica gel desiccant (S-3903, ULINE, Pleasant Prairie, WI).
Characterization of LFIA Components
The volume capacity of the nitrocellulose membrane and the glass fiber conjugate pads was calculated by determining the dry mass of the membrane using a ME-T Analytical Balance (Mettler Toledo), submerging the membrane in deionized (DI) water for 2 min, and then determining the wet mass of the membrane. Using the density of water, the total volume held by the membrane segment was calculated and divided by the area of the segment. The volume released from the glass fiber pads was estimated by first measuring the wet mass of the membrane. Then, the membrane was placed on nitrocellulose with a 2 mm overlap and covered with adhesive. The post-flow mass was measured after leaving the wet membrane in contact with nitrocellulose for 20 min. The volume released is expressed as a percentage difference of post-flow mass and wet mass relative to the initial wet mass.
Flow Rate Analysis
One-dimensional flow studies were performed with reagents in nitrocellulose channels of varying width. Linear nitrocellulose patterns were designed in Adobe Illustrator CS6. Designs were 50 mm long with a width of either 1, 2, or 5 mm and included a fluid collection segment at the end with an area of 100 mm2. The nitrocellulose patterns were cut from with a Silhouette Cameo 3 cutter (Silhouette America, Inc., Lindon, UT). The nitrocellulose was blocked with a solution of 0.25% PVP40, 2% BSA, and 5% sucrose in PBST to prevent nonspecific binding.31 The volume used in each test was adjusted for the nitrocellulose and glass fiber pad volume capacity. The sample of conjugated AuNPs or prepared DAB was applied to the source pad. The flow was video-recorded with an iPhone 6 at 30 frames per second with a 5 mm reference length in the frame until the fluid front reached the fluid collection segment. The distance and time measurements were plotted at the location of the fluid front for each frame in the video. The average velocity was calculated over 5 s intervals. The velocity vs distance graphs were fit with a nonlinear curve of eq 1 using the least-squares method to find the parameter k using GraphPad Prism v8. We assumed that dynamic viscosity (μ) is constant for each fluid. Therefore, we interpret a change in the k value as a change in surface tension (γ), as surface tension is dependent on the surrounding environment, as well as the properties of the fluid.
2DPN Assembly
We created the 2DPN design in the Adobe Illustrator software (CS6, Adobe Inc., San Jose, CA). Nitrocellulose and adhesive patterns were laser cut with a VLS3.50 laser cutter (Universal Laser Systems Inc., Scottsdale, AZ). Adhesive patterns were cut from Dura-Lar Clear Adhesive. Goat anti-rabbit biotin conjugate (0.2–0.4 μL of 1.3 mg/mL) was pipetted onto the nitrocellulose for the control line. Anti-FTIC antibody (0.2–0.4 μL of 1.5 mg/mL) was pipetted onto the nitrocellulose for the test line. Glass fiber pads and the cellulose waste pad were hand cut. The 2DPN components were assembled on the adhesive backing, as shown in Figure 1A. 2DPN storage conditions are shown in Figure S1.
Drying of Reagents
For the dried components of the AuNP signal and subsequent enzymatic enhancement, we employed specific methods proven by the previous literature to maintain the stability of each reagent. SA–HRP was added to each 1 mL of 1 optical density (OD) 40 nm AuNPs for a final SA–HRP concentration of 0.01 mg/mL. The solution was incubated on a rocker for 30 min at room temperature. The solution was blocked with the BSA Fraction V (1% w/v) for 1 h at room temperature followed by blocking with PEG (0.2% w/v) for 1 h at room temperature. The AuNPs were centrifuged at 900×g for 30 min. The supernatant was discarded, preserving the AuNP pellet. The pellet was resuspended in drying buffer (0.5× PBS, pH 7.4, 10% sucrose, 1% Tween 20, 0.5% BSA Fraction V, 0.2% PEG, 0.5% PVP40), and the OD was measured using a NanoDrop 2000c (Thermo Fisher Scientific). OD was adjusted by diluting conjugated AuNPs with drying buffer. Trehalose (4% w/v) and 0.01 M Fe-EDTA were added prior to drying. Twenty five microliters of the conjugated SA–HRP–AuNP solution was then deposited on an 8 × 5 mm2 glass fiber pad and dried under vacuum with a desiccant at room temperature overnight.
To prepare dry DAB pads, one DAB tablet was rehydrated in 500 μL of PBST, for a concentration of 1.4 mg/mL. Trehalose (4% w/v) was added to the DAB solution.10 Fifty microliters of DAB solution was deposited on an 8 × 10 mm2 glass fiber pad, then dried under vacuum at room temperature overnight. H2O2 tablets were crushed into a powder, and 2 mg of the tablet powder was affixed on the adhesive under a 50 μL capacity glass fiber pad.
Design of the Model DNA Probe
To create a hybridized double-stranded DNA (dsDNA) model, 1 μL of 100 μM of 6-carboxyfluorescein (FAM)-tagged ssDNA (Table S1, probe 1), 1 μL of 100 μM of biotin-tagged ssDNA (Table S1, probe 2), 10 μL of 10× isothermal amplification buffer I, and 88 μL of DNase/RNase free water were combined in a small PCR tube. The PCR tube was placed in a thermocycler and run on a protocol of 95 °C for 1 min followed by 25 °C for 1 min, for a total of 20 min. The concentration of the probe was determined using a NanoDrop 2000c (50 ng/μL per 1 OD). The hybridized dsDNA probe was stored at −20 °C until use. Single-stranded DNA (ssDNA) tagged with both FAM and biotin (Table S1, probe 3), provided by IDT, was used as the ssDNA model.
Running the 2DPN
Volumes were loaded onto the 2DPN as follows: 25 μL of the NA sample onto pad (1), 25 μL PBST onto pad (2), 5 μL PBST onto pad (3), and 50 μL PBST onto pad (4) (Figure 1A). Then, the device was folded at the crease to initiate flow through the channels and sealed around the edges. Devices were imaged every 5 min using a flatbed scanner (V850 Pro, Epson America, Inc., Long Beach, CA) at 1200 dpi. For flow visualization, food coloring was added to PBST and deposited on the glass fiber pads. Test and control line intensities were analyzed with a custom MATLAB script.21,22 The visible threshold (the visual cutoff for interpreting a test line as positive) of the background normalized grayscale intensity was set to 0.02 for all signal analyses according to Phillips et al.22
For LOD tests, dilutions of 100 μM probe 3 solution in PBST were used. Tests were run on assembled 2DPNs stored between 1 and 7 days. ssDNA was used in the LOD tests because the exact concentration is provided by the manufacturer. NanoDrop measurements of dsDNA-hybridized probe concentration provide an approximate concentration but cannot provide information on the amount that hybridized compared to remaining nonhybridized strands. The previous analysis of dried 2DPN results tested with comparable concentrations of ssDNA and dsDNA probes showed no significant differences in intensity (not shown). For storage tests, a dsDNA-hybridized probe sample was diluted in PBST to approximate concentrations of 1 × 10¹⁴ and 5 × 10¹² copies/mL. The same dsDNA samples were used in all 1-, 7-, and 28-day storage tests. For both LOD and storage tests, replicates for any given sample concentration and device condition were performed simultaneously.
ELISA Standard Curve
Four-parameter logistic (4PL) models are typically used to model signal intensity as a function of sample concentration in ligand-binding assays, such as ELISAs.32 Therefore, we selected this model to evaluate our LOD produced by the DAB-enhanced signal (Figure S7).
| 2 |
where y is the signal intensity, x is the log of sample concentration, a is the response at 0 concentration, d is the response at infinite concentration, c is the concentration that gives a signal intensity halfway between a and d, and b is a slope parameter typically near 1.33 The 4PL model was fit to the LOD data in GraphPad Prism v8 with the slope parameter (b) constrained to 1.
Template-Assisted Rapid Assay (TARA)
TARA is a proprietary RNA amplification technology developed by CrossLife Technologies Inc.11 TARA is an enzyme-free chemical ligation assay that leverages a target RNA sequence to initiate hybridization of a peptide nucleic acid (PNA) backbone containing FAM to a second PNA strand containing biotin. This results in a single PNA strand with both markers (Figure S2). PNA probes to detect the nucleocapsid gene of MERS-CoV were designed using the Applied Biosystems Primer Express v2 software (structure and sequence details shown in Figure S3 and Table S2). Probe hybridization sequences were evaluated by the Basic Local Alignment Search Tool (BLAST) to select regions conserved across multiple transcript variants. For the initial design, target complexity and accessibility were evaluated using Visual OMP (DNA Software Inc., Ann Arbor, MI). PNAs were synthesized by PNAbio Inc. (Thousand Oaks, CA). ssRNA at an initial concentration of 2.0 × 10¹¹ copies/mL was purchased from IDT. TARA was performed with the ssRNA at room temperature for 15 min. Dilutions of final TARA products were made in PBST and applied directly to sample pads on 2DPNs that had been dried and assembled within the previous 7 days. The same diluted sample was used for all 2DPN tests. Replicates were performed simultaneously.
Acknowledgments
This research was funded in part by the National Science Foundation Small Business Innovation Research (SBIR) Program Grant 1720900 and Purdue University Shaw Global Innovation Laboratory’s Innovations in International Development Award.
Supporting Information Available
The Supporting Information is available free of charge at https://pubs.acs.org/doi/10.1021/acsomega.0c00115.
Images of fully assembled 2DPN and storage conditions; model probe sequences; TARA reaction schematic; 2DPN optimization parameters; calculations for signal intensity percent increase; signal analysis and curve fit comparison; and calculations for cost estimation (PDF)
Author Contributions
K.M.B. and A.R.B. contributed equally. The manuscript was written through the contributions of all authors. All authors have given approval to the final version of the manuscript.
The authors declare the following competing financial interest(s): Dr. HyunDae D. Cho is CEO and President of CrossLife Technologies, which holds a patent for the TARA assay we used in this publication.
Supplementary Material
References
- Laboratory Diagnosis of Viral Infections. In Fenner’s Veterinary Virology; MacLachlan N. J.; Dubovi E. J., Eds.; Elsevier, 2011; pp 101–123. [Google Scholar]
- Wang Y.-D.; Li Y.; Xu G.-B.; Dong X.-Y.; Yang X.-A.; Feng Z.-R.; Tian C.; Chen W. F. Detection of Antibodies against SARS-CoV in Serum from SARS-Infected Donors with ELISA and Western Blot. Clin. Immunol. 2004, 113, 145–150. 10.1016/j.clim.2004.07.003. [DOI] [PMC free article] [PubMed] [Google Scholar]
- Ko J.-H.; Müller M. A.; Seok H.; Park G. E.; Lee J. Y.; Cho S. Y.; Ha Y. E.; Baek J. Y.; Kim S. H.; Kang J.-M.; et al. Suggested New Breakpoints of Anti-MERS-CoV Antibody ELISA Titers: Performance Analysis of Serologic Tests. Eur. J. Clin. Microbiol. Infect. Dis. 2017, 36, 2179–2186. 10.1007/s10096-017-3043-3. [DOI] [PMC free article] [PubMed] [Google Scholar]
- Fu E.; Liang T.; Spicar-Mihalic P.; Houghtaling J.; Ramachandran S.; Yager P. Two-Dimensional Paper Network Format That Enables Simple Multistep Assays for Use in Low-Resource Settings in the Context of Malaria Antigen Detection. Anal. Chem. 2012, 84, 4574–4579. 10.1021/ac300689s. [DOI] [PMC free article] [PubMed] [Google Scholar]
- Fu E.; Kauffman P.; Lutz B.; Yager P. Chemical Signal Amplification in Two-Dimensional Paper Networks. Sens. Actuators, B 2010, 149, 325–328. 10.1016/j.snb.2010.06.024. [DOI] [PMC free article] [PubMed] [Google Scholar]
- Grant B. D.; Smith C. A.; Karvonen K.; Richards-Kortum R. Highly Sensitive Two-Dimensional Paper Network Incorporating Biotin–Streptavidin for the Detection of Malaria. Anal. Chem. 2016, 88, 2553–2557. 10.1021/acs.analchem.5b03999. [DOI] [PMC free article] [PubMed] [Google Scholar]
- Lafleur L. K.; Bishop J. D.; Heiniger E. K.; Gallagher R. P.; Wheeler M. D.; Kauffman P.; Zhang X.; Kline E. C.; Buser J. R.; Kumar S.; et al. A Rapid, Instrument-Free, Sample-to-Result Nucleic Acid Amplification Test. Lab Chip 2016, 16, 3777–3787. 10.1039/C6LC00677A. [DOI] [PubMed] [Google Scholar]
- Li J.; Macdonald J. Multiplexed Lateral Flow Biosensors: Technological Advances for Radically Improving Point-of-Care Diagnoses. Biosens. Bioelectron. 2016, 83, 177–192. 10.1016/j.bios.2016.04.021. [DOI] [PubMed] [Google Scholar]
- Fu E.; Liang T.; Houghtaling J.; Ramachandran S.; Ramsey S. A.; Lutz B.; Yager P. Enhanced Sensitivity of Lateral Flow Tests Using a Two-Dimensional Paper Network Format. Anal. Chem. 2011, 83, 7941–7946. 10.1021/ac201950g. [DOI] [PMC free article] [PubMed] [Google Scholar]
- Ramachandran S.; Fu E.; Lutz B.; Yager P. Long-Term Dry Storage of an Enzyme-Based Reagent System for ELISA in Point-of-Care Devices. Analyst 2014, 139, 1456–1462. 10.1039/C3AN02296J. [DOI] [PMC free article] [PubMed] [Google Scholar]
- Cho H.; Kim C. H.. Methods and Compositions of Non-Enzymatic Amplification and Direct Detection of Nucleic Acids. U.S. Patent US20160266118A12016.
- Unruh T. R.; Woolley J. B.. Molecular Methods in Classical Biological Control. In Handbook of Biological Control; Elsevier, 1999; pp 57–85. [Google Scholar]
- Gasperino D.; Baughman T.; Hsieh H. V.; Bell D.; Weigl B. H. Improving Lateral Flow Assay Performance Using Computational Modeling. Annu. Rev. Anal. Chem. 2018, 11, 219–244. 10.1146/annurev-anchem-061417-125737. [DOI] [PubMed] [Google Scholar]
- Lutz B. R.; Trinh P.; Ball C.; Fu E.; Yager P. Two-Dimensional Paper Networks: Programmable Fluidic Disconnects for Multi-Step Processes in Shaped Paper. Lab Chip 2011, 11, 4274. 10.1039/c1lc20758j. [DOI] [PMC free article] [PubMed] [Google Scholar]
- Samokhvalov A. V.; Razo S. C.; Safenkova I. V.; Slutskaya E. S.; Pridvorova S. M.; Zherdev A. V.; Dzantiev B. B. Synthesis of the Most Effective Streptavidin Conjugates with Small Gold Nanoparticles for Indirect Labeling in Lateral Flow Assay. Int. J. Appl. Eng. Res. 2017, 12, 13847–13860. [Google Scholar]
- Rohrman B. A.; Leautaud V.; Molyneux E.; Richards-Kortum R. R. A Lateral Flow Assay for Quantitative Detection of Amplified HIV-1 RNA. PLoS One 2012, 7, e45611 10.1371/journal.pone.0045611. [DOI] [PMC free article] [PubMed] [Google Scholar]
- Berthier J.; Gosselin D.; Pham A.; Delapierre G.; Belgacem N.; Chaussy D. Capillary Flow Resistors: Local and Global Resistors. Langmuir 2016, 32, 915–921. 10.1021/acs.langmuir.5b02090. [DOI] [PubMed] [Google Scholar]
- Dharmaraja S.; Lafleur L.; Byrnes S.; Kauffman P.; Buser J.; Toley B.; Fu E.; Yager P.; Lutz B.. Programming Paper Networks for Point of Care Diagnostics. In Microfluidics, Biomems, and Medical Microsystems XI; Becker H.; Gray B. L., Eds.; International Society for Optics and Photonics, 2013; Vol. 8615, p 86150X. [Google Scholar]
- Linnes J. C.; Byers K. M.; Phillips E. A.; Bird A. R.; Jamicich L. M.. Fluidic Control Elements for Signal Readout Enhancement in Two-Dimensional Paper Networks (2DPN). U.S. Patent US15/875,0162018.
- Lathwal S.; Sikes H. D. Assessment of Colorimetric Amplification Methods in a Paper-Based Immunoassay for Diagnosis of Malaria. Lab Chip 2016, 16, 1374–1382. 10.1039/C6LC00058D. [DOI] [PubMed] [Google Scholar]
- Holstein C. A.Development of a Novel Paper-Based Flu Test for Improved Diagnosis at the Point of Care, 2015.
- Phillips E. A.; Moehling T. J.; Bhadra S.; Ellington A. D.; Linnes J. C. Strand Displacement Probes Combined with Isothermal Nucleic Acid Amplification for Instrument-Free Detection from Complex Samples. Anal. Chem. 2018, 90, 6580–6586. 10.1021/acs.analchem.8b00269. [DOI] [PMC free article] [PubMed] [Google Scholar]
- Corman V. M.; Albarrak A. M.; Omrani A. S.; Albarrak M. M.; Farah M. E.; Almasri M.; Muth D.; Sieberg A.; Meyer B.; Assiri A. M.; et al. Viral Shedding and Antibody Response in 37 Patients With Middle East Respiratory Syndrome Coronavirus Infection. Clin. Infect. Dis. 2015, civ951 10.1093/cid/civ951. [DOI] [PMC free article] [PubMed] [Google Scholar]
- U-Star Disposable Nucleic Acid Lateral Flow Detection Units (Pack of 20). https://www.twistdx.co.uk/en/products/product/u-star-disposable-nucleic-acid-detection-device (accessed July 25, 2019).
- Natoli M. E.; Rohrman B. A.; De Santiago C.; van Zyl G. U.; Richards-Kortum R. R. Paper-Based Detection of HIV-1 Drug Resistance Using Isothermal Amplification and an Oligonucleotide Ligation Assay. Anal. Biochem. 2018, 544, 64–71. 10.1016/j.ab.2017.12.008. [DOI] [PMC free article] [PubMed] [Google Scholar]
- Wilson D. J.; Kumar A. A.; Mace C. R. Overreliance on Cost Reduction as a Featured Element of Sensor Design. ACS Sens. 2019, 4, 1120–1125. 10.1021/acssensors.9b00260. [DOI] [PubMed] [Google Scholar]
- Gosselin D.; Berthier J.; Chaussy D.; Belgacem N. In Capillary Flows: Dynamics and Geometry Effects. Proceedings of the 2015 COMSOL Conference in Grenoble; 2015.
- Delamarche E.; Bernard A.; Schmid H.; Bietsch A.; Michel B.; Biebuyck H. Microfluidic Networks for Chemical Patterning of Substrates: Design and Application to Bioassays. J. Am. Chem. Soc. 1998, 120, 500–508. 10.1021/ja973071f. [DOI] [Google Scholar]
- Lateral Flow Membranes. IVD/OEM Materials and Reagents; MilliporeSigma.
- Zhdanov S.; Starov V.; Sobolev V.; Velarde M. Spreading of Aqueous SDS Solutions over Nitrocellulose Membranes. J. Colloid Interface Sci. 2003, 264, 481–489. 10.1016/S0021-9797(03)00520-4. [DOI] [PubMed] [Google Scholar]
- Guo Y.-R.; Liu S.-Y.; Gui W.-J.; Zhu G.-N. Gold Immunochromatographic Assay for Simultaneous Detection of Carbofuran and Triazophos in Water Samples. Anal. Biochem. 2009, 389, 32–39. 10.1016/j.ab.2009.03.020. [DOI] [PubMed] [Google Scholar]
- Little J. A. Comparison of Curve Fitting Models for Ligand Binding Assays. Chromatographia 2004, 59, S177–S181. 10.1365/s10337-003-0182-8. [DOI] [Google Scholar]
- Lindsey C. Y.; Pace-Templeton J. G.; Millard C. B.; Wannemacher R. W.; Hewetson J. F. Validation of ELISA for the Determination of Anti-Ricin Immunoglobulin G Concentration in Mouse Sera. Biologicals 2006, 34, 33–41. 10.1016/j.biologicals.2005.08.018. [DOI] [PubMed] [Google Scholar]
Associated Data
This section collects any data citations, data availability statements, or supplementary materials included in this article.