

Abstract
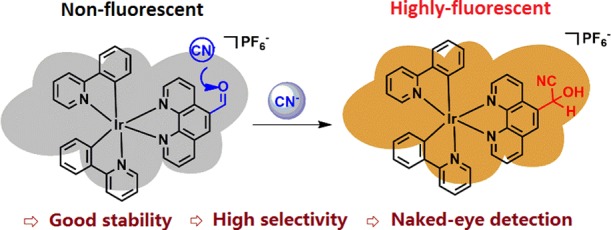
A cyclometallated phosphorescent iridium-based probe to detect CN– was prepared through a cyanide alcoholize reaction based on the C^N type main ligand and N^N type ancillary ligand (2-phenyl pyridine and 1,10-phenanthroline-5-carboxaldehyde, respectively). The efficient probe exhibited good sensitivity in response to CN– in an CH3CN and H2O (95/5) mixture within a 1.23 μM detection limit. The response of PL is directly in line with the concentration of CN– from 0 to 2.0 equiv. The PL investigation of other reactive anions proved the great selectivity to CN–. Additionally, upon adding 1.0 equiv. of cyanide, the formation of cyanohydrin was correctly elucidated in 1H NMR, FT-IR, and mass spectra studies. The conspicuous results indicate that the iridium complex has the potential possibility of application in other biosystems related to CN–.
Introduction
Cyclometallation is a studied reaction in coordination and organometallic chemistry used to synthesize organometallic complexes normally.1−9 Recently, there is an extensive concern utilizing diversified transition-metal complexes as fluorescent molecular probes to selectively detect anions.10−14 Cyclometallated iridium(III) complexes have exciting photophysical properties because of the listed key advantages: (i) the precursors, in which the main ligand and ancillary ligand are facilely synthesized with higher productivity; (ii) the high stability, visible excitation wavelengths, large Stokes shifts, long lifetimes, and lower self-quenching in contrast to traditional organic materials, which are applied in some latent areas such as luminescent devices, detecting probes, and chemosensors.15−28 Therefore, studying the composition and adhibition of cyclometallated phosphorescent iridium(III) complex probes has a significant meaning in many areas.
Cyanide is a seriously toxic inorganic anion that is harmful to the human health and environment.29,30 Despite its extreme toxicity, chemical compounds including cyanide were extensively applied in gold mining, electroplating technology, and multiple diverse industrial areas, they yet bring the unavoidable environmental issues.31,32 Cyanide’s particular affinity can be applied in the design of fluorescent probes that have the electron-deficient carbonyl unit (C=O), finally forming cyanohydrin.33 Consequently, many works were performed to discover specifically susceptive probes on the basis of iridium(III) complexes to detect and sense cyanide and apply in the lighting area.34 For example, in a previous study, based on the Michael addition reaction and FRET mechanism, a battery type of “turn-on” probe was investigated and adapted to dual channels to test cyanide anions.35
These specific factors have aroused our interest to develop the electron-deficient carbonyl unit iridium(III) complex probe to be applied in the rapid response and high-sensitivity sensing of CN–. We herein report a cyclometallated phosphorescent iridium complex probe based on 2-phenyl pyridine as the C^N type main ligand and 1,10-phenanthroline-5-carboxaldehyde as the N^N type ancillary ligand, which is widely used in the selective detection of cyanide. The simple model of ligands assists us to elucidate the effects of the formation of cyanohydrin.36−40 The response of PL is directly in line with the concentration of CN– from 0 to 2.0 equiv. In addition, the great plane geometry of ligands is conducive to the geminated of single crystals of the phosphorescent iridium complex. The primary research shows that the complex can act as a probe for cyanide detection in great sensitivity and selectivity.
Results and Discussion
Synthesis of the Iridium Complex
The target product was synthesized based on the C^N type main ligand and N^N type ancillary ligand (2-phenyl pyridine and 1,10-phenanthroline-5-carboxaldehyde) (Scheme 1). The target iridium complex was confirmed by 1H NMR, 13C NMR spectra, and molecular structure represented in X-ray diffraction analysis, demonstrating that the target complex is successfully synthesized. In comparison to the iridium complex, after adding the CN–, there was a remarkable shift disappearance at δ 10.56 ppm belonging to the aldehyde proton, suggesting the occurrence of the cyanide alcoholize reaction at the aldehyde group. Meanwhile, a new peak at δ 8.60 ppm appeared, belonging to the formation of the cyanohydrin proton signal (−CH(CN)OH). In FT-IR spectra studies, a characteristic absorption band in the 1701 cm–1 of the iridium complex was referred to the remarkable vibration of the C=O bond. Meanwhile, the C=O absorption band unsurprisingly disappeared after adding the CN–. This is consistent with the formation of cyanohydrin through the cyanide alcoholize reaction.
Scheme 1. Synthesis of the Iridium Complex.

Reaction conditions: (i) 2-ethoxyethanol/water (v/v = 3:1) mixture, 120 °C, 24 h; (ii) DCM and CH3OH (1/1) mixture, rt, 24 h. The detailed descriptions of experiments are in the Experimental Section.
Crystal Structure of the Iridium Complex
To elucidate the plane structure of the cyclometallated iridium(III) complex, the single-crystal X-ray analysis was employed. Through the method of addition of n-hexane in the saturated dichloromethane complex solution, the single crystal was obtained for X-ray diffraction analysis. The iridium complex crystallized in the orthorhombic space group Pna21 (Figure 1). The crystallographic data and the structure refinement parameters are collected in Table 1. Partly bond lengths (Å), bond angles (°), and torsion angles (°) are collected in Table 2. The structure shows a typical distorted-octahedral geometry environment within the iridium(III) center coordinated by chelating the cyclometallated 2-phenyl pyridine ligand and C and N atoms and ancillary ligand. The formation of the cyclometallated iridium complex makes it have the higher air and thermal stability. The bond lengths of Ir–C, in the range of 1.987 (11) to 2.015 (12) Å, and Ir–N of the complex, in the range of 2.024 (9) to 2.157 (9) Å, are both within the value at the foregone scope of the semblable complex.41 Compared to the Ir–N, the Ir–C bond length is shorter, revealing the forceful interaction in the metal Ir center and C atom. Within the complex, the pyridine rings of the cyclometallated ligand are approximately coplanar with a dihedral angle of 8.7°. Noncovalent intermolecular interaction in the crystal stacking structure of the complex is observed.
Figure 1.
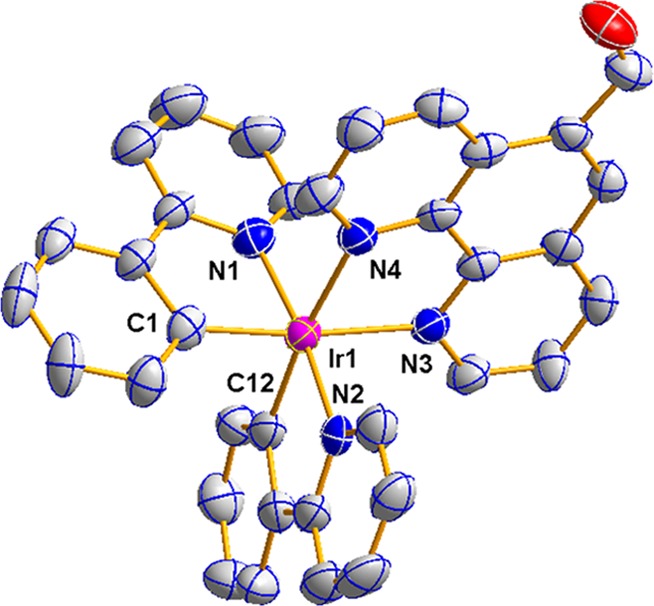
Plane structure of the cyclometallated iridium(III) complex with thermal ellipsoids drawn at the 30% level. All hydrogen atoms are omitted for clarity. Partly bond lengths (Å) and angles (°): Complex: Ir(1)–N(1), 2.036(9); Ir(1)–C(1), 2.023(10); Ir(1)–C(12), 1.987(11); Ir(1)–N(2), 2.024(9); Ir(1)–N(3), 2.150(9); Ir(1)–N(4), 2.146(9); C(12)–Ir(1)–C(1), 89.9(4); C(12)–Ir(1)–N(2), 94.4(4); N(2)–Ir(1)–N(1), 172.5(3); C(12)–Ir(1)–N(4), 173.5(4); C(1)–Ir(1)–N(4), 96.1(4).
Table 1. Crystallographic Data and Structure Refinement Parameters for the Complex.
| complex | |
|---|---|
| chemical formula | C38H31F6IrN4OP |
| FW | 896.84 |
| T (K) | 173(2) |
| λ (Å) | 1.34138 |
| crystal system | orthorhombic |
| space group | Pna21 |
| a (Å) | 23.9369(6) |
| b (Å) | 9.0172(2) |
| c (Å) | 33.4311(8) |
| α (°) | 90 |
| β (°) | 90 |
| γ (°) | 90 |
| V (Å3) | 7215.9(3) |
| Z | 8 |
| ρ (Mg m–3) | 1.651 |
| μ (mm–1) | 5.404 |
| F(000) | 3528 |
| θ range (°) | 3.212–53.021 |
| reflections collected | 40,569 |
| data/restraints/param. | 12,391/15/921 |
| goodness-of-fit on F2 | 1.014 |
| final R indices [I > 2σ(I)a] | R1 = 0.0393 wR2 = 0.0933 |
| largest diff. peak/hole (e Å–3) | 0.799/–0.744 |
R1 = Σ||F0| – |Fc||/Σ|F0| (based on reflections with F02 > 2σF2). wR2 = [Σ[w(F02 – Fc2)2]/Σ[w(F02)21/2; w = 1/[σ2(F02) + (0.095P)2]; P = [max(F02, 0) + 2Fc2]/3 (also with F02 > 2σF2).45
Table 2. Partly Bond Lengths (Å), Bond Angles (°), and Torsion Angles (°) for the Complex.
| bond lengths | |||
|---|---|---|---|
| Ir(1)–N(1) | 2.036(9) | Ir(1)–N(6) | 2.059(9) |
| Ir(1)–N(2) | 2.024(9) | C(7)–C(8) | 1.397(16) |
| C(2)–C(3) | 1.389(16) | N(1)–C(7) | 1.376(14) |
| Ir(1)–C(1) | 2.023(10) | O(1)–C(35) | 1.221(14) |
| N(3)–C(27) | 1.381(14) | Ir(1)–C(12) | 1.987(11) |
| bond angles | |||
| C(12)–Ir(1)–C(1) | 89.9(4) | C(12)–Ir(1)–N(2) | 80.3(4) |
| C(1)–Ir(1)–N(1) | 80.5(4) | N(2)–Ir(1)–N(4) | 96.8(3) |
| N(5)–Ir(2)–N(7) | 97.0(4) | C(7)–N(1)–Ir(1) | 115.5(7) |
| C(18)–N(2)–Ir(1) | 116.9(7) | C(28)–N(4)–C(32) | 118.7(10) |
| C(4)–C(5)–C(6) | 120.7(12) | N(1)–C(7)–C(8) | 118.2(11) |
| C(9)–C(8)–C(7) | 121.6(12) | N(1)–C(11)–C(10) | 122.0(11) |
| torsion angles | |
| C(2)–C(3)–C(4)–C(5) | –2(2) |
| C(5)–C(6)–C(7)–N(1) | 175.3(12) |
| N(2)–C(18)–C(19)–C(20) | 1.5(17) |
| C(15)–C(16)–C(17)–C(18) | 1.76.3(12) |
Detection of CN– in Aqueous Acetonitrile Solution
First, we studied the PL response of the probe to CN– including variable proportion of acetonitrile and water, and detailed information is attached in (Figure 2). The probe displayed the most obvious fluorescence enhancement in the CH3CN and H2O (95/5) mixture, while the fluorescence response to the probe increased with increasing proportion of water in the mixture solution and decreased after reaching the maximum value. Owing to the obvious change, we described in detail the conditions of the probe in the CH3CN and H2O (95/5) mixture.
Figure 2.

(A) Fluorescence intensity variation of the probe (20 μM) and the probe (20 μM) in the presence of 20 μM CN– in 0, 1, 3, 5, 10, 50, and 99% acetonitrile at 298 K (λex = 380 nm). The green columns show the intensity of the probe. The red columns show the intensity of adding CN–. (B) Changes of the fluorescence intensity at 570 nm of the probe with [CN–] (0–2.0 equiv.) in 0, 1, 3, 5, 10, 50, and 99% aqueous acetonitrile.
Detection of CN– by the Probe in UV–vis and PL Emission Spectra
The iridium complex displays remarkable color variation in the presence of CN–. The UV–vis absorption and phosphorescence titration spectra of the iridium complex were explored. Reaction condition optimization of the probe (20 μM) was performed by using the incremental addition of CN– (0–2.0 equiv.) as the model substrate in an CH3CN and H2O (95/5) mixture at ambient temperature. From the UV–vis absorption spectra (Figure 3), the strong absorption at 267 nm was ascribed to the singlet transitions, and a main absorption band at 380 nm was attributed to a metal ligand charge transfer (MLCT). Upon the addition of CN–, the absorption peak at 380 nm gradually emerged with a slight increase from the original absorption. This phenomenon is reasonable because cyanide can strongly attack the electron-deficient carbonyl unit (C=O) to form cyanohydrin. Therefore, this reaction would affect the state of MLCT, which resulted in the changes of emission properties.
Figure 3.

(A) UV–vis titration spectra of the probe (20 μM) in the presence of CN– (0–2.0 equiv.) in an CH3CN and H2O (95/5) mixture at 298 K. Inset: changes of the absorbance ratio between 380 and 267 nm of the probe with [CN–]. (B) Linear calibration curve of A380/A267 vs CN–.
The fluorescence titration experiments for CN– were as well used in the same condition of 20 μM solution of probe in CH3CN/H2O (v/v = 95:5). In the PL emission titration experiment, the probe exhibits weak fluorescence (ΦPL = 6.6%) in the absence of CN– at an excitation of 380 nm, referring to aldehyde quenching through photoinduced electron transfer (PET).42 After adding CN– (0–2.0 equiv.), the probe displayed an obvious fluorescence enhancement with increasing concentrations of CN– at 570 nm. The fluorescence quantum yield (Φ) of the probe was increased to 28.0% in the presence of CN– (1.0 equiv.), while the fluorescence intensity reached its maximum at 2 equiv. of CN–, with a 15-fold enhancement. Moreover, once the CN– was added, the color of probe solution turned from pale yellow to bright orange under a 365 nm UV lamp. The phenomenon indicated that the probe could easily detect CN– by the “naked eye”. Notably, the fluorescence response is directly in line with the concentration of CN– in the range of 0 to 40 μM, in which I570 = 95.57CCN– + 88.80 (the unit of C is μM, R2 = 0.984) (Figure 4), revealing that the probe can be used in the quantitative testing of CN–. Furthermore, the calculated detection limit was 1.23 μM (S/N = 3, N = 10),43 significantly lower than the allowable limit (1.9 mM) set by WHO. The detection limits of different types of probes are listed in Table 3.
Figure 4.

(A) PL titration experiments of the probe (20 μM) with CN– (0–2.0 equiv.) in an CH3CN and H2O (95/5) mixture at 298 K (λex = 380 nm). Inset: changes of the intensity at 570 nm of the probe with [CN–] and color change from pale yellow to bright orange upon addition of 0–2.0 equiv. of CN–, under a 365 nm handheld UV lamp. (B) Linear calibration curve of I570 vs CN– (0–40 μM).
Table 3. Listed Detection Limits of CN– for Diverse Types of Probes.
Fluorescence Quantum Efficiency
In order to enable both the probe and reference material to be compared in the same situation that all the substances have parallel absorption, we chose 9,10-diphenylanthracene as the method of comparison at 380 nm excitation light to measure the fluorescence quantum efficiency. Photophysical characterization data for the probe are listed in Table 4. The high quantum efficiency showed that the complex has excellent fluorescence properties and has potential applications in biosystems.
Table 4. Photophysical Characterization Data for the Probe.
| compounda | quantum yieldb | λex (nm) | λem (nm) | UV–vis absorption λabs (nm) | DRc |
|---|---|---|---|---|---|
| probe | 0.066 | 380 | 570 | 267, 380 | 4.24 |
| probe + CN– | 0.28 | 380 | 570 | 267, 380 |
20 μM probe in CH3CN/H2O (v/v = 95:5) at 298 K.
Relative fluorescence quantum yield (9,10-iphenylanthracene; Φ = 0.9).
Dynamic range: DR = Φ/Φ0; Φ and Φ0 are the fluorescence quantum yields of the probe-CN– and probe-free.
Effect of Reaction Time
Inspired by the excellent results of the probe to detect CN–, we began to turn the observation to the measurement of reaction time. The optimization results are shown in Figure 5. When the CN– was not added to the system, the PL intensity of the probe remained unchanged (curve a). When added with varying concentrations of CN–, the response time became orderly accelerated (curves b, c, and d). When added with a 1.0 equiv. concentration of CN–, the PL response increased from 20 to 120 s and eventually attained its maximum at 130 s (curve e), indicating that the probe has a great timely response to CN–.
Figure 5.

Reaction process of PL intensity of the probe (20 μM) before and after adding varying concentrations of CN– (a: blank, b: 0.2 equiv., c: 0.5 equiv., d: 0.8 equiv., e: 1.0 equiv. in an CH3CN and H2O (95/5) mixture at 298 K (λex = 380 nm).
Selectivity of the Probe for CN–
To estimate the selectivity conditions of the probe for CN–, a range of possible competitive anions, like Br–, Cl–, I–, NO3–, OAc–, CO32–, NO2–, SO42–, S2O32–, H2PO4–, OH–, SCN–, SO32–, HSO3–, S2–, Cys, HS–, and N3–, were also examined. Even at a higher concentration (100 μM), there was no significant emission intensity change after adding a range of competitive anions covering more nucleophilic ones like SCN–. Moreover, after the cyanide was added, the color change was observed by the naked eye (Figure 6). A remarkable fluorescence enhancement was observed after addition of 40 μM CN– (Figure 7). These results suggested that the phosphorescence changes of the probes were selectively induced by CN–, which could be used to detect CN– without interference from another biological anion.
Figure 6.

PL intensity of the probe (20 μM) with CN– (40 μM) and other anions (100 μM) in an CH3CN and H2O (95/5) mixture at 298 K (λex = 380 nm). Inset: photograph showing the corresponding visual fluorescence change of the probe solution for CN– and other anions, under a 365 nm handheld UV lamp.
Figure 7.
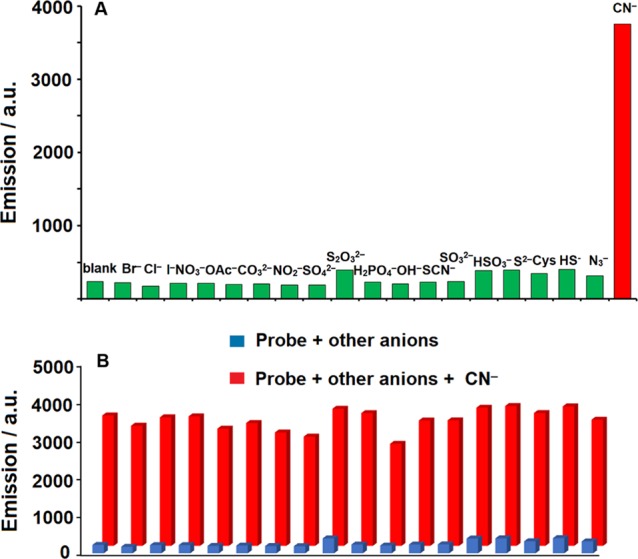
(A) Fluorescence intensity changes of the probe (20 μM) in the presence of 40 μM CN– and 100 μM other anions (Br–, Cl–, I–, NO3–, OAc–, CO32–, NO2–, SO42–, S2O32–, H2PO4–, OH–, SCN–, SO32–, HSO3–, S2–, Cys, HS–, and N3–) in CH3CN/H2O (v/v = 95:5) at 298 K (λex = 380 nm). (B) The blue columns show the emission of the probe to other anions. The red columns show emission of adding CN–.
Recognition Mechanism of the Probe for CN–
To elucidate the possible PL increasing mechanism, the reaction of the probe with cyanide was investigated. The probe and the probe-CN– adduct (in dry DMSO-d6) were dissolved in an NMR tube and then characterized at 25 °C by 1H NMR. After adding 1.0 equiv. of cyanide, there was a remarkable shift disappearance at δ 10.56 ppm belonging to the aldehyde proton (H*) signal, suggesting the occurrence of the cyanide alcoholize reaction at the aldehyde group. Meanwhile, a new peak at δ 8.60 ppm appeared, belonging to the formation of the cyanohydrin proton signal CH(CN)OH(H*). The aldehyde phenanthroline ring proton peaks of the cyclometallated ligand are shifted upfield. The signals for a (9.76 ppm) and c (9.07 ppm) were shifted to 9.869 and 8.529 ppm, respectively; at the same time, the signal for b (9.13 ppm) gradually disappeared and together with d (8.32 ppm) and e (8.25 ppm) to emerge a new signal at 8.17 ppm. In theory, the conjugation would be reduced after the formation of cyanohydrin. Additionally, the signals of phenyl pyridine aromatic protons did not change basically (Figure 8). The mechanism makes clear that one new substance (CH(CN)OH) was created in the reaction.
Figure 8.

1H NMR mechanism of the cyanohydrin species formation. Inset: spectra showing the probe and adding 1.0 equiv. of CN– in DMSO-d6. The asterisks represent the specific proton signals.
The probable formation mechanism of the cyanohydrin substance has been lucubrated based on the above experimental findings and former reports. Upon adding 1.0 equiv. of CN–, aldehyde reacted with cyanide to give the cyanohydrin. The process incorporates three main steps; the electron properties of the aldehyde obtained from the probe make it susceptible to CN– attack on the carbonyl group by forming cyanohydrin. The studies of a similar process were reported previously (Figure 9). Moreover, the data for ESI-HRMS spectra were coincident with 1H NMR spectra. The mass spectra clearly displayed the characteristic peak of resultant cyanohydrin in a 1:1 molar ratio of probe to CN– (Figure S4).
Figure 9.
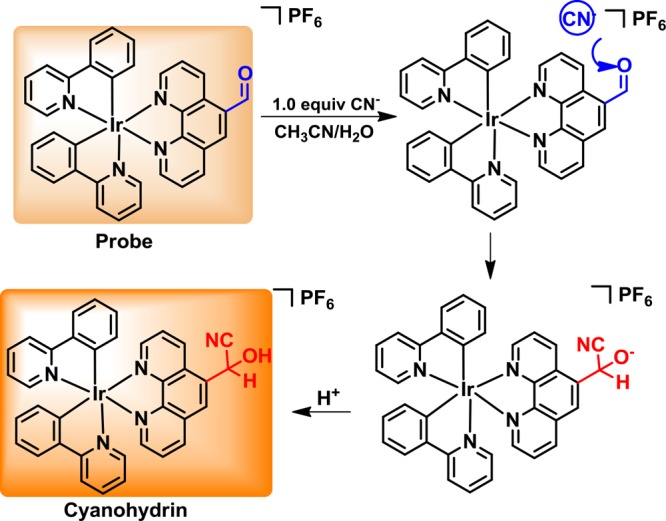
Possible mechanism for the formation process of cyanohydrin.
DFT Theoretical Studies
To further understand the optical physical properties of the complex, density functional theory (DFT) was employed to study the theoretical electronic structures. The molecular orbital chart of the complex is provided in Figure 10. The highest occupied molecular orbital (HOMO) resides principally at the Ir center and the pyridyl part of the cyclometallated ligand, while the lowest unoccupied molecular orbital (LUMO) is essentially located in the 1,10-phenanthroline-5-carboxaldehyde ancillary ligand because of the electron acceptability of substituents and conjugation of the aldehyde group to the phenyl portion. In addition, the energy gap between HOMO and LUMO is 3.01 eV; the partial molecular orbital energy values of the complex are summarized in Table 5.
Figure 10.
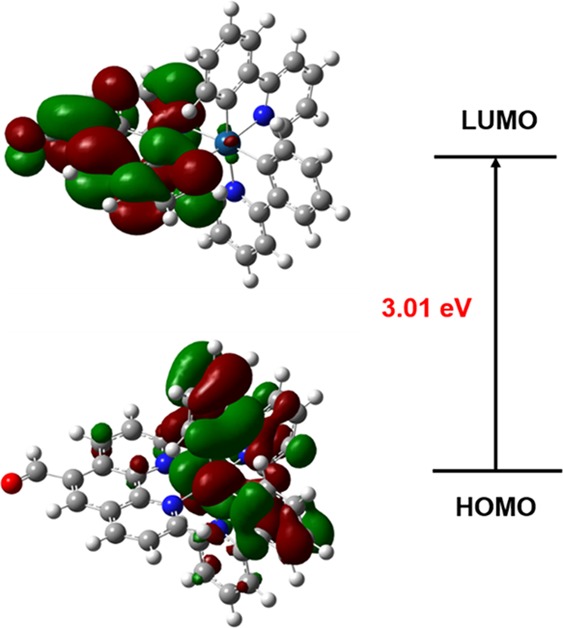
LUMO and HOMO distribution of the complex.
Table 5. Partial Molecular Orbital Energy of the Complex.
| orbital | HOMO – 2 | HOMO – 1 | HOMO | LUMO | LUMO + 1 | LUMO + 2 |
|---|---|---|---|---|---|---|
| energy (eV) | –8.9812 | –8.5008 | –8.3299 | –5.3199 | –5.0689 | –3.9819 |
Fluorescence Imaging of CN– in Living Cells
Besides, we made an inquiry about the ability of the probe to monitor CN– within living cells. Before the research of fluorescence cell imaging, the cytotoxicity of the probe was tested in A549 cells. Cells were dipped to an increasingly proportion of every probe for 24 h, and cell viability was measured through the MTT assay. Results exhibited small cytotoxicity until a concentration of 60 μM incubated for 24 h (Figure 11). Moreover, the cytotoxicity of the probe even at a higher concentration of 100 μM incubated for 8 h was studied. The cell viabilities of the probe were mainly over 80% within 100 μM concentration (Figure 11). These results made clear that the cytotoxicity of the probe in the concentration scope is negligible and was sufficiently appraised for their potential biological imaging applications. After being incubated with a 10 μM probe for 20 h at 37 °C, as shown in Figure 12A, the cells dipped with the probe emerged with feeble PL, indicating that the probe had the ability to permeate the cell membrane. Cells were dipped in 10 μM CN– for 0.5 h; after being incubated in the 10 μM probe for 20 h at 37 °C, the cells had an intense PL emission compared to no added cells (Figure 12B). DIC imaging of the probe expounded that the cells were alive in the whole experiment process. These results suggest that the probe has cellular permeability and could be employed to imaging CN– in living cells.
Figure 11.

Cytotoxicity of the probe; (a) variable proportion of the probe for 24 h; (b) 100 μM probe for different times.
Figure 12.

Confocal fluorescence imaging for A549 cells. (a) Fluorescence images; (b) DIC images of cells shown in panel (a); (c) overlay images. (A) A549 cells were incubated in the 10 μM probe for 20 h at 37 °C. (B) A549 cells were incubated for 0.5 h with 10 μM CN– and then incubated for 20 h in the 10 μM probe at 37 °C (λex = 405 nm, solvent: DMSO/H2O (v/v 1/1000)).
Detection of CN– in Test Strips of Practical Samples
Inspired by the admirable properties of the complex to detect CN–, we developed test strips to apply for the signaling of CN– of practical samples. Test strips (2.0 cm × 2.0 cm) were impregnated with the probe (1 mM in CH3CN/H2O (v/v = 95:5)), affording a filter-paper-based test strip for the sensing of CN–. A drop of (10 μL) variable proportion of CN– (c = 0.5 to 2.0 mM) was placed in probe-impregnated test strips. As displayed in Figure 13, spots of pronounced colors were observed that could be easily discernible to the naked eye and under 365 nm UV excitation. This observation implied that the probe could be used as a preliminary sensing kit by variable proportion of CN– in practical samples and demonstrated the pragmatic application value of the complex infiltrated test strips for in situ immediate cyanide visibility detection.
Figure 13.

Photos of the test strip image under (A) daylight and (B) 365 nm UV excitation of the probe with varying proportions of CN– (c = 0 to 2.0 mM) in CH3CN/H2O (v/v = 95:5).
Conclusions
In conclusion, we described a new type of probe based on the iridium complex for the detection of cyanide. The probe exhibited good sensitivity to CN– in an CH3CN and H2O (95/5) mixture within the 1.23 μM detection limit and timely response. The response of PL is immediately in line with the concentration of CN– from 0 to 2.0 equiv. The PL investigation of other reactive anions proved the great selectivity of the probe for CN–. In addition, upon adding 1.0 equiv. of cyanide, the formation of cyanohydrin was exactly illuminated by 1H NMR, FT-IR, and mass spectral studies. The conspicuous results indicate that the iridium complex has the potential possibility of application in other biosystems related to CN–.
Experimental Section
General Data
All operations were carried out in standard Schlenk techniques under the nitrogen atmosphere. Chemicals were used as commercial products without further purification. The precursor salt of CN– was tetra-n-butylammonium cyanide ([CH3(CH2)3]4N+CN–). 1H NMR and 13C NMR (500 MHz) spectra were measured in a Bruker DMX-500 spectrometer. UV–vis absorption spectra and fluorescence spectra were measured in a UV 765 spectrophotometer and a Hitachi F-4600, respectively. FT-IR spectra were recorded on a Nicolet FT-IR spectrophotometer. [(C^N)2Ir(μ-Cl)]2 was synthetized based on the literature.44
Synthesis of the Iridium(III) Dimer Complex [(C^N)2Ir(μ-Cl)]2
The mixture of 2-phenyl pyridine (2 mmol, 2 equiv.) and IrCl3·3H2O (1 mmol) in 2-ethoxyethanol/water (3/1) mixture (12 mL) in a 50 mL Schlenk tube under a nitrogen atmosphere was heated for 24 h at 120 °C. After cooling, a bright yellow precipitate was filtered and washed with water, ethanol, and n-hexane. The crude product was used in the next reaction without further purification in good yields.
Synthesis of the Iridium Complex
A mixture of the iridium(III) dimer complex [(C^N)2Ir(μ-Cl)]2 (0.1 mmol) and 1,10-phenanthroline-5-carboxaldehyde (0.22 mmol) was stirred at room temperature in 10 mL of dichloromethane and methanol (1/1) mixture overnight under a nitrogen atmosphere. After that, an excess of KPF6 (0.6 mmol) was stirred for 1 h. The crude product was purified by silica gel column chromatography (CH2Cl2:methanol = 30:1) to get the orange iridium complex 1 in moderate yield. 1: orange solid, 78% yield. 1H NMR (500 MHz, DMSO-d6): δ 10.59 (s, 1H), 9.77 (d, J = 7.6 Hz, 1H), 9.15 (s, 1H), 9.10 (d, J = 7.3 Hz, 1H), 8.33 (d, J = 5.0 Hz, 1H), 8.26 (d, J = 8.2 Hz, 3H), 8.15 (dd, J = 8.1, 5.2 Hz, 2H), 7.96 (d, J = 7.6 Hz, 2H), 7.88 (t, J = 7.7 Hz, 2H), 7.50 (dd, J = 12.3, 5.6 Hz, 2H), 7.07 (t, J = 7.2 Hz, 2H), 7.00–6.93 (m, 4H), 6.28 (dd, J = 6.8, 4.5 Hz, 2H). 13C NMR (100 MHz, DMSO-d6): 193.42, 167.24, 153.43, 151.64, 149.82, 148.52, 144.47, 140.81, 139.24, 136.34, 131.71, 130.73, 130.27, 128.68, 128.46, 125.56, 124.33, 122.95, 120.46. Elemental analysis calcd for C35H24F6IrN4OP: C 49.24, H 2.83, N 6.56; found: C 49.31, H 2.75, N 6.52.
FT-IR Spectra
A solution containing 1.0 equiv. of CN– was dropped to a 20 μM solution of iridium complex in CH3CN and was utilized for the FT-IR measurements.
X-ray Crystal
A Bruker Smart APEX CCD diffractometer was used to extract information on the complex by graphite-monochromated Mo Kα radiation (λ = 0.71073 Å). Data were recorded at ambient temperature, and the direct methods were applied for the structure, which was optimized in F2 through SHELXL.45 Absorption correction was performed using SADABS.46 All non-hydrogen atoms were refined anisotropically. The positions of hydrogen atoms were computed. The Bruker program Smart was used for all calculations.
Theoretical Calculations
The computational method was applied using the Gaussian 03 program package on account of density functional theory (DFT). The B3LYP was adopted for the optimization of the complex structure. The LANL2DZ and 3-21G* basis sets were adopted to analyze the Ir atom and the rest of the atoms.47 In order to comprehend the properties of the excited state, the contours of the HOMO and LUMO orbitals were plotted.
Cell Culture
The A549 cells were placed in glass Petri dishes in a density of 80,000 cells per dish and then cultured in the RPMI Medium 1640 replenished with 10% FBS, 100 units/mL penicillin, and 100 μg/mL streptomycin for 20 h at 37 °C in CO2/air (5:95). The probe (10 μM) was appended to the unit milieu and preincubated in DMSO/H2O (v/v = 1:1000) for 4 h, and then tetrabutylammonium cyanide (10 μM) was added and incubated for 0.5 h. After incubation for the corresponding time, the cells were washed with PBS to wipe off the dissociative compound and ions before analysis. Fluorescence imaging was executed by a confocal microscope (LSM 880). For the probe channel, the excited wavelength was 405 nm, while the emission wavelength was collected in the range of 550–650 nm.
Acknowledgments
The work was supported by the National Natural Science Foundation of China (Nos. 21601125 and 51974001), the Chenguang Scholar of Shanghai Municipal Education Commission (No. 16CG64 and 18CG67), Natural Science Foundation of Shanghai (No. 16ZR1435700), the Shanghai Gaofeng & Gaoyuan Project for University Academic Program Development, and the Industry Catalysis Funding of Shanghai Institute of Technology (CHJJ-2).
Supporting Information Available
The Supporting Information is available free of charge at https://pubs.acs.org/doi/10.1021/acsomega.9b04364.
The authors declare no competing financial interest.
Notes
CCDC 1912756 contains the supplementary crystallographic data for this paper. These data can be obtained free of charge via www.ccdc.cam.ac.uk/data_request/cif
Supplementary Material
References
- Ma L.-L.; An Y.-Y.; Sun L.-Y.; Wang Y.-Y.; Hahn F. E.; Han Y.-F. Supramolecular Control of Photocycloadditions in Solution: In Situ Stereoselective Synthesis and Release of Cyclobutanes. Angew. Chem., Int. Ed. 2019, 58, 3986–3991. 10.1002/anie.201900221. [DOI] [PubMed] [Google Scholar]
- Wang Y.-S.; Feng T.; Wang Y.-Y.; Hahn F. E.; Han Y.-F. Homo and Heteroligand Poly-NHC Metal Assemblies: Synthesis by Narcissistic and Social Self-Sorting. Angew. Chem., Int. Ed. 2018, 57, 15767–15771. 10.1002/anie.201810010. [DOI] [PubMed] [Google Scholar]
- Gan M.-M.; Liu J.-Q.; Zhang L.; Wang Y.-Y.; Hahn F. E.; Han Y.-F. Preparation and Post-Assembly Modification of Metallosupramolecular Assemblies from Poly(N-Heterocyclic Carbene) Ligands. Chem. Rev. 2018, 118, 9587–9641. 10.1021/acs.chemrev.8b00119. [DOI] [PubMed] [Google Scholar]
- Sun L.-Y.; Sinha N.; Yan T.; Wang Y.-S.; Tan T. T. Y.; Yu L.; Han Y.-F.; Hahn F. E. Template Synthesis of Three-Dimensional Hexakisimidazolium Cages. Angew. Chem., Int. Ed. 2018, 57, 5161–5165. 10.1002/anie.201713240. [DOI] [PubMed] [Google Scholar]
- Zhang W.-Y.; Lin Y.-J.; Han Y.-F.; Jin G.-X. Facile Separation of Regioisomeric Compounds by a Heteronuclear Organometallic Capsule. J. Am. Chem. Soc. 2016, 138, 10700–10707. 10.1021/jacs.6b06622. [DOI] [PubMed] [Google Scholar]
- Ma D.-L.; Chan D. S.-H.; Leung C.-H. Group 9 organometallic compounds for therapeutic and bioanalytical applications. Acc. Chem. Res. 2014, 47, 3614–3631. 10.1021/ar500310z. [DOI] [PubMed] [Google Scholar]
- He L.; Liao S.-Y.; Tan C.-P.; Lu Y.-Y.; Xu C.-X.; Ji L.-N.; Mao Z.-W. Cyclometalated iridium(III)-β-carboline complexes as potent autophagy-inducing agents. Chem. Commun. 2014, 50, 5611–5614. 10.1039/c4cc01461h. [DOI] [PubMed] [Google Scholar]
- Lu L.; Wang M.; Liu L.-J.; Leung C.-H.; Ma D.-L. Label-Free Luminescent Switch-On Probe for Ochratoxin A Detection Using a G-Quadruplex-Selective Iridium(III) Complex. ACS Appl. Mater. Interfaces 2015, 7, 8313–8318. 10.1021/acsami.5b01702. [DOI] [PubMed] [Google Scholar]
- Song X.; Qian Y.; Ben R.; Lu X.; Zhu H.-L.; Chao H.; Zhao J. Activation of C-H Bonds in Nitrones Leads to Iridium Hydrides with Antitumor Activity. J. Med. Chem. 2013, 56, 6531–6535. 10.1021/jm4004973. [DOI] [PubMed] [Google Scholar]
- Mahapatra A. K.; Maji R.; Maiti K.; Adhikari S. S.; Mukhopadhyay C. D.; Mandal D. Ratiometric sensing of fluoride and acetate anions based on a BODIPY-azaindole platform and its application to living cell imaging. Analyst 2014, 139, 309–317. 10.1039/C3AN01663C. [DOI] [PubMed] [Google Scholar]
- Liu T.; Zhang H.-X.; Zhou X.; Zheng Q.-C.; Xia B.-H.; Pan Q.-J. Mechanism of Ir(ppy)2(N^N)+ (N^N = 2-Phenyl-1H-imidazo[4,5-f][1,10]phenanthroline) Sensor for F–, CF3COOH, and CH3COO–: Density Functional Theory and Time-Dependent Density Functional Theory Studies. J. Phys. Chem. A 2008, 112, 8254–8262. 10.1021/jp803996y. [DOI] [PubMed] [Google Scholar]
- Zhao Q.; Li F.; Liu S.; Yu M.; Liu Z.; Yi T.; Huang C. Highly Selective Phosphorescent Chemosensor for Fluoride Based on an Iridium(III) Complex Containing Arylborane Units. Inorg. Chem. 2008, 47, 9256–9264. 10.1021/ic800500c. [DOI] [PubMed] [Google Scholar]
- a Ho M.-L.; Lin M.-H.; Chen Y.-T.; Sheu H.-S. Iridium(III) Complexes in discs for two–photon excitation applications. Chem. Phys. Lett. 2011, 509, 162–168. 10.1016/j.cplett.2011.05.003. [DOI] [Google Scholar]; b Xu W. J.; Liu S. J.; Zhao X.; Zhao N.; Liu Z. Q.; Xu H.; Liang H.; Zhao Q.; Yu X. Q.; Huang W. Synthesis, One–and Two–Photon Photophysical and Excited–State Properties, and Sensing Application of a New Phosphorescent Dinuclear Cationic Iridium(III) Complex. Chem. – Eur. J. 2013, 19, 621–629. 10.1002/chem.201202827. [DOI] [PubMed] [Google Scholar]; c Chen X.; Sun L.; Chen Y.; Cheng X.; Wu W.; Ji L.; Chao H. A fast and selective two–photon phosphorescent probe for the imaging of nitric oxide in mitochondria. Biomaterials 2015, 58, 72–81. 10.1016/j.biomaterials.2015.04.012. [DOI] [PubMed] [Google Scholar]; d Edkins R. M.; Bettington S. L.; Goeta A. E.; Beeby A. Two–photon spectroscopy of cyclometalated iridium complexes. Dalton Trans. 2011, 40, 12765–12770. 10.1039/c1dt11164g. [DOI] [PubMed] [Google Scholar]; e Natrajan L. S.; Toulmin A.; Chew A.; Magennis S. W. Two-photon luminescence from polar bis-terpyridyl-stilbene derivatives of Ir(III) and Ru(II). Dalton Trans. 2010, 39, 10837–10846. 10.1039/c0dt00750a. [DOI] [PubMed] [Google Scholar]; f Li G.; Lin Q.; Sun L.; Feng C.; Zhang P.; Yu B.; Chen Y.; Wen Y.; Wang H.; Ji L.; Chao H. A mitochondrial targeted two–photon iridium(III) phosphorescent probe for selective detection of hypochlorite in live cells and in vivo. Biomaterials 2015, 53, 285–295. 10.1016/j.biomaterials.2015.02.106. [DOI] [PubMed] [Google Scholar]
- a Kim K.-Y.; Farley R.-T.; Schanze K. S. An Iridium(III) Complex that Exhibits Dual Mechanism Nonlinear Absorption. J. Phys. Chem. B. 2006, 110, 17302–17304. 10.1021/jp063916m. [DOI] [PubMed] [Google Scholar]; b Anzenbacher P.; Tyson D. S.; Jursíková K.; Castellano F. N. Luminescence Lifetime-Based Sensor for Cyanide and Related Anions. J. Am. Chem. Soc. 2002, 124, 6232–6233. 10.1021/ja0259180. [DOI] [PubMed] [Google Scholar]; c Upendar Reddy G.; Das P.; Saha S.; Baidya M.; Ghosh S. K.; Das A. A CN– specific turn-on phosphorescent probe with probable application for enzymatic assay and as an imaging reagent. Chem. Commun 2013, 49, 255–257. 10.1039/C2CC37243F. [DOI] [PubMed] [Google Scholar]; d Duan J. P.; Sun P. P.; Cheng C. H. New Iridium Complexes as Highly Efficient Orange–Red Emitters in Organic Light-Emitting Diodes. Adv. Mater. 2003, 15, 224. 10.1002/adma.200390051. [DOI] [Google Scholar]
- Jana A.; Baggaley E.; Amoroso A.; Ward M. D. A new ligand skeleton for imaging applications with d–f complexes: combined lifetime imaging and high relaxivity in an Ir/Gd dyad. Chem. Commun. 2015, 51, 8833–8836. 10.1039/C5CC02130H. [DOI] [PubMed] [Google Scholar]
- Baggaley E.; Cao D.-K.; Sykes D.; Botchway S. W.; Weinstein J. A.; Ward M. D. Corrigendum: Combined Two-Photon Excitation and d→f Energy Transfer in a Water-Soluble IrIII/EuIII Dyad: Two Luminescence Components from One Molecule for Cellular Imaging. Chem. – Eur. J. 2014, 20, 17242. 10.1002/chem.201406254. [DOI] [PMC free article] [PubMed] [Google Scholar]
- Murphy L.; Congreve A.; Pålsson L.-O.; Williams J. A. G. The time domain in co-stained cell imaging: time-resolved emission imaging microscopy using a protonatable luminescent iridium complex. Chem. Commun. 2010, 46, 8743–8745. 10.1039/c0cc03705b. [DOI] [PubMed] [Google Scholar]
- a Chen Z.-Q.; Bian Z.-Q.; Huang C.-H. Functional IrIII Complexes and Their Applications. Adv. Mater. 2010, 22, 1534–1539. 10.1002/adma.200903233. [DOI] [PubMed] [Google Scholar]; b Licini M.; Gareth Williams J. A. Iridium(III) bis-terpyridine complexes displaying long-lived pH sensitive luminescence. Chem. Commun. 1999, 1943–1944. 10.1039/A906203C. [DOI] [Google Scholar]; c Guerchais V.; Fillaut J.-L. Sensory luminescent iridium(III) and platinum(II) complexes for cation recognition. Coord. Chem. Rev. 2011, 255, 2448–2457. 10.1016/j.ccr.2011.04.006. [DOI] [Google Scholar]; d Zhou G.; Wong W.-Y.; Yao B.; Xie Z.; Wang L. Triphenylamine-Dendronized Pure Red Iridium Phosphors with Superior OLED Efficiency/Color Purity Trade-Offs. Angew. Chem., Int. Ed. 2007, 46, 1149–1151. 10.1002/anie.200604094. [DOI] [PubMed] [Google Scholar]
- a Wang L.; Li L.; Cao D. Synthesis, photoluminescence, chromogenic and fluorogenic discrimination of fluoride and cyanide based on a triphenylamine-tri(2-formyl BODIPY) conjugate. Sensors and Actuators B: Chemical. 2017, 241, 1224–1234. 10.1016/j.snb.2016.10.007. [DOI] [Google Scholar]; b Yang X.; Zhou G.; Wong W.-Y. Functionalization of phosphorescent emitters and their host materials by main-group elements for phosphorescent organic light-emitting devices. Chem. Soc. Rev. 2015, 44, 8484–8575. 10.1039/C5CS00424A. [DOI] [PubMed] [Google Scholar]
- a Keefe M. H.; Benkstein K. D.; Hupp J. T. Luminescent sensor molecules based on coordinated metals: a review of recent developments. Coord. Chem. Rev. 2000, 205, 201–228. 10.1016/S0010-8545(00)00240-X. [DOI] [Google Scholar]; b Zhao Q.; Li F.; Huang C. Phosphorescent chemosensors based on heavy-metal complexes. Chem. Soc. Rev. 2010, 39, 3007–3030. 10.1039/b915340c. [DOI] [PubMed] [Google Scholar]; c Demas J. N.; DeGraff B. A. Applications of luminescent transition platinum group metal complexes to sensor technology and molecular probes. Coord. Chem. Rev. 2001, 211, 317–351. 10.1016/S0010-8545(00)00278-2. [DOI] [Google Scholar]
- Fan C.; Zhu L.; Liu T.; Jiang B.; Ma D.; Qin J.; Yang C. Using an Organic Molecule with Low Triplet Energy as a Host in a Highly Efficient Blue Electrophosphorescent Device. Angew. Chem. 2014, 126, 2179–2183. 10.1002/ange.201308046. [DOI] [PubMed] [Google Scholar]
- Zammit E. M.; Barnett N. W.; Henderson L. C.; Dyson G. A.; Zhou M.; Francis P. S. Green chemiluminescence from a bis-cyclometalated iridium(III) complex with an ancillary bathophenanthroline disulfonate ligand. Analyst 2011, 136, 3069–3072. 10.1039/c1an15315c. [DOI] [PubMed] [Google Scholar]
- Mao Z.; Wang M.; Liu J.; Liu L.-J.; Lee S. M.-Y.; Leung C.-H.; Ma D.-L. A long lifetime switch-on iridium(III) chemosensor for the visualization of cysteine in live zebrafish. Chem. Commun. 2016, 52, 4450–4453. 10.1039/C6CC01008C. [DOI] [PubMed] [Google Scholar]
- Fan C.; Yang C. Yellow/orange emissive heavy-metal complexes as phosphors in monochromatic and white organic light-emitting devices. Chem. Soc. Rev. 2014, 43, 6439–6469. 10.1039/C4CS00110A. [DOI] [PubMed] [Google Scholar]
- Leung K.-H.; He H.-Z.; He B.; Zhong H.-J.; Lin S.; Wang Y.-T.; Ma D.-L.; Leung C.-H. Label-free luminescence switch-on detection of hepatitis C virus NS3 helicase activity using a G-quadruplex-selective probe. Chem. Sci. 2015, 6, 2166–2171. 10.1039/C4SC03319A. [DOI] [PMC free article] [PubMed] [Google Scholar]
- Zhang G.; Zhang H.; Gao Y.; Tao R.; Xin L.; Yi J.; Li F.; Liu W.; Qiao J. Near-Infrared-Emitting Iridium(III) Complexes as Phosphorescent Dyes for Live Cell Imaging. Organometallics 2014, 33, 61–68. 10.1021/om400676h. [DOI] [Google Scholar]
- Dong Y.-M.; Peng Y.; Dong M.; Wang Y.-W. A Selective, Sensitive, and Chromogenic Chemodosimeter for Cyanide Based on the 1,1′-Binaphthyl Scaffold. J. Org. Chem. 2011, 76, 6962–6966. 10.1021/jo201269e. [DOI] [PubMed] [Google Scholar]
- a Chi Y.; Chou P.-T. Transition-metal phosphors with cyclometalating ligands: fundamentals and applications. Chem. Soc. Rev. 2010, 39, 638–655. 10.1039/B916237B. [DOI] [PubMed] [Google Scholar]; b Chen H.; Zhao Q.; Wu Y.; Li F.; Yang H.; Yi T.; Huang C. Selective Phosphorescence Chemosensor for Homocysteine Based on an Iridium(III) Complex. Inorg. Chem. 2007, 46, 11075–11081. 10.1021/ic7010887. [DOI] [PubMed] [Google Scholar]; c You Y.; Cho S.; Nam W. Cyclometalated Iridium(III) Complexes for Phosphorescence Sensing of Biological Metal Ions. Inorg. Chem. 2014, 53, 1804–1815. 10.1021/ic4013872. [DOI] [PubMed] [Google Scholar]
- Kulig K. W.Cyanide Toxicity; U.S. Department of Health and Human Services: Atlanta, GA,1991. [Google Scholar]
- Takano R. The Treatment of Leprosy with Cyanocuprol. J. Exp. Med. 1916, 24, 207–211. 10.1084/jem.24.2.207. [DOI] [PMC free article] [PubMed] [Google Scholar]
- Khatua S.; Samanta D.; Bats J. W.; Schmittel M. Rapid and Highly Sensitive Dual-Channel Detection of Cyanide by Bis-heteroleptic Ruthenium(II) Complexes. Inorg. Chem. 2012, 51, 7075–7086. 10.1021/ic2022853. [DOI] [PubMed] [Google Scholar]
- (a) Taylor J.; Roney N.; Fransen M. E.; Swarts S.. Toxicological Profile for Cyanide; Diane Publishing: Atlanta, GA, 2006. [Google Scholar]; (b) Vennesland B.; Comm E. E.; Knownles C. J.; Westly J.; Wissing F.. Cyanide in Biology; Academic Press: London, 1981. [Google Scholar]; c Lee K.-S.; Kim H.-J.; Kim G.-H.; Shin I.; Hong J.-I. Fluorescent Chemodosimeter for Selective Detection of Cyanide in Water. Org. Lett. 2008, 10, 49–51. 10.1021/ol7025763. [DOI] [PubMed] [Google Scholar]
- a Dong M.; Peng Y.; Dong Y.-M.; Tang N.; Wang Y.-W. A Selective, Colorimetric, and Fluorescent Chemodosimeter for Relay Recognition of Fluoride and Cyanide Anions Based on 1,1′-Binaphthyl Scaffold. Org. Lett. 2012, 14, 130–133. 10.1021/ol202926e. [DOI] [PubMed] [Google Scholar]; b Sessler J. L.; Cho D.-G. The Benzil Rearrangement Reaction: Trapping of a Hitherto Minor Product and Its Application to the Development of a Selective Cyanide Anion Indicator. Org. Lett. 2008, 10, 73–75. 10.1021/ol7027306. [DOI] [PubMed] [Google Scholar]; c Cho D.-G.; Kim J. H.; Sessler J. L. The Benzil–Cyanide Reaction and Its Application to the Development of a Selective Cyanide Anion Indicator. J. Am. Chem. Soc. 2008, 130, 12163–12167. 10.1021/ja8039025. [DOI] [PubMed] [Google Scholar]; d Madhu S.; Basu S. K.; Jadhav S.; Ravikanth M. 3,5-Diformyl-borondipyrromethene for selective detection of cyanide anion. Analyst 2013, 138, 299–306. 10.1039/C2AN36407G. [DOI] [PubMed] [Google Scholar]; e Wang F.; Wang L.; Chen X.; Yoon J. Recent progress in the development of fluorometric and colorimetric chemosensors for detection of cyanide ions. Chem. Soc. Rev. 2014, 43, 4312–4324. 10.1039/c4cs00008k. [DOI] [PubMed] [Google Scholar]
- a Wang L.; Li L.; Cao D. A BODIPY-based dye with red fluorescence in solid state and used as a fluorescent and colorimetric probe for highly selective detection of cyanide. Sens. Actuators, B 2017, 239, 1307–1317. 10.1016/j.snb.2016.09.112. [DOI] [Google Scholar]; b Wang L.; Chen X.; Cao D. A cyanide-selective colorimetric “naked-eye” and fluorescent chemosensor based on a diketopyrrolopyrrole–hydrazone conjugate and its use for the design of a molecular-scale logic device. RSC Adv. 2016, 6, 96676–96685. 10.1039/C6RA21669B. [DOI] [Google Scholar]
- a Hua Y.-X.; Shao Y.; Wang Y.-W.; Peng Y. A Series of Fluorescent and Colorimetric Chemodosimeters for Selective Recognition of Cyanide Based on the FRET Mechanism. J. Org. Chem. 2017, 82, 6259–6267. 10.1021/acs.joc.7b00850. [DOI] [PubMed] [Google Scholar]; b Miyaji H.; Sessler J. L. Off-the-Shelf Colorimetric Anion Sensors. Angew. Chem., Int. Ed. 2001, 40, 154–157. . [DOI] [PubMed] [Google Scholar]
- Xu Z.; Pan J.; Spring D. R.; Cui J.; Yoon J. Ratiometric fluorescent and colorimetric sensors for Cu2+ based on 4,5-disubstituted-1,8-naphthalimide and sensing cyanide via Cu2+ displacement approach. Tetrahedron 2010, 66, 1678–1683. 10.1016/j.tet.2010.01.008. [DOI] [Google Scholar]
- Chang W.-C.; Hu A. T.; Duan J.-P.; Rayabarapu D.-K.; Cheng C.-H. Color tunable phosphorescent light-emitting diodes based on iridium complexes with substituted 2-phenylbenzothiozoles as the cyclometalated ligands. J. Organomet. Chem. 2004, 689, 4882. 10.1016/j.jorganchem.2004.07.003. [DOI] [Google Scholar]
- Tani K.; Fujii H.; Mao L.; Sakurai H.; Hirao T. Iridium(III) Complexes Bearing Quinoxaline Ligands with Efficient Red Luminescence Properties. Bull. Chem. Soc. Jpn. 2007, 80, 783–788. 10.1246/bcsj.80.783. [DOI] [Google Scholar]
- Chen H.-Y.; Yang C.-H.; Chi Y.; Cheng Y.-M.; Yeh Y.-S.; Chou P.-T.; Hsieh H.-Y.; Liu C.-S.; Peng S.-M.; Lee G.-H. Room-Temperature Nir Phosphorescence of New Iridium (III) Complexes with Ligands Derived from Benzoquinoxaline. Can. J. Chem. 2006, 84, 309–318. 10.1139/v05-253. [DOI] [Google Scholar]
- Lamansky S.; Djurovich P.; Murphy D.; Abdel-Razzaq F.; Lee H.-E.; Adachi C.; Burrows P. E.; Forrest S. R.; Thompson M. E. Highly Phosphorescent Bis-Cyclometalated Iridium Complexes: Synthesis, Photophysical Characterization, and Use in Organic Light Emitting Diodes. J. Am. Chem. Soc. 2001, 123, 4304–4312. 10.1021/ja003693s. [DOI] [PubMed] [Google Scholar]
- Gao H.; Qi H.; Peng Y.; Qi H.; Zhang C. Rapid “turn-on” photoluminescence detection of bisulfite in wines and living cells with a formyl bearing bis-cyclometalated Ir(III) complex. Analyst 2018, 143, 3670–3676. 10.1039/C8AN00640G. [DOI] [PubMed] [Google Scholar]
- Otsuki J.; Tsujino M.; Iizaki T.; Araki K.; Seno M.; Takatera K.; Watanabe T. Redox-Responsive Molecular Switch for Intramolecular Energy Transfer. J. Am. Chem. Soc. 1997, 119, 7895–7896. 10.1021/ja970386m. [DOI] [Google Scholar]
- Bejoymohandas K. S.; Kumar A.; Sreenadh S.; Varathan E.; Varughese S.; Subramanian V.; Reddy M. L. P. A Highly Selective Chemosensor for Cyanide Derived from a Formyl-Functionalized Phosphorescent Iridium(III) Complex. Inorg. Chem. 2016, 55, 3448–3461. 10.1021/acs.inorgchem.5b02885. [DOI] [PubMed] [Google Scholar]
- a Zhou Y.; Gao H.; Wang X.; Qi H. Electrogenerated Chemiluminescence from Heteroleptic Iridium(III) Complexes with Multicolor Emission. Inorg. Chem. 2015, 54, 1446–1453. 10.1021/ic502444k. [DOI] [PubMed] [Google Scholar]; b Woo H.; Cho S.; Han Y.; Chae W.-S.; Ahn D.-R.; You Y.; Nam W. Synthetic Control Over Photoinduced Electron Transfer in Phosphorescence Zinc Sensors. J. Am. Chem. Soc. 2013, 135, 4771–4787. 10.1021/ja3123202. [DOI] [PubMed] [Google Scholar]
- Sheldrick G. M.SHELXL-97, Program for the Refinement of Crystal Structures, Universität Gtötingen: Germany, 1997. [Google Scholar]
- Sheldrick G. M.SADABS (2.01), Bruker/Siemens Area Detector Absorption Correction Program; Bruker AXS: Madison, WI, 1998. [Google Scholar]
- a Lee C.; Yang W.; Parr R. G. Development of the Colle-Salvetti correlation-energy formula into a functional of the electron density. Phys. Rev. B 1988, 37, 785. 10.1103/PhysRevB.37.785. [DOI] [PubMed] [Google Scholar]
Associated Data
This section collects any data citations, data availability statements, or supplementary materials included in this article.