

Abstract
Background
Direct comparisons between Guardant360 (G360) circulating tumor DNA (ctDNA) and FoundationOne (F1) tumor biopsy genomic profiling in metastatic colorectal cancer (mCRC) are limited. We aim to assess the concordance across overlapping genes tested in both F1 and G360 in patients with mCRC.
Materials and Methods
We retrospectively analyzed 75 patients with mCRC who underwent G360 and F1 testing. We evaluated the concordance among gene mutations tested by both G360 and F1 among three categories of patients: untreated, treated without, and treated with EGFR inhibitors, while considering the clonal and/or subclonal nature of each genomic alteration.
Results
There was a high rate of concordance in APC, TP53, KRAS, NRAS, and BRAF mutations in the treatment‐naive and non–anti‐EGFR‐treated cohorts. There was increased discordance in the anti‐EGFR treated patients in three drivers of anti‐EGFR resistance: KRAS, NRAS, and EGFR somatic mutations. Based on percentage of ctDNA, discordant somatic mutations were mostly subclonal instead of clonal and may have limited clinical significance. Most discordant amplifications noted on G360 showed the magnitude below the top decile, occurred in all three cohorts of patients, and were of unknown clinical significance. Serial ctDNA in anti‐EGFR treated patients showed the emergence of multiple new alterations that affected the EGFR pathway: EGFR and RAS mutations and MET, RAS, and BRAF amplifications.
Conclusion
G360 Next‐Generation Sequencing platform may be used as an alternative to F1 to detect targetable somatic alterations in non–anti‐EGFR treated mCRC, but larger prospective studies are needed to further validate our findings.
Implications for Practice
Genomic analysis of tissue biopsy is currently the optimal method for identifying DNA genomic alterations to help physicians target specific genes but has many disadvantages that may be mitigated by a circulating free tumor DNA (ctDNA) assay. This study showed a high concordance rate in certain gene mutations in patients who were treatment naive and treated with non–anti‐EGFR therapy prior to ctDNA testing. This suggests that ctDNA genomic analysis may potentially be used as an alternative to tumor biopsy to identify appropriate patients for treatment selection in mCRC, but larger prospective studies are needed to further validate concordance among tissue and ctDNA tumor profiling.
Keywords: Concordance, Colorectal cancer, Circulating tumor DNA, EGFR, NGS
Short abstract
This article compares the concordance rate of driver mutations and other significant genomic alterations between the FoundationOne assay (F1) for tissue biopsies and Guardant360 (G360) circulating tumor DNA, focusing on therapeutic implications for patients with metastatic colorectal cancer, based on the two commonly applied tumor next‐generation sequencing platforms.
Introduction
Treatment of metastatic colorectal cancer (mCRC) has advanced substantially over the past 20 years, as new therapeutic strategies have markedly improved both response rate (RR) and overall survival (OS). Yet, despite these advancements, 5‐year survival remains less than 10% 1. A novel treatment strategy is targeting genomic alterations with therapeutic agents within an appropriate time frame as the tumor genomic profile evolves 2. At present, genomic analysis of tissue biopsy is the optimal method for identifying DNA genomic alterations in tumors using next‐generation sequencing (NGS). One such example is FoundationOne (F1) assay, which uses NGS on tissue biopsies to provide physicians with a genomic profile of abnormalities in more than 300 genes for the identification of actionable mutations 3. However, there are several disadvantages with tissue biopsies, including the invasive nature of the procedure, the technical difficulty of obtaining the biopsy sample, and the time and financial cost of such procedures. Furthermore, certain cases, such as metastatic disease, often have actionable molecular alterations across multiple sites that would be difficult to access through a single tissue biopsy 2, 4, 5. In addition, the heterogeneity within a tumor can lead to undetected DNA genomic alterations via tissue biopsy 4, 6, 7, 8. Thus, to mitigate these issues, development of a noninvasive assay would be ideal to characterize baseline tumor mutations and new mutations that develop during treatment. Published clinical data shows that the presence of circulating tumor cells detected in peripheral blood can be a strong prognostic factor in patients with mCRC 9, 10. However, complementary platforms that can be used to detect genetic mutations over time with the goal of monitoring clonal and subclonal evolution of tumor heterogeneity, along with response to therapy, would help to personalize therapies for patients.
A noninvasive alternative that is emerging in response to the problems previously listed is the circulating tumor cell‐free DNA (ctDNA) assay, which evaluates tumor genomic alterations by utilizing a peripheral blood sample. This method retains the advantages of identifying mutations that are targetable by drugs, providing prognostic data, and capturing molecular and genetic heterogeneity. Additionally, ctDNA assays can be easily conducted, are less costly, and circumvent the delay associated with a tissue biopsy 11. Serial collection of ctDNA assays may become a more convenient method in detecting response to treatment and development of resistance 12.
Additionally, plasma levels of ctDNA have been shown to be higher in patients with metastatic disease than those at earlier stages 13. Studies have demonstrated that the presence of ctDNA could serve as a prognostic factor and support the notion of using ctDNA as a biomarker of minimal residual disease. For example, a study conducted by Cassinotti et al. reported that after primary resection, the concentration of ctDNA significantly decreased but, remarkably, increased in patients with relapsed disease 14.
The value of genomic profiling assays in defining treatment algorithms for mCRC has been well defined. For example, the presence of an activating mutation in the KRAS or NRAS genes, as well as the BRAF gene, has been associated with no clinically significant benefit or even harm with anti‐EGFR therapy 15. Consequently, the emergence of NGS has allowed clinicians to identify optimal candidates for anti‐EGFR therapy by excluding patients with RAS and BRAF mutations. Additionally, patients initially sensitive to anti‐EGFR therapy go on to develop resistance. Resistance to anti‐EGFR therapy occurs primarily through constitutive activation of the EGFR downstream signaling pathway either through genomic alterations in the RAS/RAF, MEK, PIK3CA/PTEN, and JAK/STAT pathways or through the activation of other growth factor receptors, including IGF1R, HER2, and MET 16. Mechanisms of resistance to anti‐EGFR therapy can also be identified through NGS 15. However, at present, additional clinical data are needed to establish if NGS data obtained from ctDNA assays is concordant with NGS data obtained from tissue biopsies, particularly with assays that are used widely in clinical practice. The primary objective of this study is to systematically assess the concordance rate of driver mutations as well as other significant genomic alterations between F1 tissue biopsies and Guardant360 (G360) ctDNA within the same patients with mCRC. We discuss the therapeutic implication for mCRC based on the two commonly applied tumor NGS platforms.
Materials and Methods
Study Design and Patients
The institutional review board (IRB) of the City of Hope National Cancer Center approved this retrospective study (IRB no. 14361). One hundred and fifteen patients with mCRC and available commercial ctDNA NGS testing with G360 were identified. Out of these, 40 patients were excluded as they either did not have a corresponding F1 test available or had disqualified reports because of insufficient sampling or “report failure.”
The final sample included 75 patients with mCRC who had both G360 and F1 test reports available for analysis. Clinical and tumor characteristics were obtained retrospectively via patient chart review. The study population was further divided into three cohorts. The first cohort (n = 17) consisted of an untreated group of patients who had both F1 tissue biopsy and G360 ctDNA testing at the same time prior to the initiation of treatment. The second group of patients (n = 34) received previous systemic treatment without EGFR inhibitors and with progression at the time of G360 testing. Finally, the third group (n = 24) consisted of patients who were treated with anti‐EGFR inhibitors prior to G360 testing.
Concordant Analysis
We examined all genetic alterations that were detected on both F1 and G360. The number of alterations tested on F1 ranged from 252 to 283, whereas the number of alterations tested on G360 ranged from 46 to 54. Therefore, for the purpose of our analysis, concordance was only studied in the 46–54 alterations that were reported on both platforms for a particular individual. Concordance was defined at the gene level as identical mutations that were identified on both platforms or if there was an absence of any mutations identified in either platform (wild‐type/wild‐type). Partial concordance was defined as when different variations of alterations were identified by both platforms in addition to at least one identical mutation being identified by both platforms. Concordance was then further subdivided into somatic and amplification concordance.
Discordance at the gene level was defined as when different genetic alterations were present on both platforms with no common alteration on either platform. Discordance was also further subcharacterized into somatic and amplification discordance.
Comparison of Clonal and Subclonal Mutations
We then evaluated the clonal versus subclonal landscape of mutation variants detected in the mCRC ctDNA cohort. A mutation was defined as “subclonal” if the mutant allele frequency (MAF) was less than 25% of the highest MAF in the sample and was defined as “clonal” if it was above this threshold 17.
Serial ctDNA Testing
Eleven patients with serial G360 assays that were obtained either at the time of disease progression or to assess response to therapy were further studied for understanding patterns of resistance and the utility of obtaining serial testing for assessing response to therapy. Of these 11 patients, none were from the untreated group, 2 were from the treated group without anti‐EGFR, and 9 were from the anti‐EGFR treated group.
Statistical Analysis
Sensitivity, specificity, and diagnostic accuracy (effectiveness) analyses were performed across four driver genomic alterations (NRAS, KRAS, BRAF, and HER2) in the sample. Youden's J index was calculated as an indirect measurement of concordance and used as an alternative method of reflecting diagnostic accuracy 18.
Results
Patient Characteristics
Patient and tumor characteristics in all 3 groups of patients (n = 75) are listed in Table 1. The majority of patients were white (41.3%) and male (60%). There were 17 patients in the untreated group, 34 patients in the treated without anti‐EGFR therapy group, and 24 patients in the treated with anti‐EGFR therapy group prior to their initial G360 testing.
Table 1.
Baseline characteristics of patients with metastatic colon cancer
| Characteristics | Total (n = 75) | Untreated (n = 17) | Treated without EGFR inhibitor (n = 34) | Treated with EGFR inhibitor (n = 24) | p valuea |
|---|---|---|---|---|---|
| Median age (range) | 56 (20–94) | 61 (44–92) | 56 (20–94) | 50 (33–73) | .01 |
| Gender, n (%) | .33 | ||||
| Male | 45 (60) | 8 (47) | 20 (59) | 17 (71) | |
| Female | 30 (40) | 9 (53) | 14 (41) | 7 (29) | |
| Race, n (%) | .8 | ||||
| White | 31 (41) | 7 (41) | 12 (35) | 12 (50) | |
| Hispanic | 18 (24) | 3 (18) | 10 (29) | 5 (21) | |
| Asian | 15 (20) | 3 (18) | 7 (21) | 5 (21) | |
| Black | 1 (1) | 1 (6) | 0 (0) | 0 (0) | |
| Unknown | 10 (13) | 3 (18) | 5 (15) | 2 (8) | |
| Histology, n (%) | NA | ||||
| Colorectal adenocarcinoma | 75 (100) | 17 (100) | 34 (100) | 24 (100) | |
| Sideness, n (%) | .83 | ||||
| Left | 53 (71) | 13 (76) | 22 (65) | 18 (75) | |
| Right | 18 (24) | 4 (24) | 9 (26) | 5 (21) | |
| Unknown | 4 (5) | 0 (0) | 3 (9) | 1 (4) | |
| MSS,b n (%) | .33 | ||||
| Stable | 59 (79) | 15 (88) | 28 (82) | 16 (67) | |
| High | 1 (1) | 0 (0) | 0 (0) | 1 (4) | |
| NA | 15 (20) | 2 (12) | 6 (18) | 7 (29) | |
| Tumor mutation burden,b n (%) | .04 | ||||
| Low | 36 (48) | 6 (35) | 19 (56) | 11 (46) | |
| Intermediate | 19 (25) | 9 (53) | 7 (21) | 3 (13) | |
| High | 3 (4) | 1 (6) | 1 (3) | 1 (4) | |
| NA3 | 17 (23) | 1 (6) | 7 (21) | 9 (38) | |
| Chemotherapy lines, n (%) | <.01 | ||||
| 0–3 | 49 (65) | 17 (100) | 26 (76) | 6 (25) | |
| 4–6 | 15 (20) | 0 (0) | 8 (24) | 7 (29) | |
| >6 | 11 (15) | 0 (0) | 0 (0) | 11 (46) |

The statistical significance of age was assessed by Kruskal‐Wallis test; The others were assessed by Fisher exact test.
As reported on FoundationOne Reports.
Abbreviations: MSS, microsatellite stable; NA, not available.
Genomic Landscape of Alterations on FoundationOne Tissue Biopsy and Guardant360 Liquid Biopsy
The prevalence of mutations identified by F1 NGS that were analyzed in this study are described in supplemental online Figure 1. F1 samples were collected prior to the initiation of any type of chemotherapy in all untreated patients, 26 of 34 (77%) patients in the treated without anti‐EGFR therapy group, and 15 of 24 (63%) patients in the treated with anti‐EGFR therapy group. Additionally, F1 samples were collected from the metastatic sites in 7 of 17 (41%) patients in the untreated group, 14 of 34 (41%) in the treated without anti‐EGFR therapy group, and 13 of 24 (54%) in the treated with anti‐EGFR therapy group.
After excluding the genes not tested by G360, the median number of alterations per patient was similar in both F1 and G360 (6; p = .94, Mann‐Whitney test). The median number of alterations when amplifications were excluded was five for both F1 and G360 (p = .06, Mann‐Whitney test).
In all three cohorts combined on G360, 186 (40%) subclonal mutations were detected in 61% (46/75) of patients.
Somatic mutations of the TP53 and APC genes were present in all three groups of patients in approximately equal incidences. KRAS and NRAS mutations were seen in a higher proportion of patients in the untreated and the treated without anti‐EGFR groups compared with the treated with anti‐EGFR group, presumably owing to an institutional bias to perform more ctDNA assays in patients with RAS wild‐type tumors following progression on anti‐EGFR therapy.
Heatmaps of the landscape of genomic alterations on the tissue and ctDNA assay are shown in Figures 1, 2, 3. There was a high rate of concordance in the APC, TP53, KRAS, NRAS, and BRAF mutations in the untreated group (Fig. 1). In the same group, F1 identified more mutations in the ATM gene. Two NRAS mutations (NRAS E31D and NRAS Q150R) were unique to G360 but were subclonal and lacked confirmed clinical significance.
Figure 1.

Landscape of genomic alterations in tissue and circulating tumor DNA in the untreated group.
Figure 2.

Landscape of genomic alterations in tissue and circulating tumor DNA in the treated without anti‐EGFR therapy group.
Figure 3.
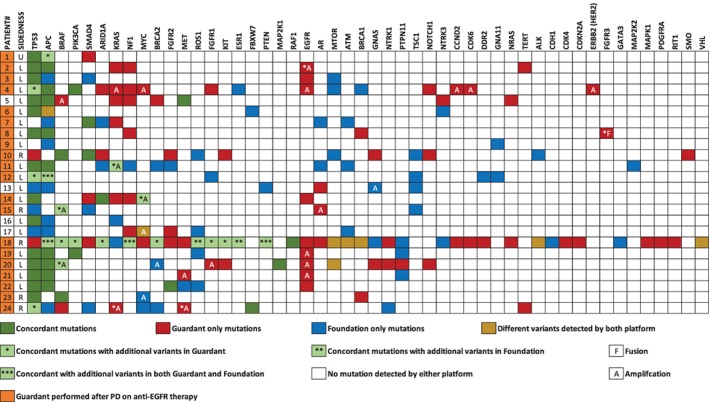
Landscape of genomic alterations in tissue and circulating tumor DNA in the treated with anti‐EGFR therapy group.
Similarly, in the non–anti‐EGFR therapy treated group, there was good concordance in the APC, TP53, KRAS, and NRAS genes (Fig. 2). Increased mutations in ATM and ARID1A were noted on F1, whereas increased numbers of amplifications were reported on G360. Again, two subclonal nondriver NRAS alterations (NRAS: K117T and NRAS: D107G) were reported on G360. Three patients had BRAF amplifications on G360; however, all three patients had KRAS mutations as well. One patient (#23) who had right‐sided colon cancer had a BRAF fusion detected only on F1, whereas G360 noted KRAS and BRAF amplification.
In the group that was treated with anti‐EGFR therapy, there was increased discordance in the drivers of resistance to anti‐EGFR therapy: KRAS, NRAS, and EGFR mutations (Fig. 3). However, it is important to note that 20 of 24 (83%) patients had G360 testing performed after documentation of progressive disease on anti‐EGFR therapy.
Diagnostic Accuracy Analysis in Somatic Mutations
Concordance and discordance in actionable (KRAS, NRAS, BRAF, and HER2) and nonactionable clinically relevant somatic mutations are reported in supplemental online Tables 1 and 2. Amplifications were excluded from this analysis. There was increased discordance in KRAS somatic mutations in the treated with anti‐EGFR group. However, 71% (5/7) of KRAS discordance was reported after patients had progressive disease on anti‐EGFR therapy. When limiting the analysis to clinically relevant alterations in KRAS, NRAS, and BRAF (supplemental online Table 4), concordance among the untreated or non–anti‐EGFR treated patients was high, at 88%, 92% and 88%, respectively. A high concordance rate was observed in the HER2 mutations in all three groups. In the nonactionable mutations, there was a higher rate of discordance in the APC gene, especially in the two treated patient groups compared with the untreated patient group. There were high rates of ATM and EGFR discordance in the untreated group.
Discordant alterations detected by G360 testing were more likely to have ctDNA less than 1% (58 of 83; median, 0.3%), compared with concordant G360 alterations (28 of 128; median, 10.45%; p < .001; Mann‐Whitney test; Fig. 4). Individual percentages of ctDNA in concordant and discordant mutations detected by G360 for driver mutations are shown in supplemental online Tables 3 and 4.
Figure 4.
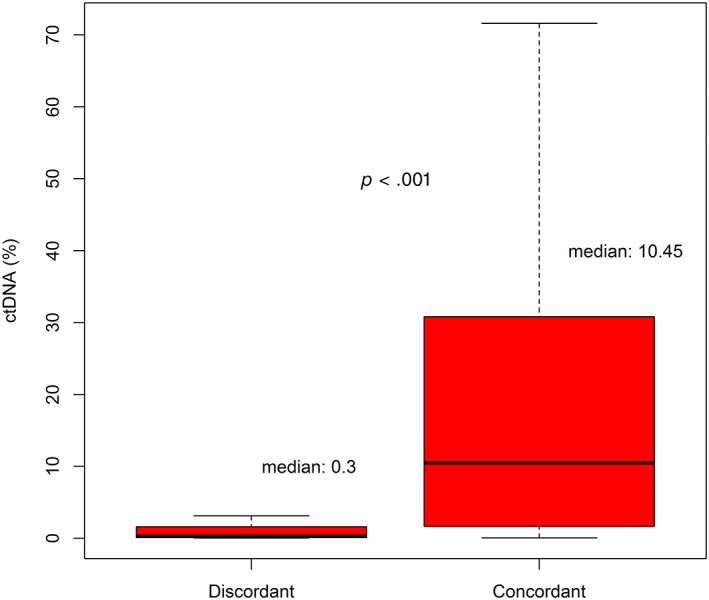
Comparing percentage of circulating tumor DNA (ctDNA) between concordant and discordant somatic mutations seen on G360.
Gene‐level sensitivity, specificity, positive predictive value, negative predictive value, and diagnostic accuracy were analyzed across four representative genes in the sample. These genes included KRAS, NRAS, BRAF, and HER2. Tissue‐based NGS was used as the gold standard for this analysis. Across all four genes examined, when excluding variants of unknown significance and subclonal mutations, sensitivity was 68.9%, specificity was 98.8%, and diagnostic accuracy was 94.3% (Table 2). The sensitivity, specificity, and diagnostic accuracy were highest in the untreated group when compared with the two treated groups (supplemental online Tables 5–7).
Table 2.
Diagnostic accuracy analysis in four driver mutations
| G360 mutations | FoundationOne mutations | Sensitivity, % | Specificity, % | PPV, % | NPV, % | Diagnostic accuracy, % | Youden's J index, % | |
|---|---|---|---|---|---|---|---|---|
| (+) | (‐) | |||||||
| KRAS | ||||||||
| (+) | 22 | 1 | ||||||
| (‐) | 7 | 45 | 75.9 | 97.8 | 95.7 | 86.5 | 89.3 | 0.7 |
| NRAS | ||||||||
| (+) | 1 | 0 | ||||||
| (‐) | 1 | 73 | 50.0 | 100.0 | 100.0 | 98.6 | 98.7 | 0.5 |
| BRAF | ||||||||
| (+) | 7 | 1 | ||||||
| (‐) | 4 | 63 | 63.6 | 98.4 | 87.5 | 94.0 | 93.3 | 0.6 |
| ERBB2 (HER2) | ||||||||
| (+) | 1 | 1 | ||||||
| (‐) | 2 | 71 | 33.3 | 98.6 | 50.0 | 97.3 | 96.0 | 0.3 |
| Total positive | 31 | 3 | ||||||
| Total negative | 14 | 252 | ||||||
| Total (positive + negative) | 45 | 255 | 68.9 | 98.8 | 91.2 | 94.7 | 94.3 | 0.7 |

Note: Only clonal mutations were included. Amplifications were counted as wild‐type. Different variants detected by both platforms were excluded.
Abbreviations: NPV, negative predictive value; PPV, positive predictive value.
Note that the above analysis was limited to alterations that tested by both F1 and G360. We have listed the alterations that are tested by F1 and not by G360 in supplemental online Table 9. Although these alterations may theoretically benefit from targeted therapy or immunotherapy (such as AKT1 for AKT inhibitors or DNA repair gene mutations for immunotherapy), none of these mutations have been shown to be associated with clinical benefit from a specific therapeutic intervention in colorectal cancer.
Amplifications
Notable amplifications reported on G360 are shown in supplemental online Table 8. Amplifications were reported on F1 but not quantified. Most amplifications on G360 were either + or ++. In all three groups of patients, there were increased EGFR amplifications reported on G360. Contrary to our expectations, we noted less MET amplifications in the treated with anti‐EGFR therapy group compared with the other groups. In patients with four or more different gene amplifications, seven patients had a left‐sided tumor, two had a right‐sided tumor, and one had an unknown side of CRC. HER2 discordant amplification was noted in 4% (n = 3, including all three cohorts) of patients, with two amplifications reported on G360 (both + and after multiple lines of therapies including anti‐EGFR therapy) and one amplification on F1.
Serial ctDNA
One patient with a BRAF V600E mutation developed cMET amplification after progressing following 6 months of response to BRAF + MEK + EGFR inhibitors. Upon withdrawal of targeted therapy, his cMET amplification resolved and he responded again to BRAF + EGFR inhibitors for 432 days, confirming clonal evolution in response to BRAF inhibitors and their withdrawal (Fig. 5). There was an emergence of multiple new alterations that affect the EGFR pathway: EGFR mutations, KRAS mutations, MET amplifications, KRAS amplifications, and BRAF amplifications.
Figure 5.

Example of a serial Guardant360 testing a patient who was treated with anti‐EGFR showing emergence of clonal alterations which can potentially help guide treatment.Abbreviation: ND, not detected.
Discussion
The goal of NGS is to make treatment decisions based on the precise genomic profile of tumors in a particular individual. Currently, there are several different platforms available for NGS, each of them with their own advantages and disadvantages. Two common platforms are F1, a tissue‐based tumor biopsy, and G360, a blood‐based liquid biopsy. Direct comparisons between the G360 ctDNA panel and the comprehensive F1 NGS panel in patients with mCRC are limited. Therefore, the primary objective of this study was to compare the concordance and discordance rates of genomic alterations found on these panels in patients with mCRC.
After analyzing a sample of 75 patients who had both F1 and G360 reports available, we noted that even though G360 reports fewer genomic alterations compared with F1 (approximately 50 vs. 280), the total concordance rate was 91%. The ctDNA assay has a higher specificity (94.1%) and diagnostic accuracy (91.3%) than F1 in 4 driver mutations: KRAS, NRAS, BRAF, and HER2. Our pooled analysis shows good sensitivity and robust specificity when comparing G360 with the baseline F1 and when factoring in the targetable alterations RAS, BRAF, and HER‐2. However, we have limited ability to judge the sensitivity and specificity of the individual alterations because of the small sample size, especially for HER‐2 and NRAS. Furthermore, when we limited our analysis to clonal pathogenic mutations within these four genes in the non–anti‐EGFR pretreated populations, our specificity and accuracy improved to 99.1% and 92.6%, which are in line with recent data comparing other ctDNA platforms with F1 19.
Our results suggest that G360 NGS platform may be used as an alternative to F1 for the purpose of identifying appropriate patients for anti‐EGFR or BRAF inhibitors plus anti‐EGFR treatment selection. It is important to note that in our systemic therapy–treated patients, we obtained ctDNA assay with G360 only at the time of progression. It is well known that the sensitivity of G360 is substantially reduced when performed in patients responding to treatment. Therefore, our conclusions above should not be extrapolated to patients responding to treatment at the time of ctDNA testing. Furthermore, it has been reported that the sensitivity of G360 and other ctDNA platforms could be limited in the setting of very low volume disease or disease that is limited to the peritoneum and that the reliability of G360 in such settings should be taken with caution, especially when no clonal driver mutation is noted. We did notice that there was increased discordance in KRAS genes in the group of patients previously treated with anti‐EGFR therapy, as 29% discordance in KRAS somatic mutations was noted. This discordance is likely related to tumor evolution that is pressured by targeted therapy 20. Previous studies reported that there may be profound and complex molecular heterogeneity in individuals who receive anti‐EGFR therapy 21, 22, 23. In the current study, when G360 was collected at the time of disease progression on anti‐EGFR therapy, 20% (8/20) of patients had at least one alteration (including mutations and amplifications) in KRAS, NRAS, EGFR, or MET. Two of those patients had five alterations in those genes, suggesting the emergence of multiple pathways of resistance to anti‐EGFR therapy.
It is important to note that most patients who had discordant mutations detected in the liquid ctDNA biopsy had a lower percentage of ctDNA compared with the concordant mutations (median 0.3% vs. 10.45%). Our findings suggest that the discordance in ctDNA is mostly subclonal and therefore of lesser clinical significance.
Among the nonactionable mutations, TP53 and APC were the most common altered genes found in all three groups of patients. This is consistent with the current literature, which suggests that TP53 and APC are common driver mutations found in colorectal cancer 15, 24. One of the unique findings in this study was that there was an increased prevalence of APC discordance in the two treated groups when compared with the untreated group. Most of these were APC alterations reported on F1 testing. Even though the exact reason for this is unclear, this phenomenon is consistent with a prior study which demonstrated that APC alterations were detected more frequently in the tissue than in plasma 25. The variations in discordance and concordance among different genes is probably multifactorial and may be related to gene coverage variations between F1 and G360, subclonal alterations affected by tissue sampling on F1, and tumor evolution that is detected in G360 samples. For example, BRCA1/2, FBXW7, and ATM genes have partial coverage by G360, which may explain the higher incidence of mutations noted in these genes on F1 versus G360.
Most amplifications in this study population were reported on G360 rather than F1. This may be due to a lower threshold of reporting copy number variations with a liquid biopsy compared with F1 testing. Our study showed an increased incidence of EGFR amplification in all 3 groups on G360. Prior studies have shown that increased EGFR gene copy number may be associated with a clinical response to anti‐EGFR therapy in the setting of RAS wild‐type tumors 26, 27. One meta‐analysis showed that in patients with wild‐type KRAS mCRC, the response rate was 83.9% in patients with high EFGR copy number gain (CNG), whereas the response rate dropped to 14.3% in patients with low EFGR CNG 28. However, the degree of amplification that is reported and what is meaningful varies among different NGS testing platforms. In the current study, most of the ctDNA EGFR amplifications were either 1+ or 2+ and may not have clinical significance. The increased level of amplification noted in multiple genes on G360 may also be related to the methodology of capturing gene amplification. The methodology that Guardant was using to determine amplification did not differentiate focal amplification from the amplification reflecting aneuploidy (which are of lower clinical significance). Guardant has recently implemented modifications in their methodology that would only call focal amplifications. These recent changes will likely result in reduced discordance in amplifications with F1 in future reports.
Another emergent biomarker is HER2 amplification, which may be present in up to 3%–5% of patients with mCRC, especially in patients with RAS/RAF wild‐type tumors 29, 30. Studies have shown the targeting HER2 amplification in patients mCRC may increase the response and disease control rates 31, 32. Immunohistochemistry and fluorescence in situ hybridization analysis are considered the standard assays to detect HER2 amplifications. HER2 amplification by ctDNA is dependent on both disease tumor burden and degree of HER2 amplification within the tumor 33. In the current study, 2 HER2 amplifications were detected on G360 testing, both of which were 1+ amplifications and were discordant with our F1 assay. This suggests that these emerging HER2 amplifications may not be of clinical significance. Only one patient had emergence of HER2 amplification in the setting of anti‐EGFR therapy resistance, while also having other emerging amplifications in CCND1, CDK6, EGFR, KRAS, and MYC on G360, suggesting that this is not the main mechanism of resistance.
We found that the majority of patients who had more than four gene amplifications had left‐sided colon cancer. This is consistent with prior studies that have shown that left‐sided colon cancers tend to have an increased chromosomal instability high tumor (CIN high) compared with right‐sided tumors 34. CIN high tumors are characterized by widespread imbalances in chromosome number and loss of heterozygosity and, hence, may have increased copy number variations in those tumors 35.
In addition to imaging, serial ctDNA testing has the potential to serve as an additional tool to understand disease response to treatment and mechanisms of resistance to the patient's current therapy while noting emerging alterations. The potential advantage of this noninvasive test is that it can be obtained with a rapid turnaround time. We noted that for the 11 patients who had serial ctDNA testing, there was emergence of several alterations, especially in the TP53 and APC genes, which were either absent at the time of initial testing or had low clonality. However, these alterations are of unknown clinical significance and without potential treatments. Also noted was the emergence of multiple new alterations that affected the EGFR pathway: EGFR mutations, RAS mutations, MET amplifications, RAS amplifications, and BRAF amplifications. One patient with a BRAF V600E mutation developed cMET amplification after progressing following 6 months of response to BRAF + MEK + EGFR inhibitors. Upon withdrawal of targeted therapy, his cMET amplification resolved and he responded again to BRAF + EGFR inhibitors, confirming clonal evolution in response to BRAF inhibitors and their withdrawal. This suggests that serial ctDNA may be of potential use to study response to therapy and mechanisms of resistance.
To our knowledge, this study was one of the few to compare two commercially available NGS panels and to examine concordance of paired NGS F1 tissue and G360 ctDNA assays in mCRC. Some of the main limitations of this study include its retrospective nature, taking place at a single institution, and its relatively small sample size. However, because collecting both a tissue and liquid biopsy is not a common practice, this study provides important information that can be further validated in larger prospective studies. Nonetheless, it is important to study these resistance mutations in future prospective studies.
Conclusion
This study, despite its limitations, shows high concordance between G360 and F1 in chemo‐naive patients or patients who have progressive disease and treated with non–anti‐EGFR therapy when the focus is clinically relevant alterations in RAS and BRAF. The discordance was noticed in patients who were treated with anti‐EGFR therapy with the following drivers of resistance: KRAS, NRAS, and EGFR mutations. However, median percentage of ctDNA on G360 was subclonal in discordant somatic mutations compared with concordant somatic mutations (0.3% vs 10.45%) and, therefore, of less known clinical significance. The majority of discordant amplifications noted on G360 were + or ++ and were of unknown significance. Larger prospective studies are needed to further validate concordance among both tissue and ctDNA and to study the impact of these findings on clinical decisions that can guide patient outcomes.
Author Contributions
Conception/design: Rohan Gupta, Ching Ouyang, Marwan Fakih
Provision of study material or patients: Rohan Gupta, Marwan Fakih
Collection and/or assembly of data: Rohan Gupta, Tamer Othman, Chen Chen, Jaideep Sandhu, Ching Ouyang, Marwan Fakih
Data analysis and interpretation: Chen Chen, Jaideep Sandhu
Manuscript writing: Rohan Gupta, Tamer Othman, Chen Chen, Jaideep Sandhu, Ching Ouyang, Marwan Fakih
Final approval of manuscript: Rohan Gupta, Tamer Othman, Chen Chen, Jaideep Sandhu, Ching Ouyang, Marwan Fakih
Disclosures
Marwan Fakih: Amgen (H, C/A, Speaker Bureau/ET, RF), Array, Bayer (C/A), AstraZeneca, Novartis (RF). The other authors indicated no financial relationships.
(C/A) Consulting/advisory relationship; (RF) Research funding; (E) Employment; (ET) Expert testimony; (H) Honoraria received; (OI) Ownership interests; (IP) Intellectual property rights/inventor/patent holder; (SAB) Scientific advisory board
Supporting information
See http://www.TheOncologist.com for supplemental material available online.
Supplemental Figure
Supplemental Tables
Disclosures of potential conflicts of interest may be found at the end of this article.
References
- 1. Holch J, Stintzing S, Heinemann V. Treatment of metastatic colorectal cancer: Standard of care and future perspectives. Visc Med 2016;32:178–183. [DOI] [PMC free article] [PubMed] [Google Scholar]
- 2. Chae YK, Davis AA, Carneiro BA et al. Concordance between genomic alterations assessed by next‐generation sequencing in tumor tissue or circulating cell‐free DNA. Oncotarget 2016;7:65364–65373. [DOI] [PMC free article] [PubMed] [Google Scholar]
- 3. Kuderer NM, Burton KA, Blau S et al. Comparison of 2 commercially available next‐generation sequencing platforms in oncology. JAMA Oncol 2017;3:996–998. [DOI] [PMC free article] [PubMed] [Google Scholar]
- 4. Gerlinger M, Rowan AJ, Horswell S et al. Intratumor heterogeneity and branched evolution revealed by multiregion sequencing. New Engl J Med 2012;366:883–892. [DOI] [PMC free article] [PubMed] [Google Scholar]
- 5. Burrell RA, McGranahan N, Bartek J et al. The causes and consequences of genetic heterogeneity in cancer evolution. Nature 2013;501:338–345. [DOI] [PubMed] [Google Scholar]
- 6. Hiley C, de Bruin EC, McGranahan N et al. Deciphering intratumor heterogeneity and temporal acquisition of driver events to refine precision medicine. Genome Biol 2014;15:453. [DOI] [PMC free article] [PubMed] [Google Scholar]
- 7. Nik‐Zainal S, Van Loo P, Wedge DC et al; Breast Cancer Working Group of the International Cancer Genome Consortium. Erratum for: The life history of 21 breast cancers (Cell 2012;149:994‐1007). Cell 2015;162:924. [DOI] [PMC free article] [PubMed] [Google Scholar]
- 8. Wang Y, Waters J, Leung ML et al. Clonal evolution in breast cancer revealed by single nucleus genome sequencing. Nature 2014;512:155–160. [DOI] [PMC free article] [PubMed] [Google Scholar]
- 9. Cohen S, Punt C, Iannotti N et al. Prognostic significance of circulating tumor cells in patients with metastatic colorectal cancer. Ann Oncol 2009;20:1223–1229. [DOI] [PubMed] [Google Scholar]
- 10. Eliasova P, Pinkas M, Kolostova K et al. Circulating tumor cells in different stages of colorectal cancer. Folia Histochem Cytobiol 2017;55:1–5. [DOI] [PubMed] [Google Scholar]
- 11. Elshimali Y, Khaddour H, Sarkissyan M et al. The clinical utilization of circulating cell free DNA (CCFDNA) in blood of cancer patients. Int J Mol Sci 2013;14:18925–18958. [DOI] [PMC free article] [PubMed] [Google Scholar]
- 12. Williams PM, Conley BA. Clinical application of liquid biopsies. JAMA Oncol 2016;2:1003–1005. [DOI] [PubMed] [Google Scholar]
- 13. Vymetalkova V, Cervena K, Bartu L et al. Circulating cell‐free DNA and colorectal cancer: A systematic review. Int J Mol Sci 2018;19:E3356. [DOI] [PMC free article] [PubMed] [Google Scholar]
- 14. Cassinotti E, Boni L, Segato S et al. Free circulating DNA as a biomarker of colorectal cancer. Int J Surg 2013;11(suppl 1):S54–S57. [DOI] [PubMed] [Google Scholar]
- 15. Gong J, Cho M, Sy M et al. Molecular profiling of metastatic colorectal tumors using next‐generation sequencing: A single‐institution experience. Oncotarget 2017;8:42198–42213. [DOI] [PMC free article] [PubMed] [Google Scholar]
- 16. Zhao B, Wang L, Qiu H et al. Mechanisms of resistance to anti‐EGFR therapy in colorectal cancer. Oncotarget 2017;8:3980–4000. [DOI] [PMC free article] [PubMed] [Google Scholar]
- 17. Chae YK, Davis AA, Jain S et al. Concordance of genomic alterations by next‐generation sequencing in tumor tissue versus circulating tumor DNA in breast cancer. Mol Cancer Ther 2017;16:1412–1420. [DOI] [PubMed] [Google Scholar]
- 18. Youden WJ. Index for rating diagnostic tests. Cancer 1950;3:32–35. [DOI] [PubMed] [Google Scholar]
- 19. Gregg JP, Li G, Pavlick D et al. Comprehensive genomic profiling of ctDNA in patients with colon cancer and its fidelity to the genomics of the tumor biopsy. J Clin Oncol 2018;36(suppl):569a. [Google Scholar]
- 20. Arena S, Bellosillo B, Siravegna G et al. Emergence of multiple EGFR extracellular mutations during cetuximab treatment in colorectal cancer. Clin Cancer Res 2015;21:2157–2166. [DOI] [PubMed] [Google Scholar]
- 21. Morelli M, Overman M, Dasari A et al. Characterizing the patterns of clonal selection in circulating tumor DNA from patients with colorectal cancer refractory to anti‐EGFR treatment. Ann Oncol 2015;26:731–736. [DOI] [PMC free article] [PubMed] [Google Scholar]
- 22. Bertotti A, Papp E, Jones S et al. The genomic landscape of response to EGFR blockade in colorectal cancer. Nature 2015;526:263–267. [DOI] [PMC free article] [PubMed] [Google Scholar]
- 23. Strickler JH, Loree JM, Ahronian LG et al. Genomic landscape of cell‐free DNA in patients with colorectal cancer. Cancer Discov 2018;8:164–173. [DOI] [PMC free article] [PubMed] [Google Scholar]
- 24. Armaghany T, Wilson JD, Chu Q et al. Genetic alterations in colorectal cancer. Gastrointest Cancer Res 2012;5:19–27. [PMC free article] [PubMed] [Google Scholar]
- 25. Kato S, Schwaederlé MC, Fanta PT et al. Genomic assessment of blood‐derived circulating tumor DNA in patients with colorectal cancers: Correlation with tissue sequencing, therapeutic response, and Survival. JCO Precis Oncol 2019;3. [DOI] [PMC free article] [PubMed] [Google Scholar]
- 26. Moroni M, Veronese S, Benvenuti S et al. Gene copy number for epidermal growth factor receptor (EGFR) and clinical response to antiEGFR treatment in colorectal cancer: A cohort study. Lancet Oncol 2005;6:279–286. [DOI] [PubMed] [Google Scholar]
- 27. Personeni N, Fieuws S, Piessevaux H et al. Clinical usefulness of EGFR gene copy number as a predictive marker in colorectal cancer patients treated with cetuximab: A fluorescent in situ hybridization study. Clin Cancer Res 2008;14:5869–5876. [DOI] [PubMed] [Google Scholar]
- 28. Shen WD, Chen HL, Liu PF. EGFR gene copy number as a predictive biomarker for resistance to anti‐EGFR monoclonal antibodies in metastatic colorectal cancer treatment: A meta‐analysis. Chin J Cancer Res 2014;26:59–71. [DOI] [PMC free article] [PubMed] [Google Scholar]
- 29. Bertotti A, Migliardi G, Galimi F et al. A molecularly annotated platform of patient‐derived xenografts (“xenopatients”) identifies HER2 as an effective therapeutic target in cetuximab‐resistant colorectal cancer. Cancer Discov 2011;1:508–523. [DOI] [PubMed] [Google Scholar]
- 30. Richman SD, Southward K, Chambers P et al. HER2 overexpression and amplification as a potential therapeutic target in colorectal cancer: Analysis of 3256 patients enrolled in the QUASAR, FOCUS and PICCOLO colorectal cancer trials. J Pathol 2016;238:562–570. [DOI] [PMC free article] [PubMed] [Google Scholar]
- 31. Sartore‐Bianchi A, Trusolino L, Martino C et al. Dual‐targeted therapy with trastuzumab and lapatinib in treatment‐refractory, KRAS codon 12/13 wild‐type, HER2‐positive metastatic colorectal cancer (HERACLES): A proof‐of‐concept, multicentre, open‐label, phase 2 trial. Lancet Oncol 2016;17:738–746. [DOI] [PubMed] [Google Scholar]
- 32. Hainsworth JD, Meric‐Bernstam F, Swanton C et al. Targeted therapy for advanced solid tumors on the basis of molecular profiles: Results from MyPathway, an open‐label, phase IIa multiple basket study. J Clin Oncol 2018;36:536–544. [DOI] [PubMed] [Google Scholar]
- 33. Siravegna G, Sartore‐Bianchi A, Nagy RJ et al. Plasma HER2 (ERBB2) copy number predicts response to HER2‐targeted therapy in metastatic colorectal cancer. Clin Cancer Res 2019;15:3046–3053. [DOI] [PubMed] [Google Scholar]
- 34. Baran B, Mert Ozupek N, Yerli Tetik N et al. Difference between left‐sided and right‐sided colorectal cancer: A focused review of literature. Gastroenterology Res 2018;11:264–273. [DOI] [PMC free article] [PubMed] [Google Scholar]
- 35. Pino MS, Chung DC. The chromosomal instability pathway in colon cancer. Gastroenterology 2010;138:2059–2072. [DOI] [PMC free article] [PubMed] [Google Scholar]
Associated Data
This section collects any data citations, data availability statements, or supplementary materials included in this article.
Supplementary Materials
See http://www.TheOncologist.com for supplemental material available online.
Supplemental Figure
Supplemental Tables