

Abstract
Background
Inflammation-related parameters have been revealed to have prognostic value in multiple caners. However, the significance of some inflammation-related parameters, including the peripheral blood neutrophil-to-lymphocyte ratio (NLR), platelet-to-lymphocyte ratio (PLR), lymphocyte-to-monocyte ratio (LMR) and prognostic nutritional index (PNI), remains controversial in T1–2 rectal cancer (RC).
Methods
Clinical data of 154 T1–2 RC patients were retrospectively reviewed. The cut-off values for NLR, PLR, LMR, and PNI were determined by receiver operating characteristic curves. The relationships of these parameters with postoperative morbidities and prognosis were statistically analysed.
Results
The optimal cut-off values for preoperative NLR, PLR, LMR and PNI were 2.8, 140.0, 3.9, and 47.1, respectively. Significant but heterogeneous associations were found between NLR, PLR, LMR and PNI and clinicopathological factors. In addition, high NLR, high PLR, and low PNI were correlated with an increased postoperative morbidity rate. Patients with high NLR/PLR or low LMR/PNI had lower OS and DFS rates. On multivariate analysis, only high NLR was identified as an independent risk factor for poor DFS.
Conclusions
NLR, PLR, and PNI are valuable factors for predicting postoperative complications in T1–2 RC patients. A preoperative NLR of more than 2.8 is an independent prognostic factor for poor DFS in T1–2 RC patients.
Keywords: Rectal cancer, Inflammation, Prognosis, Complication
Background
Colorectal cancer (CRC) is the fourth most common cancer and second leading cause of cancer-related death worldwide [1]. In 2018, more than seven hundred thousand people were diagnosed with rectal cancer (RC), and the overall mortality rate was 44.1% [1]. With the prevalence of health screening, more patients are diagnosed at a relatively early stage with less invasion depth. At present, the tumour-node-metastasis (TNM) staging system is the fundamental tool for predicting clinical outcomes and determining therapeutic options. The depth of invasion is associated with the prognosis of RC, particularly in the advanced stage. However, few reports have concentrated on investigating the predictive factors associated with prognosis for early T stage (T1–2) cancers [2]. Therefore, to develop more individualized treatment strategies for T1–2 RC patients, novel prognostic biomarkers that can be conveniently obtained preoperatively are needed [3, 4].
The pivotal role of the systemic inflammatory response in cancer progression has been well recognized and substantiated [5–7]. Peripheral blood cells might reflect the inflammatory and immune response of patients to malignant tumours and are critical for determining the treatment response and clinical outcomes of cancer patients. Inflammation-related parameters that evaluate the systemic inflammatory response have yielded prognostic value independent of the TNM staging system [8, 9]. Among these parameters, the peripheral blood neutrophil-to-lymphocyte ratio (NLR), platelet-to-lymphocyte ratio (PLR), lymphocyte-to-monocyte ratio (LMR) and prognostic nutritional index (PNI) [10] have been widely investigated, and their prognostic role has been demonstrated in various types of cancers, including RC [11–16]. However, most of these studies reported the prognostic value of these inflammation-related factors in locally advanced RCs [8, 14, 17, 18]. To the best of our knowledge, the prognostic significance of these factors in T1–2 RCs has been rarely reported, and the impact of these factors on postoperative complications remains obscure.
Our study aimed to detect the role of NLR, PLR, LMR, and PNI in predicting the prognosis of T1–2 RC patients without distant metastasis. Moreover, the association of these parameters with postoperative morbidity was investigated. In addition, the risk factors for poor survival in T1–2 RC patients were also analysed.
Methods
Patient cohort
We retrospectively reviewed 154 T1–2 RC patients who underwent R0 surgical resection between April 2012 and August 2016 at the First Affiliated Hospital of Shandong First Medical University. Magnetic resonance imaging was used to evaluate the clinical stage of the tumour preoperatively. The final diagnosis of the patients was confirmed by routine pathology. The exclusion criteria were as follows: recurrent or metastatic RC confirmed preoperatively or at surgery, emergency cases, unavailable clinicopathological data, more than 1 primary cancer, receiving anticancer treatments preoperatively, resections with macro- or microscopically positive pathological margins and with active infection or the use systemic corticosteroids. The TNM classification of malignant tumours, 8th edition, edited by the Union for International Cancer Control (UICC) was used to determine the TNM stage. Patients with T1 RCs and no signs of lymph node metastasis on endorectal ultrasound or MRI underwent local excision through transanal endoscopic microsurgery (TEM), or laparoscopic or open surgery was performed. Informed consent was obtained from each patient, and the present study was approved by the Ethics Committee of the Fist Affiliated Hospital of Shandong First Medical University.
Definitions
Peripheral blood was obtained 1 week prior to surgery. The NLR was determined by dividing the absolute neutrophil count by the absolute lymphocyte count; the PLR was determined by dividing the absolute platelet count by the absolute lymphocyte count; and the LMR was determined by dividing the absolute lymphocyte count by the absolute monocyte count. The PNI was calculated by the following formula: serum albumin (g/L) + 5 × total lymphocyte count × 109/L. [19] Postoperative complications were defined as any in-hospital or 30-day postoperative complication and graded according to the Clavien-Dindo classification [20].
Follow-up and study endpoints
Patients were followed-up periodically after surgery. Re-examination was performed at 3-month intervals for the first 2 years postoperatively, every 6 months for the next 3 years and every year thereafter. Physical examinations and blood tests, including serum carcinoembryonic antigen (CEA) levels, were performed at each follow-up. A chest X-ray and abdominopelvic computed tomography scan were performed every 6 months, and colonoscopy was performed annually or when there was a suspicion of recurrence. In addition, rigid rectoscopy and endorectal ultrasound were conducted at every visit except for the colonoscopy visit of the TEM patients.
The primary endpoints were cancer recurrence or death. The secondary endpoint was the occurrence of postoperative complications. Overall survival (OS) was calculated as the date of diagnosis to the date of death from any cause. Disease-free survival (DFS) was defined as the time interval from cancer diagnosis until tumour recurrence or death from any cause.
Statistical analysis
The data are presented as the mean ± standard deviation. Categorical variables were analysed with Pearson’s Chi-square test or Fisher’s exact test as appropriate. The cut-off values for NLR, PLR, LMR, and PNI were determined using receiver operating characteristic (ROC) curve analysis. At each ratio, the sensitivity and specificity for survival were determined and plotted, thereby generating a ROC curve. Using the (0, 1) criterion, the point on the curve with the shortest distance to the coordinate (0, 1) was chosen as the cut-off value, and the patients were classified into high and low NLR/PLR/LMR/PNI groups with this cut-off value. Kaplan–Meier analysis and the log rank test were used to compare the survival curves of the 2 groups. Risk factors for poor survival were detected by univariate and multivariate analyses using the Cox proportional hazards model. Variables with a P value of < 0.05 in the univariate analysis were further evaluated in the multivariate analysis to assess the independent predictors for OS and DFS. Statistical analyses were performed using the IBM SPSS statistics version 22.0 software package for Windows (IBM Co., New York, NY). A statistically significant difference was defined as a P value of < 0.05.
Results
Baseline patient characteristics and inflammatory-related parameters
A total of 154 T1–2 RC patients were enrolled in this study, and lymph node metastasis was present in 22 patients. The characteristics of the patients are shown in Table 1. Our study group comprised 90 (58.4%) male and 64 (41.6%) female patients, with a mean age of 63.7 years (range 32–90 years). A total of 63 (40.9%) patients had 1 or more comorbidities. TEM was conducted in 47 patients, while laparoscopic (n = 53) or open surgery (n = 54) was performed in 107 patients. No mortality occurred 30 days after the operation. A total of 26 complications (grade I-IVa) occurred in 22 (14.3%) patients postoperatively, including 22 grade I-II and 4 grade III-IVa complications. With a median follow-up interval of 42.4 months (range 12–89 months), the 3-year OS and DFS rates of all patients were 90.9 and 87.7%, respectively. Three patients died from a cause other than rectal cancer. The distributions of preoperative inflammatory-related parameters are shown in Table 2. The optimal cut-off values for preoperative NLR, PLR, LMR and PNI that best predicted OS were calculated to be 2.8 (area under the curve (AUC): 0.71; sensitivity: 53.0%; specificity: 84.0%), 140.0 (AUC: 0.64; sensitivity: 80.0%; specificity: 58.0%), 3.9 (AUC: 0.68; sensitivity: 73.0%; specificity: 65.0%), and 47.1 (AUC: 0.75; sensitivity: 60.0%; specificity: 83.0%), respectively (Fig. 1a-d). Then, the patients were dichotomized into high or low NLR/PLR/LMR/PNI groups with these cut-off values. The numbers and features of patients in each group are listed in Table 1.
Table 1.
Correlation between inflammatory parameters and clinicopathological characteristics
| Parameters | NO. (154) | NLR | P value | PLR | P value | LMR | P value | PNI | P value |
|---|---|---|---|---|---|---|---|---|---|
| Low (124) /High (30) | Low (84) / High (70) | Low (59) /High (95) | Low (32) /High (122) | ||||||
| Age | 0.054 | 0.622 | 0.558 | 0.441 | |||||
| ≤ 60 years | 54 | 48/6 | 28/26 | 19/35 | 8/46 | ||||
| > 60 years | 100 | 76/24 | 56/44 | 40/60 | 24/98 | ||||
| Gender | 0.308 | 0.720 | 0.063 | 0.184 | |||||
| Male | 90 | 70/20 | 48/42 | 40/50 | 22/68 | ||||
| Female | 64 | 54/10 | 36/28 | 19/45 | 10/54 | ||||
| Smoking | 0.650 | 0.183 | 0.628 | 0.815 | |||||
| Yes | 41 | 34/7 | 26/15 | 17/24 | 8/33 | ||||
| No | 113 | 90/23 | 58/55 | 42/71 | 24/89 | ||||
| Alcoholism | 0.780 | 0.079 | 0.720 | 0.962 | |||||
| Yes | 39 | 32/7 | 26/13 | 14/25 | 8/31 | ||||
| No | 115 | 92/23 | 58/57 | 45/70 | 24/91 | ||||
| Hypertension | 0.917 | 0.382 | 0.373 | 0.555 | |||||
| Yes | 45 | 36/9 | 27/18 | 16/29 | 8/37 | ||||
| No | 109 | 88/21 | 57/52 | 43/56 | 24/85 | ||||
| Diabetes Mellitus | 1.000 | 0.165 | 0.839 | 0.240 | |||||
| Yes | 22 | 18/4 | 15/7 | 8/14 | 2/20 | ||||
| No | 132 | 106/26 | 69/63 | 51/81 | 30/102 | ||||
| Coronary Artery Disease | 0.153 | 0.247 | 0.056 | 0.216 | |||||
| Yes | 21 | 14/7 | 9/12 | 12/9 | 7/14 | ||||
| No | 133 | 110/23 | 75/58 | 47/86 | 25/108 | ||||
| CEA | 0.415 | 0.593 | 0.023 | 0.261 | |||||
| < 5 μg/ml | 126 | 103/23 | 70/56 | 43/83 | 24/102 | ||||
| ≥ 5 μg/ml | 28 | 21/7 | 14/14 | 16/12 | 8/20 | ||||
| CA19–9 | 1.000 | 0.127 | 0.515 | 1.000 | |||||
| < 37 U/ml | 147 | 118/29 | 78/69 | 55/92 | 31/116 | ||||
| ≥ 37 U/ml | 7 | 6/1 | 6/1 | 4/3 | 1/6 | ||||
| HGB | 0.063 | 0.012 | 0.854 | 0.013 | |||||
| ≥ 110 g/L | 143 | 118/25 | 82/61 | 54/89 | 26/117 | ||||
| < 110 g/L | 11 | 6/5 | 2/9 | 5/6 | 6/5 | ||||
| Occult blood | 0.967 | 0.169 | 0.190 | 0.831 | |||||
| Yes | 128 | 103/25 | 73/55 | 52/76 | 27/101 | ||||
| No | 26 | 21/5 | 11/15 | 7/19 | 5/21 | ||||
| Distance from anal verge | 0.838 | 0.877 | 0.103 | 0.355 | |||||
| ≤ 50 mm | 54 | 43/11 | 29/25 | 16/38 | 9/45 | ||||
| > 50 mm | 100 | 81/19 | 55/45 | 43/57 | 23/77 | ||||
| Operation procedure | 0.945 | 0.010 | 0.149 | 0.446 | |||||
| TEM | 47 | 38/9 | 33/14 | 14/33 | 8/39 | ||||
| Radical resection | 107 | 86/21 | 51/56 | 45/62 | 24/83 | ||||
| Time of operation | 0.645 | 0.067 | 0.125 | 0.165 | |||||
| < 3 h | 56 | 44/12 | 36/20 | 17/39 | 15/41 | ||||
| ≥ 3 h | 98 | 80/18 | 48/50 | 42/56 | 17/81 | ||||
| Blood transfusion perioperation | 0.024 | 0.626 | 0.973 | 0.191 | |||||
| Yes | 4 | 1/3 | 3/1 | 1/3 | 2/2 | ||||
| No | 150 | 123/27 | 81/69 | 58/92 | 30/120 | ||||
| Differentiation grade | 0.195 | 0.118 | 0.458 | 0.349 | |||||
| Well+Moderate | 126 | 99/27 | 65/61 | 50/76 | 28/98 | ||||
| Poor+Undifferentiate | 28 | 25/3 | 19/9 | 9/19 | 4/24 | ||||
| Tumor size | 0.003 | 0.575 | 0.111 | 0.764 | |||||
| < 3 cm | 83 | 66/17 | 47/36 | 27/56 | 18/65 | ||||
| ≥ 3 cm | 71 | 68/3 | 37/34 | 32/39 | 14/57 | ||||
| T stage | 0.389 | 0.952 | 0.052 | 0.255 | |||||
| T1 | 62 | 52/10 | 34/28 | 18/44 | 14/48 | ||||
| T2 | 92 | 72/20 | 50/42 | 41/51 | 18/74 | ||||
| N stage | 0.901 | 0.064 | < 0.001 | 0.096 | |||||
| N0 | 132 | 107/25 | 76/56 | 42/90 | 24/108 | ||||
| N1/2 | 22 | 17/5 | 8/14 | 17/5 | 8/14 | ||||
| TNM stage | 0.901 | 0.064 | < 0.001 | 0.096 | |||||
| I | 132 | 107/25 | 76/56 | 42/90 | 24/108 | ||||
| III | 22 | 17/5 | 8/14 | 17/5 | 8/14 |
NLR neutrophil-to-lymphocyte ratio; PLR platelet-to-lymphocyte ratio; LMR lymphocyte-to-monocyte ratio; PNI prognostic nutritional index; CEA carcinoembryonic antigen; CA19–9 carbohydrate antigen 19–9; HGB hemoglobin; TEM transanal endoscopic microsurgery; TNM tumor-lymph node-metastasis
Table 2.
Distribution of inflammation-related parameters in T1–2 rectal cancer patients
| Parameters | Minimum value | Maximum value | Mean value | Standard deviation |
|---|---|---|---|---|
| Neutrophil count (109/L) | 0.06 | 9.44 | 3.63 | 1.39 |
| Lymphocyte count (109/L) | 0.51 | 3.63 | 1.83 | 0.58 |
| Platelet count (109/L) | 88.00 | 484.00 | 235.03 | 64.48 |
| Monocyte count (109/L) | 0.12 | 0.97 | 0.43 | 0.16 |
| Serum albumin (g/L) | 32.10 | 53.40 | 42.90 | 4.32 |
| NLR | 0.02 | 12.26 | 2.22 | 1.32 |
| PLR | 32.60 | 403.00 | 140.77 | 56.86 |
| LMR | 1.06 | 16.69 | 4.76 | 2.27 |
| PNI | 37.75 | 65.95 | 52.06 | 5.40 |
NLR neutrophil-to-lymphocyte ratio; PLR platelet-to-lymphocyte ratio; LMR lymphocyte-to-monocyte ratio; PNI prognostic nutritional index
Fig. 1.
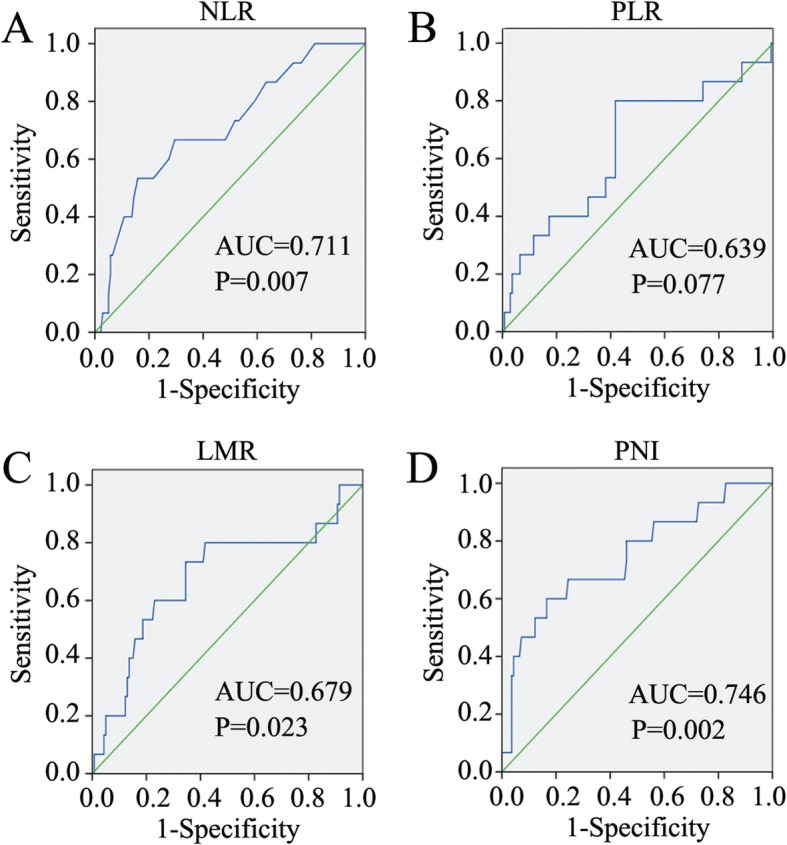
The cut-off values for the inflammation-related parameters. a-d. ROC curves were adopted to calculate the cut-off values for NLR (a), PLR (b), LMR (c), and PNI (d). NLR, neutrophil-to-lymphocyte ratio, PLR, platelet-to-lymphocyte ratio, LMR, lymphocyte-to-monocyte ratio, PNI, prognostic nutritional index, AUC, area of under curve
Correlations between NLR, PLR, LMR and PNI and clinicopathological variables
To determine the clinical significance of NLR, PLR, LMR and PNI in T1–2 RC patients, the associations of NLR, PLR, LMR and PNI with clinicopathological features were analysed. The results showed that NLR was significantly correlated with perioperative blood transfusion (P = 0.024) and tumour size (P = 0.003) (Table 1). PLR was correlated with haemoglobin (HGB) level (P = 0.012) and TEM procedure (P = 0.010) (Table 1). In addition, LMR was significantly correlated with CEA level (P = 0.023), N stage (P < 0.001) and TNM stage (P < 0.001) (Table 1). PNI was correlated with only HGB level (P = 0.013) (Table 1). Distribution of inflammation-related parameters in T1–2 rectal cancer patients are listed in Table 2. Furthermore, the relationships of NLR, PLR, LMR, and PNI with postoperative complications were investigated. High NLR (P < 0.001), high PLR (P = 0.025), and low PNI (P < 0.001) indicated a much-increased morbidity rate postoperatively (Table 3). In addition, high NLR (P < 0.001) and low PNI (P = 0.005) were also correlated with higher rates of grade I-II complications (Table 3).
Table 3.
Association between inflammation-related parameters and postoperative complications
| Classifi-cation | No. of complications | NLR | P value | PLR | P value | LMR | P value | PNI | P value |
|---|---|---|---|---|---|---|---|---|---|
| Low (124) /High (30) | Low (84)/ High (70) | Low (59) /High (95) | Low (32) /High (122) | ||||||
| Grade I |
2 postop bleed; conservative tx 3 urinary retention; catheterization 2 wound infection; opened at the bedside 2 non-infectious diarrhea; conservative tx |
3/6 | 0.001 | 2/7 | 0.097 | 5/4 | 0.457 | 4/5 | 0.042 |
| Grade II |
4 postop bleed; blood transfusion 1 urinary tract infection; antibiotic tx 4 ileus, total parenteral nutrition 2 pneumonia; antibiotic tx 1 diarrhea; antibiotic tx 1 tachyarrhythmia; β-receptor antagonists tx |
3/10 | < 0.001 | 6/7 | 0.525 | 5/8 | 1.000 | 6/7 | 0.046 |
| Grade I-II | 22 | 6/16 | < 0.001 | 8/14 | 0.064 | 10/12 | 0.457 | 10/12 | 0.005 |
| Grade IIIa | 2 stricture of the anastomosis; endoscopic dilatation | 0/2 | 0.037 | 0/2 | 0.205 | 2/0 | 0.145 | 1/1 | 0.373 |
| Grade IIIb | 1 strangulating intestinal obstruction; reintervention | 1/0 | 1.000 | 0/1 | 0.455 | 1/0 | 0.386 | 1/0 | 0.208 |
| Grade IVa | 1 anastomotic leak and postop bleed,; reintervention and intensive care unit | 1/0 | 1.000 | 1/0 | 1.000 | 1/0 | 0.386 | 0/1 | 1.000 |
| Grade III- IVa | 4 | 2/2 | 0.171 | 1/3 | 0.488 | 4/0 | 0.040 | 2/2 | 0.191 |
| Total | 26 | 8/18 | < 0.001 | 9/17 | 0.025 | 14/12 | 0.074 | 12/14 | < 0.001 |
NLR neutrophil-to-lymphocyte ratio; PLR platelet-to-lymphocyte ratio; LMR lymphocyte-to-monocyte ratio; PNI prognostic nutritional index; tx treatment
Survival analysis with NLR, PLR, LMR and PNI
To further define the value of the inflammatory-related parameters in predicting clinical outcomes in T1–2 RC patients, the OS and DFS rates of the patients in different subgroups were subsequently calculated. As displayed in Fig. 2, patients with high NLR, high PLR, low LMR, and low PNI showed a much worse 3-year OS rate than patients with low NLR (P < 0.001), low PLR (P = 0.001), high LMR (P < 0.001), and high PNI (P < 0.001). Moreover, patients with high NLR, high PLR, low LMR, and low PNI had much lower 3-year DFS rates than patients with low NLR (P < 0.001), low PLR (P = 0.005), high LMR (P = 0.002), and high PNI (P < 0.001) (Fig. 2a-d). Furthermore, the risk factors for poor OS and DFS were detected with univariate analysis, which showed that HGB < 110 g/L, high NLR, high PLR, low LMR, low PNI, more advanced N stage and TNM stage were risk factors for both poor OS and poor DFS (Table 4 and Table 5). To avoid multicollinearity, we conducted multivariate analysis using 2 models separately, and each multivariate model included either the N stage or TNM stage. Further subjecting these factors to multivariate analysis showed that only HGB < 110 g/L (P = 0.015), more advanced N stage (P < 0.001) and TNM stage (P < 0.001) were independent risk factors for poor OS (Table 4). HGB < 110 g/L (P = 0.014), high NLR (P = 0.009), more advanced N stage (P < 0.001) and TNM stage (P < 0.001) were independently associated with poor DFS (Table 5).
Fig. 2.

The associations of the inflammation-related parameters with the OS and DFS. a-d. The OS (left) and DFS (right) rates of T1–2 RC patients with high or low NLR (a), PLR (b), LMR (c), or PNI (d) level depicted by the Kaplan-Meier method. NLR, neutrophil-to-lymphocyte ratio, PLR, platelet-to-lymphocyte ratio, LMR, lymphocyte-to-monocyte ratio
Table 4.
Univariate and multivariate Cox regression analysis of the risk factor for poor overall survival
| Parameters | Univariate analysis | Multivariate analysis | ||||
|---|---|---|---|---|---|---|
| HR | 95% CI | P value | HR | 95% CI | P value | |
| Age > 60 years vs. ≤60 years | 1.510 | 0.481–4.744 | 0.480 | |||
| Gender Male vs. Female | 2.918 | 0.823–10.341 | 0.097 | |||
| Smoking No vs. Yes | 0.420 | 0.095–1.863 | 0.254 | |||
| Alcoholism No vs. Yes | 0.734 | 0.207–2.600 | 0.631 | |||
| Hypertension Yes vs. No | 2.198 | 0.797–6.063 | 0.128 | |||
| Diabetes Mellitus Yes vs. No | 2.159 | 0.687–6.780 | 0.187 | |||
| Coronary Artery Disease Yes vs. No | 2.550 | 0.812–8.010 | 0.109 | |||
| CEA level ≥ 5 μg/ml vs. < 5 μg/ml | 2.380 | 0.813–6.966 | 0.113 | |||
| CA19–9 < 37 U/ml vs. ≥37 U/ml | 0.046 | < 0.001–1702.151 | 0.567 | |||
| HGB ≥110 g/L vs. < 110 g/L | 0.172 | 0.055–0.542 | 0.003 | 0.204 | 0.057–0.731 | 0.015 |
| NLR ≥2.80 vs. < 2.80 | 5.396 | 1.954–14.896 | 0.001 | 3.149 | 0.933–12.525 | 0.063 |
| PLR ≥140.05 vs. < 140.05 | 5.043 | 1.423–17.874 | 0.012 | 1.266 | 0.277–5.783 | 0.761 |
| LMR ≥3.88 vs. < 3.88 | 0.208 | 0.066–0.652 | 0.007 | 0.767 | 0.202–2.910 | 0.696 |
| PNI ≥47.1 vs. < 47.1 | 0.152 | 0.054–0.427 | 0.295 | 0.462 | 0.127–1.686 | 0.242 |
| Occult blood No vs. Yes | 0.560 | 0.178–1.759 | 0.321 | |||
| Distance from anal verge ≤50 mm vs. > 50 mm | 2.287 | 0.645–8.104 | 0.200 | |||
| Operation procedure Radical resection vs. TEM | 1.823 | 0.514–6.461 | 0.352 | |||
| Time of operation ≥3 h vs. < 3 h | 1.600 | 0.510–5.026 | 0.421 | |||
| Blood transfusion perioperation Yes vs. No | 3.265 | 0.429–24.840 | 0.253 | |||
| Differentiation Poor/Undifferentiate vs. Well/Moderate | 1.293 | 0.729–2.291 | 0.379 | |||
| Tumor size ≥3 cm vs. < 3 cm | 1.409 | 0.511–3.886 | 0.508 | |||
| T stage T2 vs. T1 | 1.999 | 0.636–6.278 | 0.236 | |||
| N stage (N1/2 vs. N0) | 11.888 | 4.215–33.532 | < 0.001 | 9.944 | 3.001–32.954 | < 0.001 |
| TNM stage III vs. I | 11.888 | 4.215–33.532 | < 0.001 | 9.944 | 3.001–32.954 | < 0.001 |
CI confidence interval; HR hazard ratio; CEA carcinoembryonic antigen; CA19–9 carbohydrate antigen 19–9; HGB hemoglobin; NLR neutrophil-to-lymphocyte ratio; PLR platelet-to-lymphocyte ratio; LMR lymphocyte-to-monocyte ratio; PNI prognostic nutritional index; TEM transanal endoscopic microsurgery; TNM tumor-lymph node-metastasis
Table 5.
Univariate and multivariate Cox regression analysis of the risk factor for poor disease-free survival
| Parameters | Univariate analysis | Multivariate analysis | ||||
|---|---|---|---|---|---|---|
| HR | 95% CI | P value | HR | 95% CI | P value | |
| Age > 60 years vs. ≤60 years | 1.480 | 0.471–4.649 | 0.502 | |||
| Gender Male vs. Female | 2.025 | 0.645–6.362 | 0.227 | |||
| Smoking No vs. Yes | 0.431 | 0.097–1.909 | 0.268 | |||
| Alcoholism No vs. Yes | 0.463 | 0.105–2.025 | 0.311 | |||
| Hypertension Yes vs. No | 2.128 | 0.772–5.870 | 0.144 | |||
| Diabetes Mellitus Yes vs. No | 1.513 | 0.427–5.362 | 0.521 | |||
| Coronary Artery Disease Yes vs. No | 2.567 | 0.817–8.066 | 0.107 | |||
| CEA level ≥ 5 μg/ml vs. < 5 μg/ml | 2.464 | 0.842–7.211 | 0.100 | |||
| CA19–9 < 37 U/ml vs. ≥37 U/ml | 0.046 | < 0.001–1734.515 | 0.567 | |||
| HGB ≥110 g/L vs. < 110 g/L | 0.178 | 0.057–0.560 | 0.003 | 0.205 | 0.058–0.721 | 0.014 |
| NLR ≥2.80 vs. < 2.80 | 6.935 | 2.466–19.499 | < 0.001 | 6.656 | 1.616–27.418 | 0.009 |
| PLR ≥140.05 vs. < 140.05 | 8.074 | 1.822–35.790 | 0.006 | 1.689 | 0.313–9.109 | 0.542 |
| LMR ≥3.88 vs. < 3.88 | 0.143 | 0.040–0.508 | 0.003 | 0.392 | 0.096–1.597 | 0.191 |
| PNI ≥47.1 vs. < 47.1 | 0.206 | 0.075–0.568 | 0.002 | 1.169 | 0.308–4.435 | 0.818 |
| Occult blood No vs. Yes | 0.802 | 0.226–2.843 | 0.733 | |||
| Distance from anal verge ≤50 mm vs. > 50 mm | 1.595 | 0.508–5.009 | 0.424 | |||
| Operation procedure Radical resection vs. TEM | 1.812 | 0.511–6.423 | 0.357 | |||
| Time of operation ≥3 h vs. < 3 h | 1.594 | 0.508–5.006 | 0.425 | |||
| Blood transfusion perioperation Yes vs. No | 3.312 | 0.435–25.192 | 0.247 | |||
| Differentiation Poor/Undifferentiate vs. Well/Moderate | 1.300 | 0.734–2.304 | 0.369 | |||
| Tumor size ≥3 cm vs. < 3 cm | 1.869 | 0.665–5.252 | 0.235 | |||
| T stage T2 vs. T1 | 2.918 | 0.823–10.341 | 0.097 | |||
| N stage (N1/2 vs. N0) | 11.143 | 3.955–31.400 | < 0.001 | 9.193 | 2.665–31.712 | < 0.001 |
| TNM stage III vs. I | 11.143 | 3.955–31.400 | < 0.001 | 9.193 | 2.665–31.712 | < 0.001 |
CI confidence interval; HR hazard ratio; CEA carcinoembryonic antigen; CA19–9 carbohydrate antigen 19–9; HGB hemoglobin; NLR neutrophil-to-lymphocyte ratio; PLR platelet-to-lymphocyte ratio; LMR lymphocyte-to-monocyte ratio; PNI prognostic nutritional index; TEM transanal endoscopic microsurgery; TNM tumor-lymph node-metastasis
Discussion
Systemic inflammation plays a pivotal role in cancer proliferation and metastasis by acting on the local tumour microenvironment [21, 22]. Accumulating evidence has indicated the prognostic value of inflammation-related factors in RC patients with different baseline characteristics and TNM stages [8, 9, 11, 23–28]. Our study evaluated the clinical significance of NLR, PLR, LMR, and PNI in T1–2 RC patients with or without lymph node metastasis. To define the prognostic value of these inflammation-related factors, a ROC curve was used to determine cut-off scores. As a result, the optimal cut-off values for NLR, PLR, LMR and PNI were identified as 2.8, 140.0, 3.9, and 47.1, respectively. Interestingly, the obtained cut-off values for NLR and PLR were relatively low compared with those reported in previous studies (NLR, range 3.0–5.0 [18, 29]; PLR, range 123.0–150.0 [18, 27, 30]), while the cut-off values for LMR and PNI were relatively high compared with those reported in previous studies (LMR, range 2.1–3.8 [12]; PNI, range 35.0–49.2 [16]). This finding may be due to the relatively early T stages of the RC patients in our study.
In the inflammatory response to cancer, neutrophils may directly interact with circulating tumour cells, serve as reservoirs for circulating vascular endothelial growth factor, and facilitate metastasis [31–33]. Lymphocytes usually function as pivotal tumour suppressors by inducing cytotoxic cell death and producing cytokines that inhibit cancer cell proliferation and metastatic activity [34, 35]. Elevated NLR, caused by lymphocytopenia and/or a high neutrophil count, may lead to a poor immune response to malignancy and an increased potential for tumour recurrence [33, 36–40]. Thus, NLR is recognized as an efficient inflammation-based prognostic parameter in solid tumours [29]. Platelets may release angiogenic and putative tumour growth factors in the inflammatory response, accelerate endothelial cell growth and promote cancer progression [11]. Elevated PLR has been demonstrated to have a significant association with poor prognosis in CRC [19]. Similar to lymphocytes, monocytes are also key immune cells in the inflammatory response [41]. In contrast to lymphocytes, monocytes promote the growth and survival of cancer cells by providing trophic factors and thus directly accelerate the progression of cancer [42–44]. Low preoperative LMR was a dominant poor prognostic factor in multiple types of cancers [14, 41, 45]. Nutrition status is a fundamental factor that can determine the outcome of treatment for cancer [46]. PNI, which is calculated according to serum albumin levels and peripheral lymphocyte counts, reflects both the nutritional status and immune status of the patient [10]. A low PNI score has been proven to be an indicator of poor prognosis in cancers [17, 47, 48]. The prognostic value of NLR has been reported in T1–2N0 CRCs [2], with the conclusion that preoperative NLR is a predictive prognostic factor for DFS and cancer-specific survival in patients with stage I CRC who underwent curative surgery. However, the predictive significance of PLR, NLR, and PNI for postoperative complications and prognosis has rarely been reported in T1–2 RCs. Impressively, our results revealed that T1–2 RC patients with high NLR/PLR or low LMR/PNI had much lower 3-year OS rates and DFS rates than patients with low NLR/PLR or high LMR/PNI. Moreover, high NLR/PLR and low LMR/PNI were all revealed as risk factors for poor OS and DFS in univariate analysis. However, these parameters were not identified as independent risk factors for poor OS in multivariate analysis, and only high NLR (HR = 6.656, 95% CI = 1.616–27.418, P = 0.009) was analysed as an independent risk factor for poor DFS, which is similar to the results reported by George Malietzis et al. in 2014 [49]. Overall, high NLR/PLR and low LMR/PNI can be used as indicators for poor OS and DFS in T1–2 RC patients with or without lymph node metastasis, and NLR may have extra significance independently of other factors in the prediction of DFS. Differentiating the patients with high risks of recurrence and poor survival in T1–2 RC patients may provide evidence for making a more rigid and personalized surveillance regimen.
Few studies have focused on the association of inflammation-related factors and postoperative complications in T1–2 RC patients. This study revealed that high NLR/PLR and low PNI were correlated with a higher morbidity rate. Moreover, high NLR and low PNI were also correlated with a higher grade I-II complication rate in subgroup analyses. In addition, there was a tendency towards an increased morbidity rate in patients with low LMR, though no statistical significance was found (P = 0.074). Thus, the inflammation-related factors may be used as markers for identifying patients with a high probability of occurring complications postoperatively, and more targeted treatment strategies should be made for these patients. Furthermore, significant but heterogeneous associations were found between the clinicopathological factors and the inflammation-related parameters. Previous studies have reported the association of lymph node metastasis with inflammation-related factors, but the results on the role of inflammation-related factors in predicting lymph node metastasis remain controversial [11, 49]. The present study discovered that LMR was the only factor correlated with N stage and TNM stage in T1–2 RC patients.
Conclusion
The present study confirmed the value of NLR, PLR, LMR, and PNI in predicting postoperative complications and prognosis in T1–2 RC patients. However, only elevated NLR was identified as an independent risk factor for DFS. The ubiquity of complete blood count testing and the ease of calculation make these values ideal as predictive tools for clinical outcomes. However, this study has some limitations. The clinical data were retrospectively analysed, and the patients enrolled in this study were from one medical centre. In addition, the results of previous studies and our study have shown different cut-off values of the inflammation-related parameters in different TNM stages. Difference of cut-off value is a problem for clinical application. Prospective studies with more patients from multiple medical centres are needed in order to further verify the significance of NLR, PLR, LMR, and PNI in T1–2 RCs, and studies involving more samples with all TNM stages are also needed to create a model based on these inflammation-related parameters, which may facilitate the clinical application of these parameters.
Acknowledgements
Not applicable.
Abbreviations
- AUC
Area of under curve
- CA19–9
carbohydrate antigen 19–9
- CEA
Carcinoembryonic antigen
- CRC
Colorectal cancer
- DFS
Disease-free survival
- HGB
Hemoglobin
- LMR
Lymphocyte-to-monocyte ratio
- NLR
Neutrophil-to-lymphocyte ratio
- OS
Overall survival
- PLR
Platelet-to-lymphocyte ratio
- PNI
Prognostic nutritional index
- RC
Rectal cancer
- ROC
Receiver operating characteristic
- TEM
Transanal endoscopic microsurgery
- TNM
Tumor-lymph node-metastasis
- TNM
Tumor-node-metastasis
Authors’ contributions
HY: study conception and design, acquiring data, data analysis, and drafting article. LJX and WL: polishing and revision of article. LJX, WL and CWY: acquiring data. ZJC and JBC: statistical analysis. LJX, WL and JBC: statistical analysis and critical revision of article. LJX, WL and JCZ: drafting article and critical revision of article. All authors read and approved the final manuscript.
Funding
Not applicable.
Availability of data and materials
The datasets used and/or analysed during the current study are available from the corresponding author on reasonable request.
Ethics approval and consent to participate
The study was approved by the Ethics Committee of the First Affiliated Hospital of Shandong First Medical University. All the participants gave written informed consent.
Consent for publication
Not applicable.
Competing interests
The authors declare that they have no competing interests.
Footnotes
Publisher’s Note
Springer Nature remains neutral with regard to jurisdictional claims in published maps and institutional affiliations.
Li-jian Xia and Wen Li contributed equally to this work.
References
- 1.Bray F, Ferlay J, Soerjomataram I, Siegel RL, Torre LA, Jemal A. Global Cancer statistics 2018: GLOBOCAN estimates of incidence and mortality worldwide for 36 cancers in 185 countries. CA Cancer J Clin. 2018;0(0):1–31. doi: 10.3322/caac.21492. [DOI] [PubMed] [Google Scholar]
- 2.Shin JS, Suh KW, Oh SY. Preoperative neutrophil to lymphocyte ratio predicts survival in patients with T1-2N0 colorectal cancer. J Surg Oncol. 2015;112(6):654–657. doi: 10.1002/jso.24061. [DOI] [PubMed] [Google Scholar]
- 3.Stotz M, Pichler M, Absenger G, Szkandera J, Arminger F, Schaberl-Moser R, et al. The preoperative lymphocyte to monocyte ratio predicts clinical outcome in patients with stage III colon cancer. Br J Cancer. 2014;110(2):435–440. doi: 10.1038/bjc.2013.785. [DOI] [PMC free article] [PubMed] [Google Scholar]
- 4.Ryan E, Khaw YL, Creavin B, Geraghty R, Ryan EJ, Gibbons D, et al. Tumor budding and PDC grade are stage independent predictors of clinical outcome in mismatch repair deficient colorectal Cancer. Am J Surg Pathol. 2018;42(1):60–68. doi: 10.1097/PAS.0000000000000931. [DOI] [PubMed] [Google Scholar]
- 5.Balkwill F, Mantovani A. Inflammation and cancer: back to Virchow? Lancet. 2001;357(9255):539–545. doi: 10.1016/S0140-6736(00)04046-0. [DOI] [PubMed] [Google Scholar]
- 6.Coussens LM, Werb Z. Inflammation and cancer. Nature. 2002;420(6917):860–867. doi: 10.1038/nature01322. [DOI] [PMC free article] [PubMed] [Google Scholar]
- 7.Colotta F, Allavena P, Sica A, Garlanda C, Mantovani A. Cancer-related inflammation, the seventh hallmark of cancer: links to genetic instability. Carcinogenesis. 2009;30(7):1073–1081. doi: 10.1093/carcin/bgp127. [DOI] [PubMed] [Google Scholar]
- 8.Dong YW, Shi YQ, He LW, Su PZ. Prognostic significance of neutrophil-to-lymphocyte ratio in rectal cancer: a meta-analysis. Onco Targets Ther. 2016;9:3127–3134. doi: 10.2147/OTT.S109783. [DOI] [PMC free article] [PubMed] [Google Scholar]
- 9.Ying HQ, Deng QW, He BS, Pan YQ, Wang F, Sun HL, et al. The prognostic value of preoperative NLR, d-NLR, PLR and LMR for predicting clinical outcome in surgical colorectal cancer patients. Med Oncol. 2014;31(12):305. doi: 10.1007/s12032-014-0305-0. [DOI] [PubMed] [Google Scholar]
- 10.Onodera T, Goseki N. Kosaki G: prognostic nutritional index in gastrointestinal surgery of malnourished cancer patients. Nihon Geka Gakkai zasshi. 1984;85(9):1001–1005. [PubMed] [Google Scholar]
- 11.Pedrazzani C, Mantovani G, Fernandes E, Bagante F, Luca Salvagno G, Surci N, et al. Assessment of neutrophil-to-lymphocyte ratio, platelet-to-lymphocyte ratio and platelet count as predictors of long-term outcome after R0 resection for colorectal cancer. Sci Rep. 2017;7(1):1494. doi: 10.1038/s41598-017-01652-0. [DOI] [PMC free article] [PubMed] [Google Scholar]
- 12.Song W, Wang K, Zhang RJ, Zou SB. Prognostic value of the lymphocyte monocyte ratio in patients with colorectal cancer: a meta-analysis. Medicine (Baltimore) 2016;95(49):e5540. doi: 10.1097/MD.0000000000005540. [DOI] [PMC free article] [PubMed] [Google Scholar]
- 13.Krakowska M, Debska-Szmich S, Czyzykowski R, Zadrozna-Nowak A, Potemski P. The prognostic impact of neutrophil-to-lymphocyte ratio, lymphocyte-to-monocyte ratio, and platelet-to-lymphocyte ratio in patients with advanced colorectal cancer treated with first-line chemotherapy. Prz Gastroenterol. 2018;13(3):218–222. doi: 10.5114/pg.2018.78287. [DOI] [PMC free article] [PubMed] [Google Scholar]
- 14.Tan D, Fu Y, Tong W, Li F. Prognostic significance of lymphocyte to monocyte ratio in colorectal cancer: a meta-analysis. Int J Surg. 2018;55:128–138. doi: 10.1016/j.ijsu.2018.05.030. [DOI] [PubMed] [Google Scholar]
- 15.Xie QK, Chen P, Hu WM, Sun P, He WZ, Jiang C, et al. The systemic immune-inflammation index is an independent predictor of survival for metastatic colorectal cancer and its association with the lymphocytic response to the tumor. J Transl Med. 2018;16(1):273. doi: 10.1186/s12967-018-1638-9. [DOI] [PMC free article] [PubMed] [Google Scholar]
- 16.Sun K, Chen S, Xu J, Li G, He Y. The prognostic significance of the prognostic nutritional index in cancer: a systematic review and meta-analysis. J Cancer Res Clin Oncol. 2014;140(9):1537–1549. doi: 10.1007/s00432-014-1714-3. [DOI] [PMC free article] [PubMed] [Google Scholar]
- 17.Sun G, Li Y, Peng Y, Lu D, Zhang F, Cui X, et al. Impact of the preoperative prognostic nutritional index on postoperative and survival outcomes in colorectal cancer patients who underwent primary tumor resection: a systematic review and meta-analysis. Int J Color Dis. 2019;34(4):681–689. doi: 10.1007/s00384-019-03241-1. [DOI] [PubMed] [Google Scholar]
- 18.Zhang J, Zhang HY, Li J, Shao XY, Zhang CX. The elevated NLR, PLR and PLT may predict the prognosis of patients with colorectal cancer: a systematic review and meta-analysis. Oncotarget. 2017;8(40):68837–68846. doi: 10.18632/oncotarget.18575. [DOI] [PMC free article] [PubMed] [Google Scholar]
- 19.Akgul O, Cetinkaya E, Yalaza M, Ozden S, Tez M. Prognostic efficacy of inflammation-based markers in patients with curative colorectal cancer resection. World J Gastrointest Oncol. 2017;9(7):300–307. doi: 10.4251/wjgo.v9.i7.300. [DOI] [PMC free article] [PubMed] [Google Scholar]
- 20.Dindo D, Demartines N, Clavien PA. Classification of surgical complications: a new proposal with evaluation in a cohort of 6336 patients and results of a survey. Ann Surg. 2004;240(2):205–213. doi: 10.1097/01.sla.0000133083.54934.ae. [DOI] [PMC free article] [PubMed] [Google Scholar]
- 21.Guthrie GJ, Roxburgh CS, Richards CH, Horgan PG, McMillan DC. Circulating IL-6 concentrations link tumour necrosis and systemic and local inflammatory responses in patients undergoing resection for colorectal cancer. Br J Cancer. 2013;109(1):131–137. doi: 10.1038/bjc.2013.291. [DOI] [PMC free article] [PubMed] [Google Scholar]
- 22.Choi Y, Kim JW, Nam KH, Han SH, Kim JW, Ahn SH, et al. Systemic inflammation is associated with the density of immune cells in the tumor microenvironment of gastric cancer. Gastric Cancer. 2017;20(4):602–611. doi: 10.1007/s10120-016-0642-0. [DOI] [PubMed] [Google Scholar]
- 23.Climent M, Ryan EJ, Stakelum A, Khaw YL, Creavin B, Lloyd A, et al. Systemic inflammatory response predicts oncological outcomes in patients undergoing elective surgery for mismatch repair-deficient colorectal cancer. Int J Color Dis. 2019;34(6):1069–1078. doi: 10.1007/s00384-019-03274-6. [DOI] [PubMed] [Google Scholar]
- 24.Cruz-Ramos M, Del Puerto-Nevado L, Zheng B, Lopez-Bajo R, Cebrian A, Rodriguez-Remirez M, et al. Prognostic significance of neutrophil-to lymphocyte ratio and platelet-to lymphocyte ratio in older patients with metastatic colorectal cancer. J Geriatr Oncol. 2019;10(5):742–748. doi: 10.1016/j.jgo.2018.10.002. [DOI] [PubMed] [Google Scholar]
- 25.Ding PR, An X, Zhang RX, Fang YJ, Li LR, Chen G, et al. Elevated preoperative neutrophil to lymphocyte ratio predicts risk of recurrence following curative resection for stage IIA colon cancer. Int J Color Dis. 2010;25(12):1427–1433. doi: 10.1007/s00384-010-1052-0. [DOI] [PubMed] [Google Scholar]
- 26.Nagasaki T, Akiyoshi T, Fujimoto Y, Konishi T, Nagayama S, Fukunaga Y, et al. Prognostic impact of neutrophil-to-lymphocyte ratio in patients with advanced low rectal Cancer treated with preoperative Chemoradiotherapy. Dig Surg. 2015;32(6):496–503. doi: 10.1159/000441396. [DOI] [PubMed] [Google Scholar]
- 27.Stojkovic Lalosevic M, Pavlovic Markovic A, Stankovic S, Stojkovic M, Dimitrijevic I, Radoman Vujacic I, et al. Combined diagnostic efficacy of neutrophil-to-lymphocyte ratio (NLR), platelet-to-lymphocyte ratio (PLR), and mean platelet volume (MPV) as biomarkers of systemic inflammation in the diagnosis of colorectal Cancer. Dis Markers. 2019;2019:6036979. doi: 10.1155/2019/6036979. [DOI] [PMC free article] [PubMed] [Google Scholar]
- 28.Patel M, McSorley ST, Park JH, Roxburgh CSD, Edwards J, Horgan PG, et al. The relationship between right-sided tumour location, tumour microenvironment, systemic inflammation, adjuvant therapy and survival in patients undergoing surgery for colon and rectal cancer. Br J Cancer. 2018;118(5):705–712. doi: 10.1038/bjc.2017.441. [DOI] [PMC free article] [PubMed] [Google Scholar]
- 29.Templeton AJ, McNamara MG, Seruga B, Vera-Badillo FE, Aneja P, Ocana A, et al. Prognostic role of neutrophil-to-lymphocyte ratio in solid tumors: a systematic review and meta-analysis. J Natl Cancer Inst. 2014;106(6):dju124. doi: 10.1093/jnci/dju124. [DOI] [PubMed] [Google Scholar]
- 30.Song Y, Yang Y, Gao P, Chen X, Yu D, Xu Y, et al. The preoperative neutrophil to lymphocyte ratio is a superior indicator of prognosis compared with other inflammatory biomarkers in resectable colorectal cancer. BMC Cancer. 2017;17(1):744. doi: 10.1186/s12885-017-3752-0. [DOI] [PMC free article] [PubMed] [Google Scholar]
- 31.Cools-Lartigue J, Spicer J, McDonald B, Gowing S, Chow S, Giannias B, et al. Neutrophil extracellular traps sequester circulating tumor cells and promote metastasis. J Clin Invest. 2013;123(8):3446–3458. doi: 10.1172/JCI67484. [DOI] [PMC free article] [PubMed] [Google Scholar]
- 32.Spicer JD, McDonald B, Cools-Lartigue JJ, Chow SC, Giannias B, Kubes P, et al. Neutrophils promote liver metastasis via mac-1-mediated interactions with circulating tumor cells. Cancer Res. 2012;72(16):3919–3927. doi: 10.1158/0008-5472.CAN-11-2393. [DOI] [PubMed] [Google Scholar]
- 33.Halazun KJ, Aldoori A, Malik HZ, Al-Mukhtar A, Prasad KR, Toogood GJ, et al. Elevated preoperative neutrophil to lymphocyte ratio predicts survival following hepatic resection for colorectal liver metastases. Eur J Surg Oncol. 2008;34(1):55–60. doi: 10.1016/j.ejso.2007.02.014. [DOI] [PubMed] [Google Scholar]
- 34.Mantovani A, Allavena P, Sica A, Balkwill F. Cancer-related inflammation. Nature. 2008;454(7203):436–444. doi: 10.1038/nature07205. [DOI] [PubMed] [Google Scholar]
- 35.Kitayama J, Yasuda K, Kawai K, Sunami E, Nagawa H. Circulating lymphocyte is an important determinant of the effectiveness of preoperative radiotherapy in advanced rectal cancer. BMC Cancer. 2011;11:64. doi: 10.1186/1471-2407-11-64. [DOI] [PMC free article] [PubMed] [Google Scholar]
- 36.Jass JR. Lymphocytic infiltration and survival in rectal cancer. J Clin Pathol. 1986;39(6):585–589. doi: 10.1136/jcp.39.6.585. [DOI] [PMC free article] [PubMed] [Google Scholar]
- 37.Kusumanto YH, Dam WA, Hospers GA, Meijer C, Mulder NH. Platelets and granulocytes, in particular the neutrophils, form important compartments for circulating vascular endothelial growth factor. Angiogenesis. 2003;6(4):283–287. doi: 10.1023/B:AGEN.0000029415.62384.ba. [DOI] [PubMed] [Google Scholar]
- 38.Grivennikov SI, Greten FR, Karin M. Immunity, inflammation, and cancer. Cell. 2010;140(6):883–899. doi: 10.1016/j.cell.2010.01.025. [DOI] [PMC free article] [PubMed] [Google Scholar]
- 39.Del Prete M, Giampieri R, Loupakis F, Prochilo T, Salvatore L, Faloppi L, et al. Prognostic clinical factors in pretreated colorectal cancer patients receiving regorafenib: implications for clinical management. Oncotarget. 2015;6(32):33982–33992. doi: 10.18632/oncotarget.5053. [DOI] [PMC free article] [PubMed] [Google Scholar]
- 40.Yoneyama Y, Ito M, Sugitou M, Kobayashi A, Nishizawa Y, Saito N. Postoperative lymphocyte percentage influences the long-term disease-free survival following a resection for colorectal carcinoma. Jpn J Clin Oncol. 2011;41(3):343–347. doi: 10.1093/jjco/hyq223. [DOI] [PubMed] [Google Scholar]
- 41.Xiao WW, Zhang LN, You KY, Huang R, Yu X, Ding PR, et al. A low lymphocyte-to-monocyte ratio predicts unfavorable prognosis in pathological T3N0 rectal Cancer patients following Total Mesorectal excision. J Cancer. 2015;6(7):616–622. doi: 10.7150/jca.11727. [DOI] [PMC free article] [PubMed] [Google Scholar]
- 42.Eruslanov E, Neuberger M, Daurkin I, Perrin GQ, Algood C, Dahm P, et al. Circulating and tumor-infiltrating myeloid cell subsets in patients with bladder cancer. Int J Cancer. 2012;130(5):1109–1119. doi: 10.1002/ijc.26123. [DOI] [PubMed] [Google Scholar]
- 43.Landskron G, De la Fuente M, Thuwajit P, Thuwajit C, Hermoso MA. Chronic inflammation and cytokines in the tumor microenvironment. J Immunol Res. 2014;2014:149185. doi: 10.1155/2014/149185. [DOI] [PMC free article] [PubMed] [Google Scholar]
- 44.Wilcox RA, Wada DA, Ziesmer SC, Elsawa SF, Comfere NI, Dietz AB, et al. Monocytes promote tumor cell survival in T-cell lymphoproliferative disorders and are impaired in their ability to differentiate into mature dendritic cells. Blood. 2009;114(14):2936–2944. doi: 10.1182/blood-2009-05-220111. [DOI] [PMC free article] [PubMed] [Google Scholar]
- 45.Chan JC, Chan DL, Diakos CI, Engel A, Pavlakis N, Gill A, et al. The lymphocyte-to-monocyte ratio is a superior predictor of overall survival in comparison to established biomarkers of Resectable colorectal Cancer. Ann Surg. 2017;265(3):539–546. doi: 10.1097/SLA.0000000000001743. [DOI] [PMC free article] [PubMed] [Google Scholar]
- 46.Arends J, Baracos V, Bertz H, Bozzetti F, Calder PC, Deutz NEP, et al. ESPEN expert group recommendations for action against cancer-related malnutrition. Clin Nutr. 2017;36(5):1187–1196. doi: 10.1016/j.clnu.2017.06.017. [DOI] [PubMed] [Google Scholar]
- 47.Beddy D, Pemberton JH. Volume analysis of outcome following restorative proctocolectomy (Br J Surg 2011; 98: 408-417) Br J Surg. 2011;98(7):1031. doi: 10.1002/bjs.7606. [DOI] [PubMed] [Google Scholar]
- 48.Pinato DJ, North BV, Sharma R. A novel, externally validated inflammation-based prognostic algorithm in hepatocellular carcinoma: the prognostic nutritional index (PNI) Br J Cancer. 2012;106(8):1439–1445. doi: 10.1038/bjc.2012.92. [DOI] [PMC free article] [PubMed] [Google Scholar]
- 49.Malietzis G, Giacometti M, Askari A, Nachiappan S, Kennedy RH, Faiz OD, et al. A preoperative neutrophil to lymphocyte ratio of 3 predicts disease-free survival after curative elective colorectal cancer surgery. Ann Surg. 2014;260(2):287–292. doi: 10.1097/SLA.0000000000000216. [DOI] [PubMed] [Google Scholar]
Associated Data
This section collects any data citations, data availability statements, or supplementary materials included in this article.
Data Availability Statement
The datasets used and/or analysed during the current study are available from the corresponding author on reasonable request.